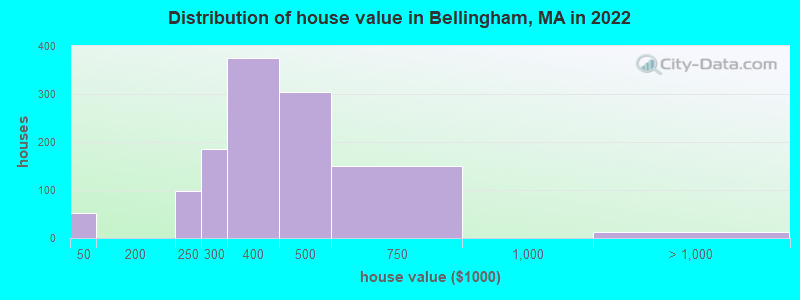
Estimated median house or condo value in 2022: $391,387 (it was $157,200 in 2000)
Bellingham:
$391,387
MA:
$534,700
Mean prices in 2022:all housing units: $811,449; detached houses: $851,375; townhouses or other attached units: $650,242; in 2-unit structures: $825,093; in 3-to-4-unit structures: $853,292; in 5-or-more-unit structures: $584,259; mobile homes: $91,001
Median gross rent in 2022: $1,877.
March 2022 cost of living index in Bellingham: 135.0 (high, U.S. average is 100)
The City-Data.com crime index weighs serious crimes and violent crimes more heavily. Higher means more crime, U.S. average is 246.1. It adjusts for the number of visitors and daily workers commuting into cities.
Latest news from Bellingham, MA collected exclusively by city-data.com from local newspapers, TV, and radio stations
Ancestries: Irish (20.0%), American (13.6%), Italian (10.0%), French (8.0%), French Canadian (7.0%), English (6.1%).
Current Local Time: EST time zone
Incorporated in 1719
Elevation: 293 feet
Land area: 5.28 square miles.
Population density: 919 people per square mile (low).
318 residents are foreign born (2.1% Latin America, 1.7% Asia, 1.4% Europe, 1.4% North America).
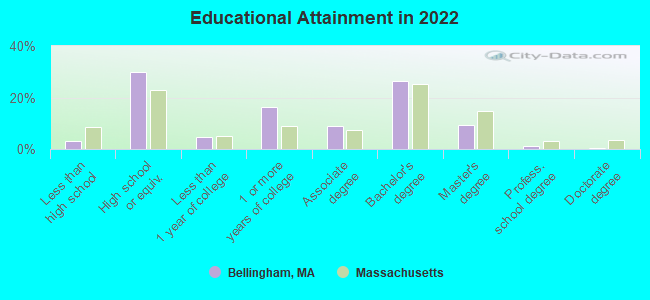
This place:
6.8%
Massachusetts:
17.6%
Median real estate property taxes paid for housing units with mortgages in 2022: $4,263 (1.0%) Median real estate property taxes paid for housing units with no mortgage in 2022: $4,301 (1.2%)
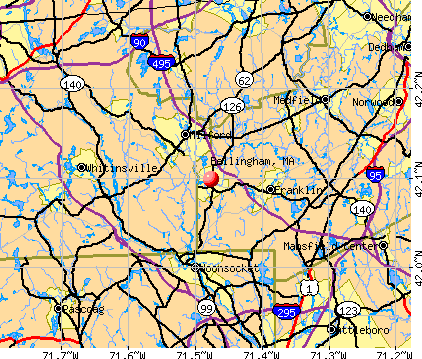
Nearest city with pop. 50,000+: Framingham, MA (14.2 miles , pop. 66,910).
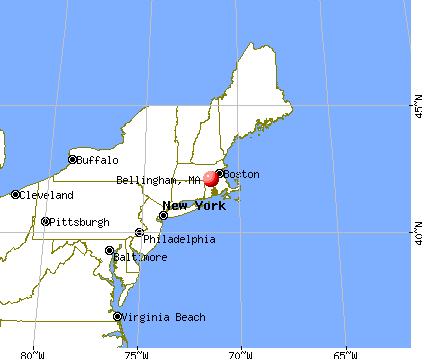
Nearest city with pop. 200,000+: Boston, MA (25.2 miles , pop. 589,141).
Nearest city with pop. 1,000,000+: Bronx, NY (151.4 miles , pop. 1,332,650).
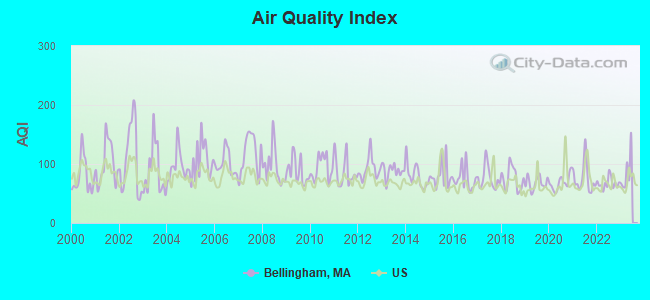
Air Quality Index (AQI) level in 2022 was 67.1. This is about average.
City:
67.1
U.S.:
72.6
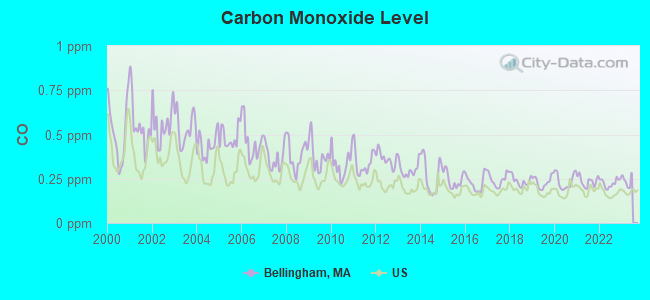
Carbon Monoxide (CO) [ppm] level in 2022 was 0.226. This is about average.Closest monitor was 15.9 miles away from the city center.
City:
0.226
U.S.:
0.251
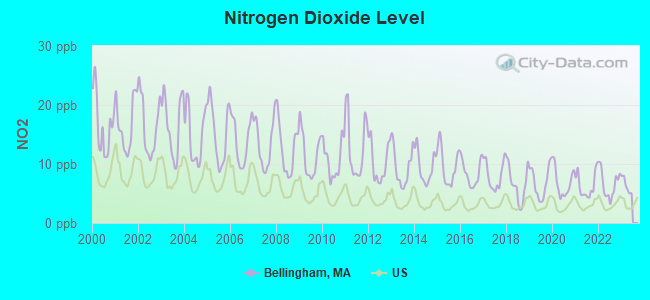
Nitrogen Dioxide (NO2) [ppb] level in 2022 was 6.60. This is worse than average.Closest monitor was 6.7 miles away from the city center.
City:
6.60
U.S.:
5.11
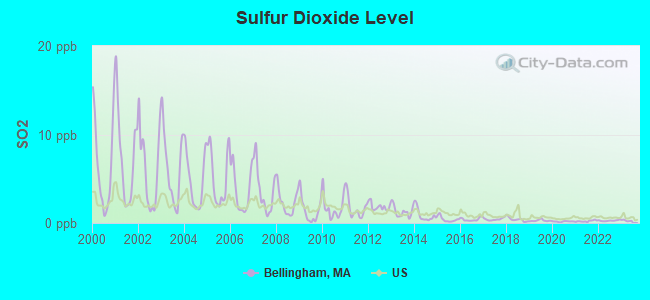
Sulfur Dioxide (SO2) [ppb] level in 2022 was 0.269. This is significantly better than average.Closest monitor was 6.7 miles away from the city center.
City:
0.269
U.S.:
1.515
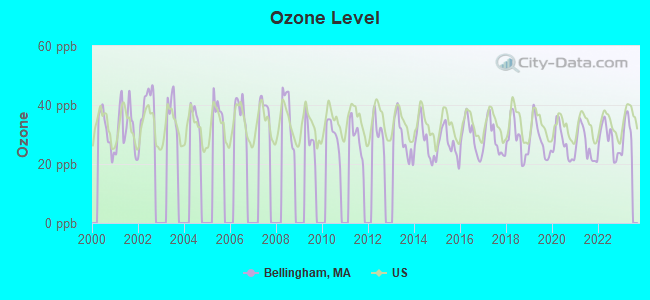
Ozone [ppb] level in 2022 was 28.2. This is about average.Closest monitor was 7.3 miles away from the city center.
City:
28.2
U.S.:
33.3
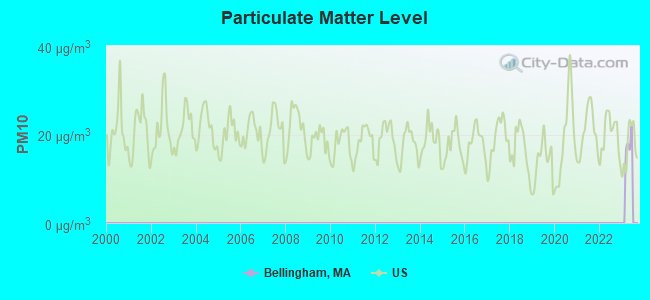
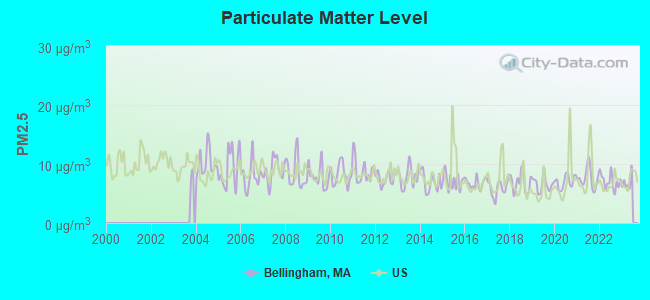
Particulate Matter (PM2.5) [µg/m3] level in 2022 was 7.03. This is about average.Closest monitor was 16.0 miles away from the city center.
City:
7.03
U.S.:
8.11
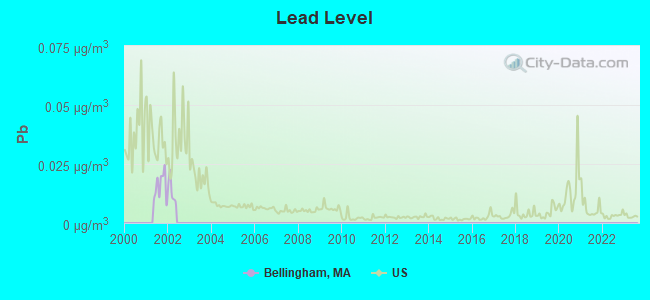
Lead (Pb) [µg/m3] level in 2001 was 0.0156. This is significantly worse than average.Closest monitor was 16.2 miles away from the city center.
City:
0.0156
U.S.:
0.0093
Tornado activity:
Bellingham-area historical tornado activity is near Massachusetts state average. It is 36% smaller than the overall U.S. average.
On 6/9/1953, a category F4 (max. wind speeds 207-260 mph) tornado 14.1 miles away from the Bellingham place center killed 90 peopleand injured 1228 peopleand causedbetween $50,000,000 and $500,000,000 in damages.
On 6/9/1953, a category F3 (max. wind speeds 158-206 mph) tornado 14.6 miles away from the place center injured 17 peopleand causedbetween $500,000 and $5,000,000 in damages.
Earthquake activity:
Bellingham-area historical earthquake activity is significantly above Massachusetts state average. It is 73% smaller than the overall U.S. average.
On 10/7/1983 at 10:18:46, a magnitude 5.3 (5.1 MB, 5.3 LG, 5.1 ML, Class: Moderate, Intensity: VI - VII) earthquake occurred 193.5 miles away from Bellingham center On 4/20/2002 at 10:50:47, a magnitude 5.3 (5.3 ML, Depth: 3.0 mi) earthquake occurred 200.9 miles away from Bellingham center On 1/19/1982 at 00:14:42, a magnitude 4.7 (4.5 MB, 4.7 MD, 4.5 LG, Class: Light, Intensity: IV - V) earthquake occurred 97.2 miles away from the city center On 4/20/2002 at 10:50:47, a magnitude 5.2 (5.2 MB, 4.2 MS, 5.2 MW, 5.0 MW) earthquake occurred 200.1 miles away from Bellingham center On 10/16/2012 at 23:12:25, a magnitude 4.7 (4.7 ML, Depth: 10.0 mi) earthquake occurred 111.7 miles away from Bellingham center On 8/22/1992 at 12:20:32, a magnitude 4.8 (4.8 MB, 3.8 MS, 4.7 LG, Depth: 6.2 mi) earthquake occurred 215.7 miles away from Bellingham center Magnitude types: regional Lg-wave magnitude (LG), body-wave magnitude (MB), duration magnitude (MD), local magnitude (ML), surface-wave magnitude (MS), moment magnitude (MW)
Natural disasters:
The number of natural disasters in Norfolk County (31) is a lot greater than the US average (15). Major Disasters (Presidential) Declared: 18 Emergencies Declared: 13
Causes of natural disasters: Floods: 12, Storms: 10, Hurricanes: 6, Snowstorms: 5, Snows: 3, Winter Storms: 3, Blizzards: 2, Explosion: 1, Heavy Rain: 1, Snowfall: 1, Tropical Storm: 1, Water Main Break: 1, Wind: 1 (Note: some incidents may be assigned to more than one category).
Hospitals and medical centers near Bellingham:
CONTINUING CARE CENTER AT HOPEDALE (Nursing Home, about 2 miles away; HOPEDALE, MA)
HOPEDALE GARDEN NURSING HOME (Nursing Home, about 2 miles away; HOPEDALE, MA)
FMC DIALYSIS SERVICES OF BLACKSTONE VALLEY (Dialysis Facility, about 4 miles away; MILFORD, MA)
VNA AND HOSPICE OF GREATER MILFORD (Home Health Center, about 4 miles away; MILFORD, MA)
BLAIRE HOUSE OF MILFORD (Nursing Home, about 4 miles away; MILFORD, MA)
MILFORD REGIONAL MEDICAL CENTER Acute Care Hospitals (about 4 miles away; MILFORD, MA)
ADIN MANOR CONVALESCENT HOME,T (Nursing Home, about 4 miles away; HOPEDALE, MA)
Amtrak stations near Bellingham:
13 miles: FRAMINGHAM (443 WAVERLY ST.) . Services: public payphones, snack bar, paid short-term parking, taxi stand, public transit connection.
19 miles: ROUTE 128 (WESTWOOD, UNIVERSITY AVE. & RTE. 128) . Services: ticket office, enclosed waiting area, public restrooms, public payphones, vending machines, paid short-term parking, taxi stand, public transit connection.
20 miles: PROVIDENCE (100 GASPEE ST.) . Services: ticket office, fully wheelchair accessible, enclosed waiting area, public restrooms, public payphones, snack bar, ATM, paid short-term parking, paid long-term parking, call for car rental service, taxi stand, public transit connection.
Colleges/universities with over 2000 students nearest to Bellingham:
Bryant University (about 13 miles; Smithfield, RI; Full-time enrollment: 3,440)
Framingham State University (about 14 miles; Framingham, MA; FT enrollment: 5,743)
Wellesley College (about 17 miles; Wellesley, MA; FT enrollment: 2,658)
Babson College (about 18 miles; Wellesley, MA; FT enrollment: 3,230)
Rhode Island College (about 18 miles; Providence, RI; FT enrollment: 7,189)
Providence College (about 18 miles; Providence, RI; FT enrollment: 4,312)
Massachusetts Bay Community College (about 19 miles; Wellesley Hills, MA; FT enrollment: 3,636)
Birthplace of: Jason DeLucia - Martial artist, John Milton Thayer - Union Army general, Levi Cook - Politician, Ted Lewis (voice actor) - Actor.
Norfolk County has a predicted average indoor radon screening level between 2 and 4 pCi/L (pico curies per liter) - Moderate Potential
Drinking water stations with addresses in Bellingham and their reported violations in the past:
BELLINGHAM DPW WATER SEWER DIV. (Population served: 15,285, Groundwater):
Past health violations:
MCL, Monthly (TCR) - In MAY-2013, Contaminant: Coliform. Follow-up actions: St AO (w/o penalty) issued (JUN-28-2013), St Compliance achieved (JUN-28-2013)
MCL, Monthly (TCR) - In JUL-2011, Contaminant: Coliform. Follow-up actions: St AO (w/o penalty) issued (SEP-09-2011)
MCL, Monthly (TCR) - In DEC-2010, Contaminant: Coliform. Follow-up actions: St AO (w/o penalty) issued (FEB-04-2011), St Compliance achieved (FEB-04-2011)
MCL, Monthly (TCR) - In SEP-2009, Contaminant: Coliform. Follow-up actions: St AO (w/o penalty) issued (OCT-13-2009), St Compliance achieved (OCT-13-2009)
MCL, Monthly (TCR) - In JUL-2009, Contaminant: Coliform. Follow-up actions: St AO (w/o penalty) issued (AUG-25-2009), St Compliance achieved (AUG-25-2009)
MCL, Monthly (TCR) - In NOV-2008, Contaminant: Coliform. Follow-up actions: St AO (w/o penalty) issued (JAN-26-2009), St Compliance achieved (JAN-26-2009)
Past monitoring violations:
Monitoring, Repeat Major (TCR) - In DEC-2013, Contaminant: Coliform (TCR). Follow-up actions: St AO (w/o penalty) issued (MAR-03-2014)
Monitoring and Reporting (DBP) - Between OCT-2005 and DEC-2005, Contaminant: TTHM. Follow-up actions: St AO (w/o penalty) issued (FEB-17-2006)
Average household size:
This place:
2.5 people
Massachusetts:
2.5 people
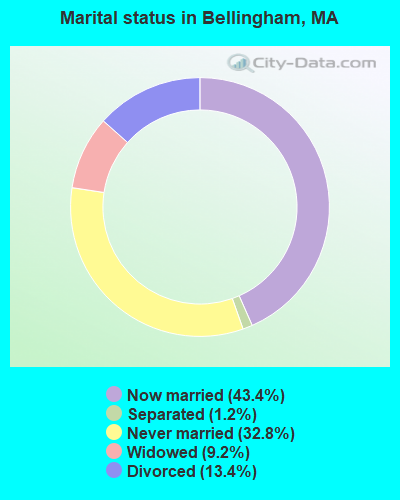
Percentage of family households:
This place:
68.2%
Whole state:
63.0%
Percentage of households with unmarried partners:
This place:
6.9%
Whole state:
7.0%
Likely homosexual households (counted as self-reported same-sex unmarried-partner households)
Lesbian couples: 0.4% of all households
Gay men: 0.2% of all households
2 people in other noninstitutional facilities in 2010
Banks with branches in Bellingham (2011 data):
RBS Citizens, National Association: Bellingham Stop & Shop Branch at 70 Pulaski Boulevard, branch established on 2004/10/28; Bellingham Dunkin Donuts at 815 South Main Street, branch established on 2009/10/05. Info updated 2007/09/19: Bank assets: $106,940.6 mil, Deposits: $75,690.2 mil, headquarters in Providence, RI, positive income, 1135 total offices, Holding Company: Uk Financial Investments Limited
Dean Co-operative Bank: Pulaski Branch at 411 Pulaski Boulevard, branch established on 1987/10/13; Operations Branch at 435-437 Pulaski Boulevard, branch established on 2000/01/01. Info updated 2006/11/03: Bank assets: $223.1 mil, Deposits: $183.8 mil, headquarters in Franklin, MA, positive income, Mortgage Lending Specialization, 5 total offices
Middlesex Savings Bank: Bellingham Branch at 267 Hartford Avenue, branch established on 1999/06/25. Info updated 2009/07/16: Bank assets: $4,034.8 mil, Deposits: $3,490.0 mil, headquarters in Natick, MA, positive income, Mortgage Lending Specialization, 33 total offices, Holding Company: Middlesex Bancorp Mhc
Charles River Bank: Bellingham Branch at 3 South Maple St, branch established on 2009/03/30. Info updated 2009/07/27: Bank assets: $187.0 mil, Deposits: $156.1 mil, headquarters in Medway, MA, positive income, Mortgage Lending Specialization, 4 total offices, Holding Company: Charles River Bancorp, Mhc
Sovereign Bank, National Association: Bellingham Branch at 13 North Main Street, branch established on 1970/11/18. Info updated 2012/01/31: Bank assets: $78,146.9 mil, Deposits: $48,042.9 mil, headquarters in Wilmington, DE, positive income, Commercial Lending Specialization, 718 total offices, Holding Company: Banco Santander, S.A.
The Milford National Bank and Trust Company: Bellingham Branch at 286 Hartford Avenue, branch established on 1999/08/12. Info updated 2006/11/03: Bank assets: $267.5 mil, Deposits: $233.6 mil, headquarters in Milford, MA, positive income, Commercial Lending Specialization, 6 total offices, Holding Company: Mnb Bancorp
Rockland Trust Company: Bellingham Branch at 4 North Main Street, branch established on 1974/04/09. Info updated 2009/05/20: Bank assets: $4,974.4 mil, Deposits: $3,903.9 mil, headquarters in Rockland, MA, positive income, Commercial Lending Specialization, 67 total offices, Holding Company: Independent Bank Corp.
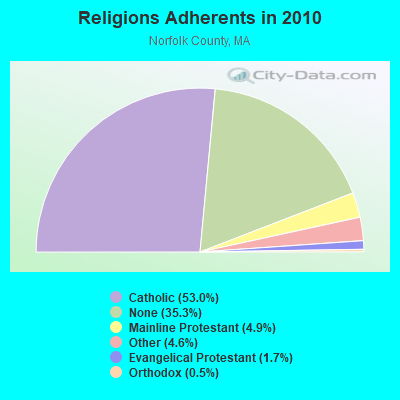
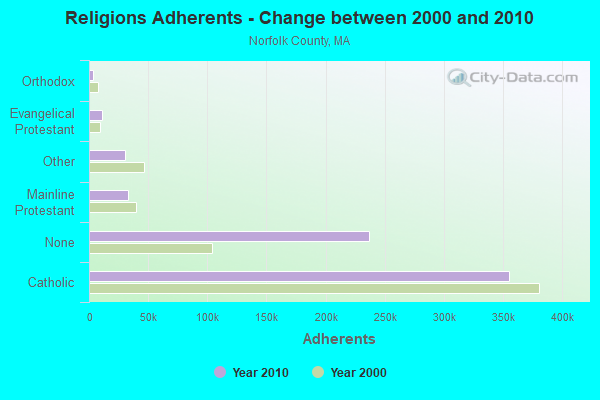
Religion statistics for Bellingham, MA (based on Norfolk County data)
Religion
Adherents
Congregations
Catholic
355,321
52
Mainline Protestant
33,086
115
Other
30,593
75
Evangelical Protestant
11,323
89
Orthodox
3,539
9
None
236,988
-
Source: Clifford Grammich, Kirk Hadaway, Richard Houseal, Dale E.Jones, Alexei Krindatch, Richie Stanley and Richard H.Taylor. 2012. 2010 U.S.Religion Census: Religious Congregations & Membership Study. Association of Statisticians of American Religious Bodies. Jones, Dale E., et al. 2002. Congregations and Membership in the United States 2000. Nashville, TN: Glenmary Research Center. Graphs represent county-level data
Aircraft: STINSON 108-1 (Category: Land, Seats: 4, Weight: Up to 12,499 Pounds, Speed: 84 mph), Engine: FRANKLIN 6A4165 SERIES (165 HP) (Reciprocating) N-Number: 875D, N875D, N-875D, Serial Number: 1082875, Year manufactured: 1947 Registrant (Individual): George F Cartier, 151 S Main St, S Bellingham, MA 00000
Home Mortgage Disclosure Act Aggregated Statistics For Year 2009 (Based on 1 partial tract)
A) FHA, FSA/RHS & VA Home Purchase Loans
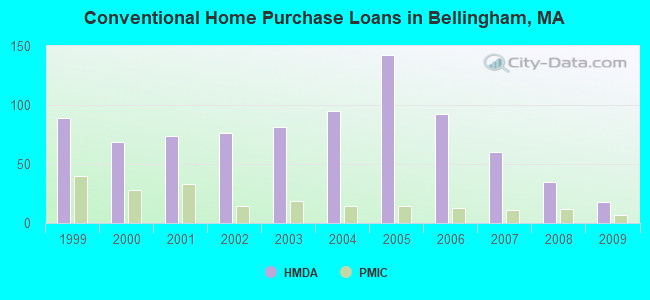
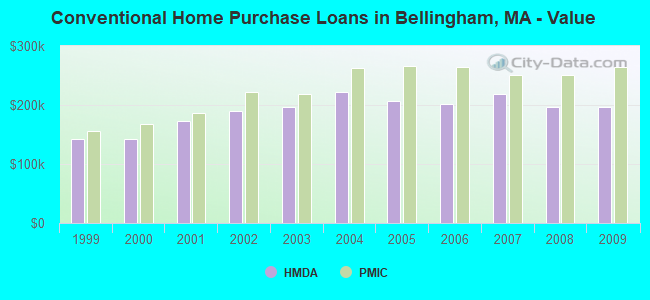
B) Conventional Home Purchase Loans
C) Refinancings
D) Home Improvement Loans
F) Non-occupant Loans on < 5 Family Dwellings (A B C & D)
Number
Average Value
Number
Average Value
Number
Average Value
Number
Average Value
Number
Average Value
LOANS ORIGINATED
23
$228,094
18
$196,232
139
$207,796
8
$89,586
4
$153,122
APPLICATIONS APPROVED, NOT ACCEPTED
2
$200,120
2
$143,060
7
$235,090
0
$0
1
$79,940
APPLICATIONS DENIED
4
$190,888
3
$222,540
45
$223,032
2
$50,720
3
$152,527
APPLICATIONS WITHDRAWN
2
$180,550
4
$170,352
28
$230,345
3
$129,557
1
$54,580
FILES CLOSED FOR INCOMPLETENESS
0
$0
1
$27,570
8
$235,542
2
$30,320
0
$0
Aggregated Statistics For Year 2008 (Based on 1 partial tract)
A) FHA, FSA/RHS & VA Home Purchase Loans
B) Conventional Home Purchase Loans
C) Refinancings
D) Home Improvement Loans
F) Non-occupant Loans on < 5 Family Dwellings (A B C & D)
Number
Average Value
Number
Average Value
Number
Average Value
Number
Average Value
Number
Average Value
LOANS ORIGINATED
12
$267,656
35
$197,129
61
$222,300
5
$126,688
5
$222,394
APPLICATIONS APPROVED, NOT ACCEPTED
2
$314,790
2
$258,010
6
$282,357
1
$2,760
1
$155,470
APPLICATIONS DENIED
2
$205,085
4
$177,932
37
$247,459
8
$82,832
3
$225,483
APPLICATIONS WITHDRAWN
0
$0
3
$295,130
17
$257,003
1
$11,030
0
$0
FILES CLOSED FOR INCOMPLETENESS
0
$0
2
$150,780
5
$211,368
1
$165,390
0
$0
Aggregated Statistics For Year 2007 (Based on 1 partial tract)
B) Conventional Home Purchase Loans
C) Refinancings
D) Home Improvement Loans
E) Loans on Dwellings For 5+ Families
F) Non-occupant Loans on < 5 Family Dwellings (A B C & D)
Number
Average Value
Number
Average Value
Number
Average Value
Number
Average Value
Number
Average Value
LOANS ORIGINATED
60
$218,673
99
$193,996
22
$71,243
0
$0
4
$151,745
APPLICATIONS APPROVED, NOT ACCEPTED
10
$208,943
14
$209,888
1
$58,990
0
$0
1
$99,230
APPLICATIONS DENIED
6
$201,592
66
$223,452
15
$101,072
0
$0
3
$201,593
APPLICATIONS WITHDRAWN
9
$222,174
24
$196,860
6
$94,732
1
$242,570
1
$14,330
FILES CLOSED FOR INCOMPLETENESS
2
$174,210
11
$228,238
1
$46,860
0
$0
0
$0
Aggregated Statistics For Year 2006 (Based on 1 partial tract)
A) FHA, FSA/RHS & VA Home Purchase Loans
B) Conventional Home Purchase Loans
C) Refinancings
D) Home Improvement Loans
F) Non-occupant Loans on < 5 Family Dwellings (A B C & D)
G) Loans On Manufactured Home Dwelling (A B C & D)
Number
Average Value
Number
Average Value
Number
Average Value
Number
Average Value
Number
Average Value
Number
Average Value
LOANS ORIGINATED
1
$277,300
92
$201,680
135
$180,745
28
$75,174
7
$171,219
1
$22,600
APPLICATIONS APPROVED, NOT ACCEPTED
0
$0
6
$274,363
17
$166,168
4
$129,555
1
$229,340
0
$0
APPLICATIONS DENIED
0
$0
11
$230,394
68
$234,173
14
$87,341
2
$184,685
1
$82,700
APPLICATIONS WITHDRAWN
0
$0
7
$193,743
51
$220,585
5
$147,308
4
$195,850
0
$0
FILES CLOSED FOR INCOMPLETENESS
0
$0
3
$241,103
11
$206,787
1
$25,910
0
$0
0
$0
Aggregated Statistics For Year 2005 (Based on 1 partial tract)
A) FHA, FSA/RHS & VA Home Purchase Loans
B) Conventional Home Purchase Loans
C) Refinancings
D) Home Improvement Loans
F) Non-occupant Loans on < 5 Family Dwellings (A B C & D)
G) Loans On Manufactured Home Dwelling (A B C & D)
Number
Average Value
Number
Average Value
Number
Average Value
Number
Average Value
Number
Average Value
Number
Average Value
LOANS ORIGINATED
1
$284,470
142
$206,198
180
$201,993
28
$93,426
9
$210,290
1
$11,030
APPLICATIONS APPROVED, NOT ACCEPTED
1
$125,150
10
$247,864
18
$185,788
3
$83,247
1
$191,850
0
$0
APPLICATIONS DENIED
0
$0
25
$221,799
63
$225,359
7
$123,176
0
$0
0
$0
APPLICATIONS WITHDRAWN
1
$149,400
13
$195,881
79
$244,505
5
$172,778
7
$181,377
0
$0
FILES CLOSED FOR INCOMPLETENESS
0
$0
3
$224,747
28
$240,052
0
$0
1
$114,670
0
$0
Aggregated Statistics For Year 2004 (Based on 1 partial tract)
A) FHA, FSA/RHS & VA Home Purchase Loans
B) Conventional Home Purchase Loans
C) Refinancings
D) Home Improvement Loans
F) Non-occupant Loans on < 5 Family Dwellings (A B C & D)
Number
Average Value
Number
Average Value
Number
Average Value
Number
Average Value
Number
Average Value
LOANS ORIGINATED
1
$130,110
95
$222,598
202
$189,500
30
$95,706
6
$220,703
APPLICATIONS APPROVED, NOT ACCEPTED
0
$0
8
$244,295
23
$165,630
4
$80,765
1
$95,370
APPLICATIONS DENIED
0
$0
11
$180,375
59
$203,607
16
$85,279
0
$0
APPLICATIONS WITHDRAWN
0
$0
10
$217,764
53
$185,570
6
$68,913
1
$137,830
FILES CLOSED FOR INCOMPLETENESS
0
$0
2
$179,725
31
$238,179
3
$159,143
0
$0
Aggregated Statistics For Year 2003 (Based on 1 partial tract)
A) FHA, FSA/RHS & VA Home Purchase Loans
B) Conventional Home Purchase Loans
C) Refinancings
D) Home Improvement Loans
F) Non-occupant Loans on < 5 Family Dwellings (A B C & D)
Number
Average Value
Number
Average Value
Number
Average Value
Number
Average Value
Number
Average Value
LOANS ORIGINATED
5
$219,638
81
$196,794
482
$165,912
7
$38,749
9
$179,357
APPLICATIONS APPROVED, NOT ACCEPTED
0
$0
4
$199,985
50
$167,286
4
$19,570
1
$121,290
APPLICATIONS DENIED
1
$140,030
7
$180,511
82
$175,401
7
$25,360
2
$104,470
APPLICATIONS WITHDRAWN
0
$0
8
$155,329
56
$174,969
2
$39,140
1
$110,260
FILES CLOSED FOR INCOMPLETENESS
0
$0
1
$170,350
8
$169,939
0
$0
0
$0
Aggregated Statistics For Year 2002 (Based on 1 partial tract)
A) FHA, FSA/RHS & VA Home Purchase Loans
B) Conventional Home Purchase Loans
C) Refinancings
D) Home Improvement Loans
F) Non-occupant Loans on < 5 Family Dwellings (A B C & D)
Number
Average Value
Number
Average Value
Number
Average Value
Number
Average Value
Number
Average Value
LOANS ORIGINATED
6
$217,303
76
$189,727
330
$149,608
14
$36,110
4
$155,052
APPLICATIONS APPROVED, NOT ACCEPTED
1
$94,820
7
$193,270
30
$148,153
10
$54,083
1
$58,440
APPLICATIONS DENIED
1
$146,650
4
$167,870
48
$154,525
14
$35,323
2
$24,535
APPLICATIONS WITHDRAWN
0
$0
2
$246,980
59
$148,543
5
$62,518
1
$6,060
FILES CLOSED FOR INCOMPLETENESS
0
$0
1
$101,440
7
$150,190
0
$0
0
$0
Aggregated Statistics For Year 2001 (Based on 1 partial tract)
A) FHA, FSA/RHS & VA Home Purchase Loans
B) Conventional Home Purchase Loans
C) Refinancings
D) Home Improvement Loans
F) Non-occupant Loans on < 5 Family Dwellings (A B C & D)
Number
Average Value
Number
Average Value
Number
Average Value
Number
Average Value
Number
Average Value
LOANS ORIGINATED
12
$176,140
74
$173,220
265
$140,463
15
$29,513
6
$131,760
APPLICATIONS APPROVED, NOT ACCEPTED
1
$94,820
4
$188,270
25
$104,460
6
$59,448
1
$5,510
APPLICATIONS DENIED
1
$133,970
4
$127,625
50
$121,551
19
$37,402
2
$30,595
APPLICATIONS WITHDRAWN
1
$162,080
3
$134,700
51
$137,133
4
$36,662
1
$149,950
FILES CLOSED FOR INCOMPLETENESS
0
$0
1
$39,690
5
$117,316
1
$78,280
1
$111,910
Aggregated Statistics For Year 2000 (Based on 1 partial tract)
A) FHA, FSA/RHS & VA Home Purchase Loans
B) Conventional Home Purchase Loans
C) Refinancings
D) Home Improvement Loans
F) Non-occupant Loans on < 5 Family Dwellings (A B C & D)
Number
Average Value
Number
Average Value
Number
Average Value
Number
Average Value
Number
Average Value
LOANS ORIGINATED
12
$154,180
69
$142,140
71
$115,688
19
$27,246
3
$90,413
APPLICATIONS APPROVED, NOT ACCEPTED
1
$95,930
3
$143,890
15
$106,585
10
$21,225
1
$52,370
APPLICATIONS DENIED
2
$150,230
8
$133,346
40
$90,992
14
$26,423
0
$0
APPLICATIONS WITHDRAWN
0
$0
5
$165,170
34
$86,943
6
$43,002
1
$49,620
FILES CLOSED FOR INCOMPLETENESS
0
$0
2
$121,560
4
$76,218
2
$71,945
0
$0
Aggregated Statistics For Year 1999 (Based on 1 partial tract)
A) FHA, FSA/RHS & VA Home Purchase Loans
B) Conventional Home Purchase Loans
C) Refinancings
D) Home Improvement Loans
F) Non-occupant Loans on < 5 Family Dwellings (A B C & D)
Detailed PMIC statistics for the following Tracts:4431.01
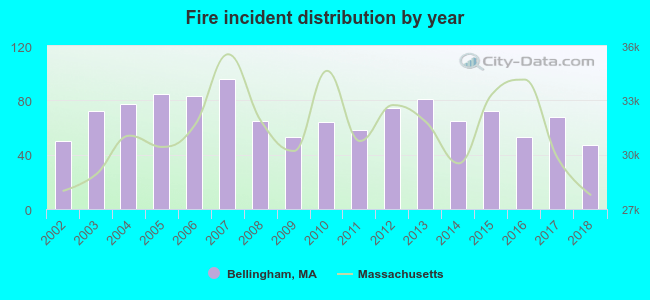
2002 - 2018 National Fire Incident Reporting System (NFIRS) incidents
According to the data from the years 2002 - 2018 the average number of fires per year is 68. The highest number of reported fires - 96 took place in 2007, and the least - 47 in 2018. The data has a declining trend.
When looking into fire subcategories, the most reports belonged to: Structure Fires (49.0%), and Outside Fires (33.0%).
Fire incident types reported to NFIRS in Bellingham, MA


 Recent articles from our blog. Our writers, many of them Ph.D. graduates or candidates, create easy-to-read articles on a wide variety of topics.

 (14.2 miles
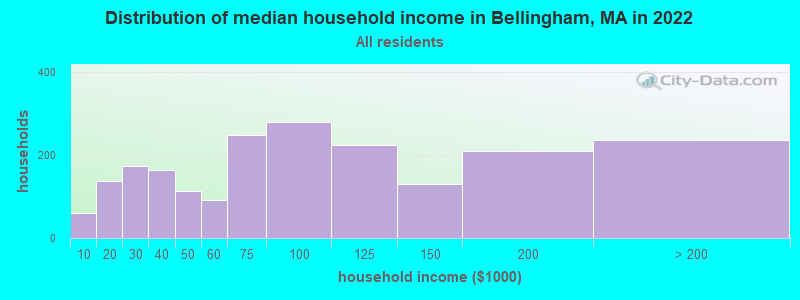


 According to the data from the years 2002 - 2018 the average number of fires per year is 68. The highest number of reported fires - 96 took place in 2007, and the least - 47 in 2018. The data has a declining trend.
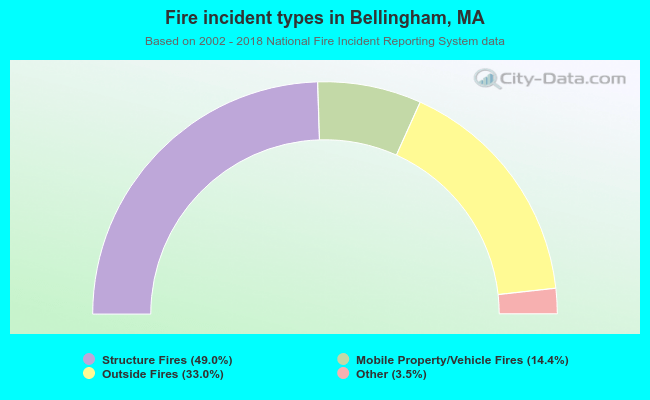 When looking into fire subcategories, the most reports belonged to: Structure Fires (49.0%), and Outside Fires (33.0%).