Estimated zip code population in 2022: 17,019 Zip code population in 2010: 16,332 Zip code population in 2000: 15,314
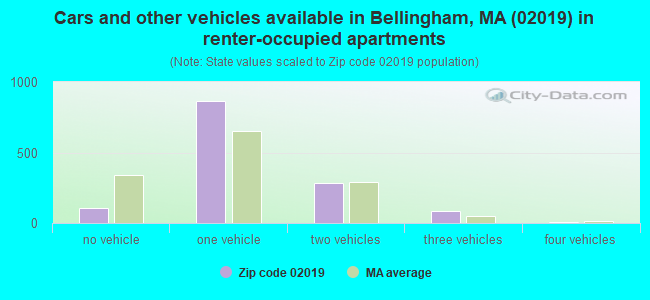
Houses and condos: 6,707 Renter-occupied apartments: 1,334
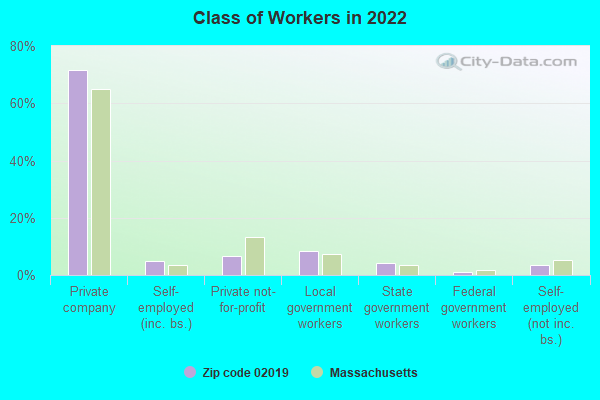
% of renters here:
21%
State:
38%
March 2022 cost of living index in zip code 02019: 131.5 (high, U.S. average is 100)
Land area: 18.3 sq. mi. Water area: 0.5 sq. mi.
Population density: 928 people per square mile
(low).
OSM Map
Google Map
MSN Map
OSM Map
General Map
Google Map
MSN Map
OSM Map
Google Map
MSN Map
OSM Map
Google Map
MSN Map
Please wait while loading the map...
Real estate property taxes paid for housing units in 2022:
This zip code:
1.1% ($4,603)
Massachusetts:
1.0% ($5,536)
Median real estate property taxes paid for housing units with mortgages in 2022: $4,530 (1.0%) Median real estate property taxes paid for housing units with no mortgage in 2022: $4,764 (1.2%)
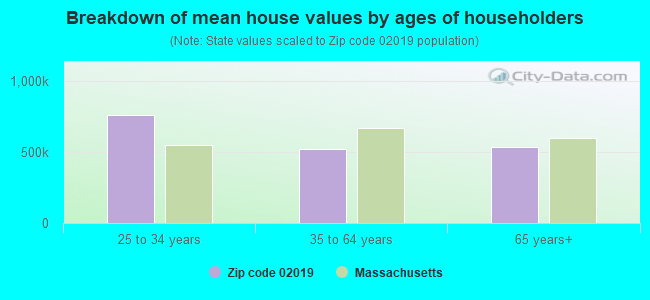
Estimated median house/condo value in 2022: $437,351
02019:
$437,351
Massachusetts:
$534,700
According to our research of Massachusetts and other state lists, there were 8 registered sex offenders living in 02019 zip code as of April 27, 2024. The ratio of all residents to sex offenders in zip code 02019 is 2,134 to 1. The ratio of registered sex offenders to all residents in this zip code is lower than the state average.
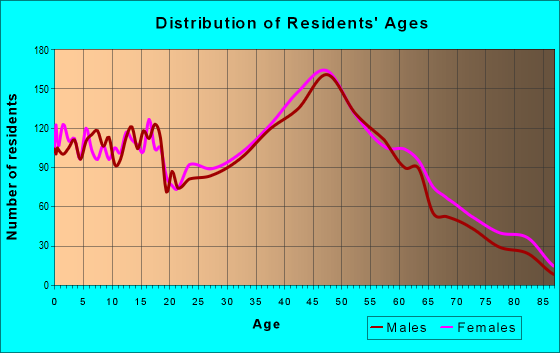
Median resident age:
This zip code:
38.8 years
Massachusetts median age:
40.3 years
Average household size:
This zip code:
2.7 people
Massachusetts:
2.4 people
Averages for the 2020 tax year for zip code 02019, filed in 2021:
Average Adjusted Gross Income (AGI) in 2020: $79,417 (Individual Income Tax Returns)
Here:
$79,417
State:
$105,130
Salary/wage: $72,744 (reported on 84.5% of returns)
Here:
$72,744
State:
$82,951
(% of AGI for various income ranges: 1074.1% for AGIs below $25k, 3500.7% for AGIs $25k-50k, 6491.2% for AGIs $50k-75k, 9408.1% for AGIs $75k-100k, 18528.1% for AGIs $100k-200k, 76612.8% for AGIs over 200k)
Taxable interest for individuals: $771 (reported on 37.4% of returns)
This zip code:
$771
Massachusetts:
$2,361
(% of AGI for various income ranges: 22.6% for AGIs below $25k, 17.1% for AGIs $25k-50k, 29.8% for AGIs $50k-75k, 39.7% for AGIs $75k-100k, 57.5% for AGIs $100k-200k, 431.7% for AGIs over 200k)
Ordinary dividends: $2,385 (reported on 20.7% of returns)
Here:
$2,385
State:
$10,365
(% of AGI for various income ranges: 24.8% for AGIs below $25k, 30.4% for AGIs $25k-50k, 48.8% for AGIs $50k-75k, 74.9% for AGIs $75k-100k, 130.7% for AGIs $100k-200k, 607.2% for AGIs over 200k)
Net capital gain/loss in AGI: +$9,904 (reported on 18.1% of returns)
Here:
+$9,904
State:
+$48,178
(% of AGI for various income ranges: 13.8% for AGIs below $25k, 29.0% for AGIs $25k-50k, 90.5% for AGIs $50k-75k, 97.7% for AGIs $75k-100k, 386.9% for AGIs $100k-200k, 5258.3% for AGIs over 200k)
Profit/loss from business: +$14,666 (reported on 13.1% of returns)
Here:
+$14,666
State:
+$20,792
(% of AGI for various income ranges: 103.6% for AGIs below $25k, 178.6% for AGIs $25k-50k, 237.1% for AGIs $50k-75k, 307.4% for AGIs $75k-100k, 362.2% for AGIs $100k-200k, 2453.3% for AGIs over 200k)
Taxable individual retirement arrangement distribution: $16,261 (reported on 9.5% of returns)
02019:
$16,261
Massachusetts:
$22,790
(% of AGI for various income ranges: 80.3% for AGIs below $25k, 109.9% for AGIs $25k-50k, 221.2% for AGIs $50k-75k, 325.2% for AGIs $75k-100k, 426.4% for AGIs $100k-200k, 846.7% for AGIs over 200k)
Self-employed (Keogh) retirement plans: $13,800 (reported on 0.3% of returns)
02019:
$13,800
Massachusetts:
$26,868
(% of AGI for various income ranges: 34.2% for AGIs $100k-200k)
Total itemized deductions: $25,237 (reported on 13.2% of returns)
Here:
$25,237
State:
$36,722
(% of AGI for various income ranges: 88.6% for AGIs below $25k, 180.5% for AGIs $25k-50k, 368.3% for AGIs $50k-75k, 657.9% for AGIs $75k-100k, 916.0% for AGIs $100k-200k, 3816.7% for AGIs over 200k)
Charity contributions: $3,814 (reported on 9.8% of returns)
Here:
$3,814
State:
$12,529
(% of AGI for various income ranges: 3.9% for AGIs below $25k, 9.6% for AGIs $25k-50k, 23.8% for AGIs $50k-75k, 46.7% for AGIs $75k-100k, 95.9% for AGIs $100k-200k, 824.4% for AGIs over 200k)
Taxes paid: $8,394 (reported on 13.2% of returns)
02019:
$8,394
State:
$8,782
(% of AGI for various income ranges: 18.4% for AGIs below $25k, 52.9% for AGIs $25k-50k, 137.5% for AGIs $50k-75k, 260.1% for AGIs $75k-100k, 324.2% for AGIs $100k-200k, 1025.6% for AGIs over 200k)
Earned income credit: $1,630 (reported on 7.0% of returns)
Here:
$1,630
State:
$1,909
(% of AGI for various income ranges: 39.2% for AGIs below $25k, 33.8% for AGIs $25k-50k)
Percentage of individuals using paid preparers for their 2020 taxes: 93.7%
Here:
94%
State:
92%
(% for various income ranges: 91.2% for AGIs below $25k, 94.5% for AGIs $25k-50k, 94.0% for AGIs $50k-75k, 93.4% for AGIs $75k-100k, 94.9% for AGIs $100k-200k, 96.4% for AGIs over 200k)
Averages for the 2012 tax year for zip code 02019, filed in 2013:
Average Adjusted Gross Income (AGI) in 2012: $65,456 (Individual Income Tax Returns)
Here:
$65,456
State:
$81,425
Salary/wage: $61,212 (reported on 87.4% of returns)
Here:
$61,212
State:
$64,752
(% of AGI for various income ranges: 73.1% for AGIs below $25k, 77.7% for AGIs $25k-50k, 80.2% for AGIs $50k-75k, 83.1% for AGIs $75k-100k, 87.9% for AGIs $100k-200k, 74.0% for AGIs over 200k)
Taxable interest for individuals: $638 (reported on 41.1% of returns)
This zip code:
$638
Massachusetts:
$2,136
(% of AGI for various income ranges: 1.1% for AGIs below $25k, 0.6% for AGIs $25k-50k, 0.4% for AGIs $50k-75k, 0.3% for AGIs $75k-100k, 0.2% for AGIs $100k-200k, 0.6% for AGIs over 200k)
Ordinary dividends: $2,757 (reported on 21.6% of returns)
Here:
$2,757
State:
$9,473
(% of AGI for various income ranges: 1.2% for AGIs below $25k, 0.7% for AGIs $25k-50k, 0.7% for AGIs $50k-75k, 0.4% for AGIs $75k-100k, 0.6% for AGIs $100k-200k, 2.3% for AGIs over 200k)
Net capital gain/loss in AGI: +$4,936 (reported on 16.2% of returns)
Here:
+$4,936
State:
+$31,437
(% of AGI for various income ranges: 0.2% for AGIs $25k-50k, 0.4% for AGIs $75k-100k, 0.7% for AGIs $100k-200k, 5.1% for AGIs over 200k)
Profit/loss from business: +$10,655 (reported on 11.9% of returns)
Here:
+$10,655
State:
+$20,662
(% of AGI for various income ranges: 6.2% for AGIs below $25k, 3.2% for AGIs $25k-50k, 2.5% for AGIs $50k-75k, 1.6% for AGIs $75k-100k, 1.2% for AGIs $100k-200k, 1.2% for AGIs over 200k)
Taxable individual retirement arrangement distribution: $14,143 (reported on 9.4% of returns)
02019:
$14,143
Massachusetts:
$18,892
(% of AGI for various income ranges: 4.1% for AGIs below $25k, 2.5% for AGIs $25k-50k, 2.3% for AGIs $50k-75k, 2.2% for AGIs $75k-100k, 1.8% for AGIs $100k-200k, 1.0% for AGIs over 200k)
Self-employment retirement plans: $15,367 (reported on 0.4% of returns)
02019:
$15,367
Massachusetts:
$20,669
Total itemized deductions: $21,608 (20% of AGI, reported on 45.0% of returns)
Here:
$21,608
State:
$28,907
Here:
20.4% of AGI
State:
18.2% of AGI
(% of AGI for various income ranges: 12.8% for AGIs below $25k, 11.7% for AGIs $25k-50k, 14.9% for AGIs $50k-75k, 16.6% for AGIs $75k-100k, 16.3% for AGIs $100k-200k, 12.9% for AGIs over 200k)
Charity contributions: $1,673 (reported on 36.7% of returns)
Here:
$1,673
State:
$4,208
(% of AGI for various income ranges: 0.6% for AGIs below $25k, 0.7% for AGIs $25k-50k, 0.8% for AGIs $50k-75k, 1.0% for AGIs $75k-100k, 1.0% for AGIs $100k-200k, 1.1% for AGIs over 200k)
Taxes paid: $9,269 (reported on 45.0% of returns)
02019:
$9,269
State:
$13,303
(% of AGI for various income ranges: 3.6% for AGIs below $25k, 3.7% for AGIs $25k-50k, 5.7% for AGIs $50k-75k, 6.7% for AGIs $75k-100k, 7.4% for AGIs $100k-200k, 7.1% for AGIs over 200k)
Earned income credit: $1,751 (reported on 8.7% of returns)
Here:
$1,751
State:
$1,971
(% of AGI for various income ranges: 3.2% for AGIs below $25k, 0.5% for AGIs $25k-50k)
Percentage of individuals using paid preparers for their 2012 taxes: 53.0%
Here:
53%
State:
56%
(% for various income ranges: 46.4% for AGIs below $25k, 50.6% for AGIs $25k-50k, 58.8% for AGIs $50k-75k, 58.2% for AGIs $75k-100k, 56.0% for AGIs $100k-200k, 67.9% for AGIs over 200k)
Averages for the 2004 tax year for zip code 02019, filed in 2005:
Average Adjusted Gross Income (AGI) in 2004: $54,375 (Individual Income Tax Returns)
Here:
$54,375
State:
$62,877
Salary/wage: $51,836 (reported on 89.3% of returns)
Here:
$51,836
State:
$52,969
(% of AGI for various income ranges: 99.0% for AGIs below $10k, 69.4% for AGIs $10k-25k, 83.3% for AGIs $25k-50k, 87.5% for AGIs $50k-75k, 90.3% for AGIs $75k-100k, 83.5% for AGIs over 100k)
Taxable interest for individuals: $795 (reported on 57.1% of returns)
This zip code:
$795
Massachusetts:
$1,945
(% of AGI for various income ranges: 3.7% for AGIs below $10k, 2.4% for AGIs $10k-25k, 1.1% for AGIs $25k-50k, 0.7% for AGIs $50k-75k, 0.4% for AGIs $75k-100k, 0.7% for AGIs over 100k)
Taxable dividends: $1,464 (reported on 25.6% of returns)
Here:
$1,464
State:
$5,323
(% of AGI for various income ranges: 2.6% for AGIs below $10k, 1.0% for AGIs $10k-25k, 0.6% for AGIs $25k-50k, 0.3% for AGIs $50k-75k, 0.3% for AGIs $75k-100k, 1.1% for AGIs over 100k)
Net capital gain/loss: +$6,643 (reported on 19.2% of returns)
Here:
+$6,643
State:
+$20,377
(% of AGI for various income ranges: -2.1% for AGIs below $10k, 0.3% for AGIs $10k-25k, 0.2% for AGIs $25k-50k, 0.5% for AGIs $50k-75k, 0.5% for AGIs $75k-100k, 5.9% for AGIs over 100k)
Profit/loss from business: +$9,346 (reported on 13.2% of returns)
Here:
+$9,346
State:
+$17,837
(% of AGI for various income ranges: -0.8% for AGIs below $10k, 5.8% for AGIs $10k-25k, 4.1% for AGIs $25k-50k, 2.7% for AGIs $50k-75k, 1.7% for AGIs $75k-100k, 1.1% for AGIs over 100k)
IRA payment deduction: $2,722 (reported on 3.2% of returns)
02019:
$2,722
Massachusetts:
$3,100
(% of AGI for various income ranges: 0.3% for AGIs $10k-25k, 0.3% for AGIs $25k-50k, 0.2% for AGIs $50k-75k, 0.1% for AGIs $75k-100k, 0.1% for AGIs over 100k)
Self-employed pension: $8,058 (reported on 0.7% of returns)
Here:
$8,058
Massachusetts:
$14,516
Total itemized deductions: $18,728 (23% of AGI, reported on 50.5% of returns)
Here:
$18,728
State:
$22,573
Here:
22.8% of AGI
State:
19.5% of AGI
(% of AGI for various income ranges: 18.6% for AGIs below $10k, 12.9% for AGIs $10k-25k, 16.4% for AGIs $25k-50k, 19.9% for AGIs $50k-75k, 19.5% for AGIs $75k-100k, 15.8% for AGIs over 100k)
Charity contributions deductions: $1,688 (2% of AGI, reported on 46.4% of returns)
Here:
$1,688
State:
$3,295
Here:
2.0% of AGI
State:
2.7% of AGI
(% of AGI for various income ranges: 0.7% for AGIs below $10k, 1.0% for AGIs $10k-25k, 1.3% for AGIs $25k-50k, 1.4% for AGIs $50k-75k, 1.5% for AGIs $75k-100k, 1.5% for AGIs over 100k)
Total tax: $7,281 (reported on 82.9% of returns)
02019:
$7,281
State:
$11,494
(% of AGI for various income ranges: 2.7% for AGIs below $10k, 5.0% for AGIs $10k-25k, 7.6% for AGIs $25k-50k, 8.6% for AGIs $50k-75k, 9.7% for AGIs $75k-100k, 16.0% for AGIs over 100k)
Earned income credit: $1,308 (reported on 6.5% of returns)
Here:
$1,308
State:
$1,518
Percentage of individuals using paid preparers for their 2004 taxes: 56.3%
Here:
56%
State:
58%
(% for various income ranges: 42.9% for AGIs below $10k, 56.4% for AGIs $10k-25k, 57.7% for AGIs $25k-50k, 62.2% for AGIs $50k-75k, 58.0% for AGIs $75k-100k, 60.1% for AGIs over 100k)
Likely homosexual households (counted as self-reported same-sex unmarried-partner households)
Lesbian couples: 0.0% of all households
Gay men: 0.4% of all households
Household received Food Stamps/SNAP in the past 12 months: 711 Household did not receive Food Stamps/SNAP in the past 12 months: 5,636
Women who had a birth in the past 12 months: 279 (160 now married, 109 unmarried) Women who did not have a birth in the past 12 months: 3,546 (1,402 now married, 2,137 unmarried)
Housing units in zip code 02019 with a mortgage: 3,549 (308 second mortgage, 276 both second mortgage and home equity loan) Houses without a mortgage: 74
Median monthly owner costs for units with a mortgage: $2,254 Median monthly owner costs for units without a mortgage: $879
Residents with income below the poverty level in 2022:
This zip code:
5.4%
Whole state:
10.4%
Residents with income below 50% of the poverty level in 2022:
This zip code:
1.9%
Whole state:
5.1%
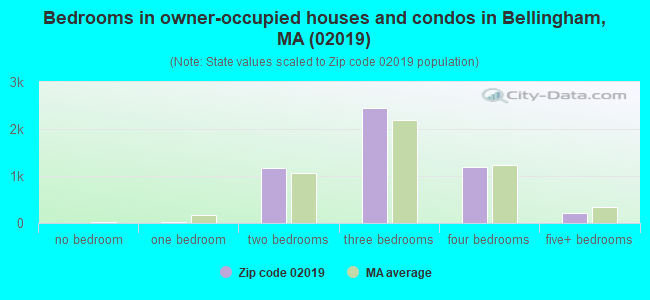
Median number of rooms in houses and condos:
Here:
6.5
State:
6.5
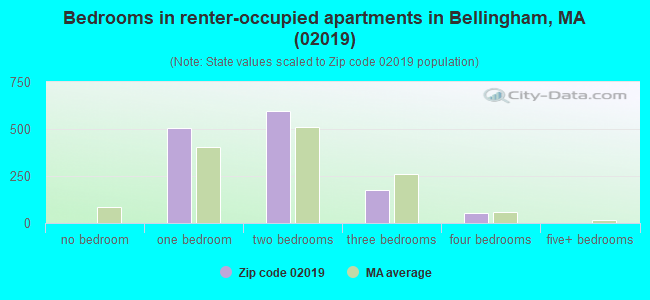
Median number of rooms in apartments:
Here:
3.5
State:
4.0
Notable locations in this zip code not listed on our city pages
Notable locations in zip code 02019: Winnesuket Golf Club (A), Bellingham Fire Department (B), Bellingham Town Offices (C), Keough Administration Building (D). Display/hide their locations on the map
Churches in zip code 02019 include: Saint Brendans Parish Center (A), First Baptist Church (B), Bellingham Bible Baptist Church (C), Saint Blaise Church (D). Display/hide their locations on the map
Cemeteries: Center Cemetery (1), Rakeville Cemetery (2), Saint Johns Cemetery (3), North Bellingham Cemetery (4), Scott Cemetery (5), Bellingham Center Cemetery (6). Display/hide their locations on the map
Lakes and reservoirs: Beaver Pond (A), Crystal Lake (B), Curtis Pond (C), Lakeview Pond (D), Lily Hole (E), Long Pond (F), Silver Lake (G), Maple Street Pond (H). Display/hide their locations on the map
In group quarters: 24 (-1 institutionalized population)
Size of family households: 1,521 2-persons, 1,408 3-persons, 838 4-persons, 353 5-persons, 299 6-persons, 42 7-or-more-persons
Size of nonfamily households: 1,455 1-person, 412 2-persons, 34 3-persons
2,161 married couples with children.
1,243 single-parent households (656 men, 587 women).
88.1% of residents of 02019 zip code speak English at home.
4.8% of residents speak Spanish at home (54% very well, 7% well, 6% not well, 33% not at all).
3.6% of residents speak other Indo-European language at home (63% very well, 30% well, 7% not well).
1.2% of residents speak Asian or Pacific Island language at home (89% very well, 11% well).
1.7% of residents speak other language at home (81% very well, 10% well, 10% not well).
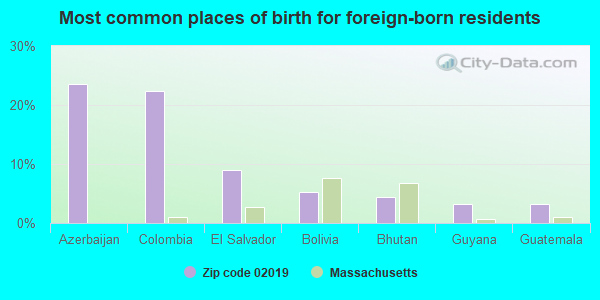
Foreign born population: 1,383 (8.1%) (59.0% of them are naturalized citizens)
This zip code:
8.1%
Whole state:
18.0%
24%Azerbaijan
22%Colombia
9%El Salvador
5%Bolivia
4%Bhutan
3%Guyana
3%Guatemala
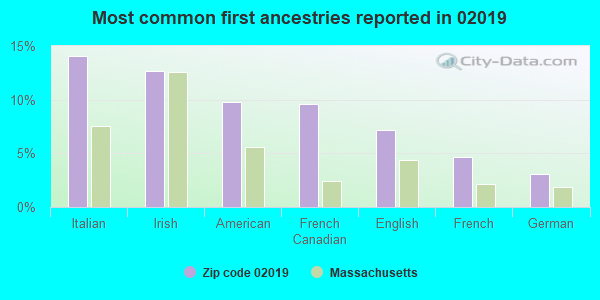
14%Italian
13%Irish
10%American
10%French Canadian
7%English
5%French
3%German
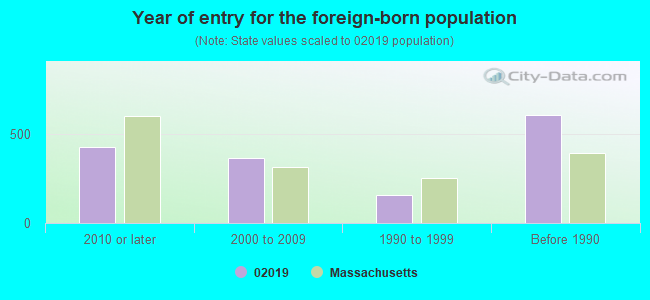
Year of entry for the foreign-born population
4292010 or later
3672000 to 2009
1601990 to 1999
608Before 1990
Major facilities with environmental interests located in this zip code:
BELLINGHAM COGENERATION FACILITY (92 DEPOT STREET in BELLINGHAM, MA)
AIR MAJOR (AIRS/AFS) AIR MINOR (AIRS/AFS) AIR MAJOR (AIRS/AFS) - ICIS-, ENFORCEMENT/COMPLIANCE ACTIVITY AIR PROGRAM (Clean Air Markets Division Business System) OIL CONTROL (Facility Response Plan for oil discharge) ENFORCEMENT/COMPLIANCE ACTIVITY (Integrated Compliance Information System) CRITERIA AND HAZARDOUS AIR POLLUTANT INVENTORY (Inventory of air pollution sources) Small Quantity Generators, between 100 kg and 1000 kg of hazardous waste/month (Resource Conservation and Recovery Act (tracking hazardous waste)) TRI REPORTER (Tracking of toxic chemicals releasing facilities) Business SIC classification: INDUSTRIAL GASES; ELECTRIC SERVICES Business NAICS classification: FOSSIL FUEL ELECTRIC POWER GENERATION. Organizations: FPL ENERGY OSLI (CONTACT/GENERAL)
, FPL ENERGY OPERATING SERVICES, INC. (CONTACT/OPERATOR)
, NORTHEAST ENERGY ASSOCIATES, LP (CONTACT/OPERATOR)
, BELLINGHAM CO GEN (CONTACT/OPERATOR)
, FPL ENERGY OPERATING SERVICES, INC. (CONTACT/OWNER)
, NORTHEAST ENERGY ASSOCIATES, LP (CONTACT/OWNER)
, NORTHEAST ENERGY ASSOCIATES (CONTACT/OWNER)
Alternative names: BELLINGHAM CO2 RECOVERY FACILITY, FPL ENERGY OSI BELLINGHAM, FPL ENERGY OSI BELLINGHAM CARBON DIOXIDE FACILITY, FPL ENERGY OSLI - NEA BELLINGHAM , IDC BELLINGHAM, INFRACTUCTURE DEVELOPMENT, NE ENERGY ASSOC, NORTEAST ENERGY ASSOCIATES BELLINGHAM CO2 PLANT, Northeast Energy Associates Limited Partnership , NORTHEAST ENERGY ASSOCIATES A L P, NORTHEAST ENERGY ASSOCIATES BELLINGHAM CO2 PLANT, NORTHEAST ENERGY ASSOCIATES LP CO2 RECOVERY FACILITY, TRACTEBEL POWER INCORPORATED CO2 RECOVERY FACILITY
LANTOR INC (125 DEPOT ST in BELLINGHAM, MA)
AIR MINOR (AIRS/AFS) STATE MASTER (MA-EPICS) - NEI-1201515, AIR PROGRAM, RCRAINFO-MAD076619956, HAZARDOUS WASTE PROGRAM CRITERIA AND HAZARDOUS AIR POLLUTANT INVENTORY (Inventory of air pollution sources) Small Quantity Generators, between 100 kg and 1000 kg of hazardous waste/month (Resource Conservation and Recovery Act (tracking hazardous waste)) - notification Business SIC classification: NONWOVEN FABRICS Organizations: JB GROUP (CONTACT/OWNER)
, AHLSTROM LANTOR LLC (CONTACT/OWNER)
Alternative names: AHLSTROM LANTOR LLC
ANP BELLINGHAM ENERGY PROJECT (155 MAPLE ST in BELLINGHAM, MA)
AIR MAJOR (AIRS/AFS) - ICIS-, ENFORCEMENT/COMPLIANCE ACTIVITY AIR PROGRAM (Clean Air Markets Division Business System) CRITERIA AND HAZARDOUS AIR POLLUTANT INVENTORY (Inventory of air pollution sources) Business SIC classification: ELECTRIC SERVICES; ELECTRIC AND OTHER SERVICES COMBINED Organizations: ANP OPERATIONS COMPANY (CONTACT/OPERATOR)
, ANP BELLINGHAM ENERGY COMPANY (CONTACT/OPERATOR)
Alternative names: AMEIRCAN NATIONAL, AMERICAN NATIONAL, AMERICAN NATIONAL POWER BELLINGHAM
BELLINGHAM ECC (338 HARTFORD AVENUE in BELLINGHAM, MA)
(National Center for Education Statistics) - STATE ID-025003
BELLINGHAM HIGH SCHOOL (80 BLACKSTONE STREET in BELLINGHAM, MA)
(National Center for Education Statistics) - STATE ID-025505
BELLINGHAM MEMORIAL MIDDLE SCHOOL (130 BLACKSTONE STREET in BELLINGHAM, MA)
(National Center for Education Statistics) - STATE ID-025315
CLARA MACY ELEMENTARY (60 MONIQUE DR in BELLINGHAM, MA)
(National Center for Education Statistics) - STATE ID-025009 Organizations: BELLINGHAM (SCHOOL DISTRICT)
DON VERMETTES BODY & PAINT (11 AUTUMN STREET in BELLINGHAM, MA)
Conditionally Exempt Small Quantity Generators, less than 100 kg/month of hazardous waste (Resource Conservation and Recovery Act (tracking hazardous waste)) - notification (Resource Conservation and Recovery Act (tracking hazardous waste)) Organizations: GHAZARIAN H JACK (CONTACT/OWNER)
Alternative names: LIBERTY AUTO BODY, VERMETTES DON BODY & PAINT
BELLINGHAM MOBIL (270 NORTH MAIN ST in BELLINGHAM, MA)
(Resource Conservation and Recovery Act (tracking hazardous waste)) Organizations: MARTIN R MACKENZIE (CONTACT/OWNER)
BENZENOID ORGANICS INC (BOX POND RD in BELLINGHAM, MA)
COLIN LAND DEVELOPMENT CO INC (140 SUFFOLK ST in BELLINGHAM, MA)
(Resource Conservation and Recovery Act (tracking hazardous waste))
BELLINGHAM POLICE DEPARTMENT (TOWN HALL in BELLINGHAM, MA)
AIR MINOR (AIRS/AFS) CRITERIA AND HAZARDOUS AIR POLLUTANT INVENTORY (Inventory of air pollution sources) Business SIC classification: POLICE PROTECTION Alternative names: POLICE DEPT.
BEVILACQUA PAVING COMPANY (MAPLE ST in BELLINGHAM, MA)
AIR MINOR (AIRS/AFS) CRITERIA AND HAZARDOUS AIR POLLUTANT INVENTORY (Inventory of air pollution sources)
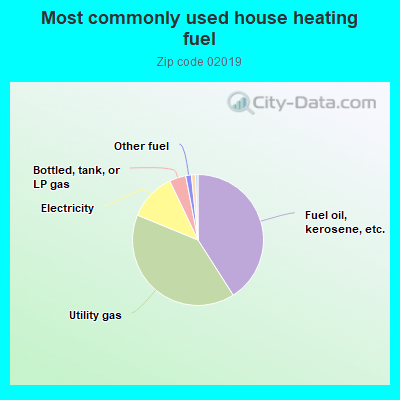
41.0%Fuel oil, kerosene, etc.
40.3%Utility gas
11.7%Electricity
4.1%Bottled, tank, or LP gas
1.4%Other fuel
1.0%Wood
Population in 1990: 14,873. Population change in the 1990s: +441 (+3.0%).
Place of birth for U.S.-born residents:
This state: 11,523
Northeast: 2,788
Midwest: 442
South: 351
West: 234
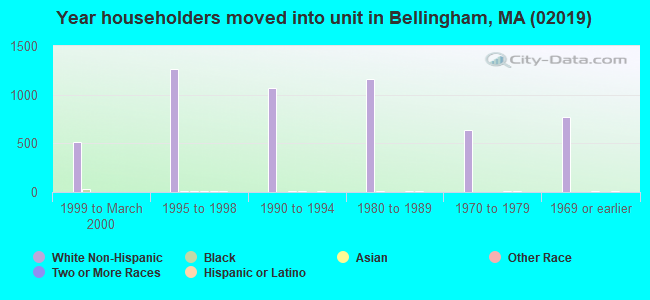
68% of the 02019 zip code residents lived in the same house 5 years ago. Out of people who lived in different houses, 45% lived in this county. Out of people who lived in different counties, 50% lived in Massachusetts.
94% of the 02019 zip code residents lived in the same house 1 year ago. Out of people who lived in different houses, 36% moved from this county. Out of people who lived in different houses, 50% moved from different county within same state. Out of people who lived in different houses, 7% moved from different state. Out of people who lived in different houses, 11% moved from abroad.
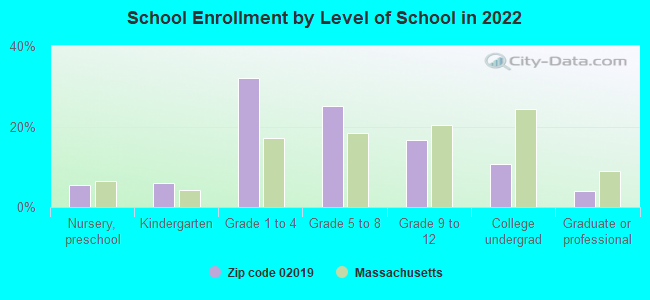
Private vs. public school enrollment:
Students in private schools in grades 1 to 8 (elementary and middle school): 197
Here:
9.3%
Massachusetts:
10.3%
Students in private schools in grades 9 to 12 (high school): 34
Here:
5.6%
Massachusetts:
12.3%
Students in private undergraduate colleges: 59
Here:
15.6%
Massachusetts:
51.2%
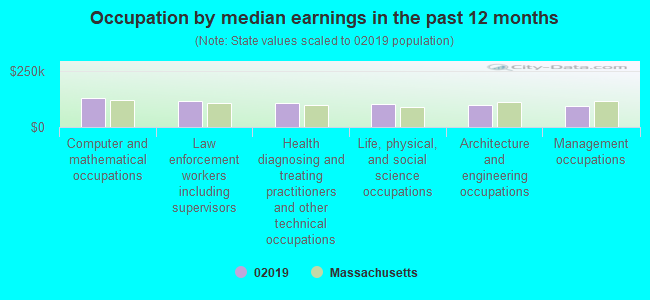
Occupation by median earnings in the past 12 months ($)
130,374Computer and mathematical occupations
113,896Law enforcement workers including supervisors
107,093Health diagnosing and treating practitioners and other technical occupations
103,483Life, physical, and social science occupations
98,180Architecture and engineering occupations
93,402Management occupations
Companies with federal contracts located in this zip code (BELLINGHAM, MA):
MIL-STOCK ELECTRONICS INC (15 N MAIN ST STE A4; small business) : $195,446 in 10 contractsfrom 2004 to 2006
Contracts for Miscellaneous Electrical and Electronic Components, Connectors, Electrical, Electrical Hardware and Supplies, Plate, Sheet, Strip, and Foil; Nonferrous Base Metal by Army, Navy Signed by year:2000: $0; 2001: $0; 2002: $0; 2003: $0; 2004: $101,288; 2005: $84,147; 2006: $10,011.
Biggest contracts:
$66,674 with Army for Miscellaneous Electrical and Electronic Components. Signed on 2004-12-17. Completion date: 2005-01-28.
$28,332 with Navy for Miscellaneous Electrical and Electronic Components. Signed on 2004-04-12. Completion date: 2004-06-18.
$19,116 with Army for Connectors, Electrical. Taking place in VA. Signed on 2005-12-22. Completion date: 2006-01-20.
$18,470 with Army for Connectors, Electrical. Signed on 2005-12-15. Completion date: 2006-01-20.
KAPLAN ENTERPRISES LLC (146 TEMI RD; small business)
$53,820 with Air Force for Electrical and Electronic Properties Measuring and Testing Instruments. Signed on 2003-10-23. Completion date: 2003-12-12.
MR FENCE INC (64 MECHANIC ST; small business)
$29,161 with Army for Maintenance, Repair or Alteration of Real Property -- Family Housing Facilities. Signed on 2003-09-11. Completion date: 2003-10-20.
BRODERICK, VICTORIA E (50 BERTINE ST; small business)
$10,721 with Army for Technical Assistance. Signed on 2006-05-22. Completion date: 2007-05-31.
Top industries in this zip code by the number of employees in 2005:
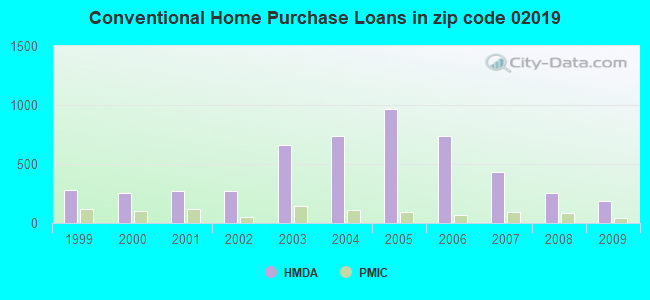
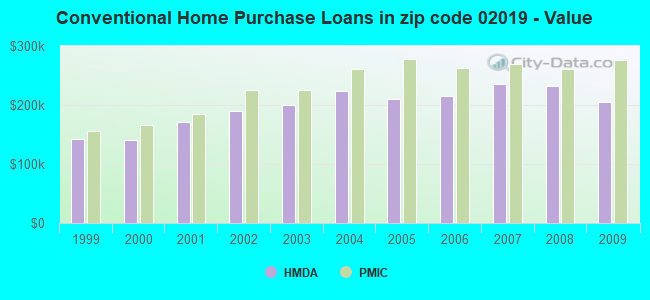
Detailed PMIC statistics for the following Tracts:4431.01
, 4431.02
2002 - 2018 National Fire Incident Reporting System (NFIRS) incidents
According to the data from the years 2002 - 2018 the average number of fires per year is 68. The highest number of reported fires - 96 took place in 2007, and the least - 46 in 2018. The data has a decreasing trend.
When looking into fire subcategories, the most incidents belonged to: Structure Fires (49.1%), and Outside Fires (33.0%).
Fire incident types reported to NFIRS in Zip Code 02019


 Nearest zip codes: 02038, 01504, 01756, 01747, 02895, 02053.


 According to the data from the years 2002 - 2018 the average number of fires per year is 68. The highest number of reported fires - 96 took place in 2007, and the least - 46 in 2018. The data has a decreasing trend.
 When looking into fire subcategories, the most incidents belonged to: Structure Fires (49.1%), and Outside Fires (33.0%).