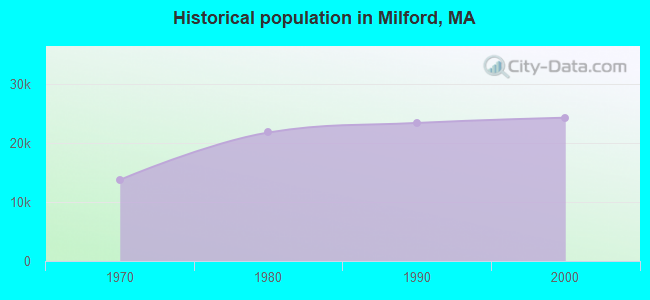
Milford, Massachusetts
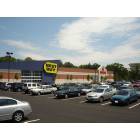
Milford: Best Buy
Milford: milford

Milford: milford
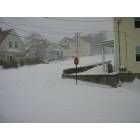
Milford: storm of feb 12th, 2006

Milford: milford
- add
your
Submit your own pictures of this place and show them to the world
- OSM Map
- General Map
- Google Map
- MSN Map
Population change since 2000: +3.4%
| Males: 13,089 | |
| Females: 11,966 |
| Median resident age: | 39.7 years |
| Massachusetts median age: | 40.3 years |
Zip codes: 01757.
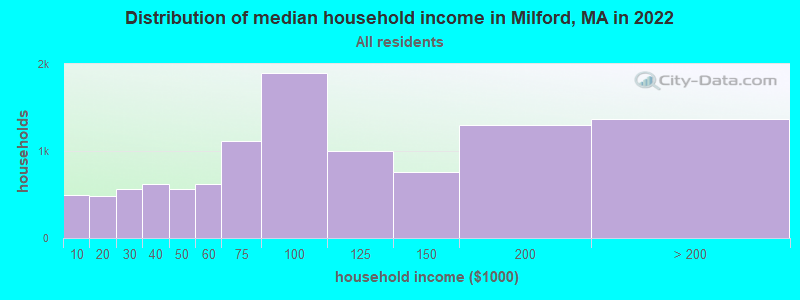
| Milford: | $87,314 |
| MA: | $94,488 |
Estimated per capita income in 2022: $42,177 (it was $22,813 in 2000)
Milford CDP income, earnings, and wages data
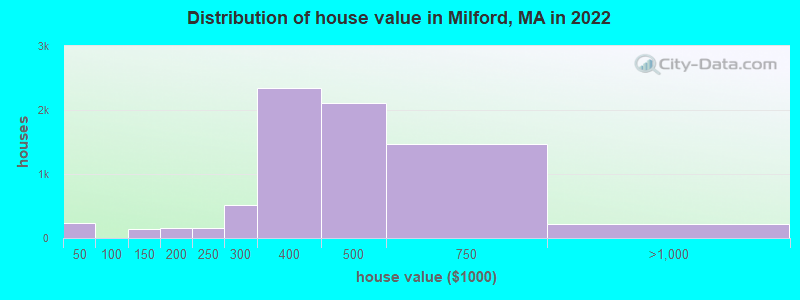
Estimated median house or condo value in 2022: $421,882 (it was $165,600 in 2000)
| Milford: | $421,882 |
| MA: | $534,700 |
Mean prices in 2022: all housing units: $444,286; detached houses: $473,041; townhouses or other attached units: $416,166; in 2-unit structures: $360,580; in 3-to-4-unit structures: $291,666; in 5-or-more-unit structures: $249,034
Median gross rent in 2022: $1,663.
(9.6% for White Non-Hispanic residents, 3.9% for Black residents, 7.8% for Hispanic or Latino residents, 26.6% for other race residents, 4.8% for two or more races residents)
Detailed information about poverty and poor residents in Milford, MA

Compare current foreclosures near Milford, MA:
| Photo | Address | Area | Beds / Baths | Price | Details |
|---|---|---|---|---|---|

|
#1
Sidney Rd
Milford, MA 01757
|
1,184 sq. feet
|
1 baths 4 beds |
show details | |

|
#2
Sunset Dr
Milford, MA 01757
|
1,104 sq. feet
|
1 baths 3 beds |
show details | |

|
#3
W Spruce St
Milford, MA 01757
|
1,948 sq. feet
|
1 baths 3 beds |
show details | |

|
#4
Haven St
Milford, MA 01757
|
2,448 sq. feet
|
2 baths 4 beds |
show details | |

|
#5
Trinity Dr
Milford, MA 01757
|
1,632 sq. feet
|
1 baths 4 beds |
show details | |

|
#6
Briar Dr
Milford, MA 01757
|
1,900 sq. feet
|
2 baths 4 beds |
show details | |

|
#7
Lena Ln # 1
Milford, MA 01757
|
990 sq. feet
|
1 baths 2 beds |
show details | |

|
#8
Lena Ln # 25
Milford, MA 01757
|
990 sq. feet
|
1 baths 2 beds |
show details | |

|
#9
Purchase St
Milford, MA 01757
|
1,934 sq. feet
|
1 baths 3 beds |
show details | |

|
#10
Claudette Dr Apt 8
Milford, MA 01757
|
- sq. feet
|
- baths - beds |
show details |
| Photo | Address | Area | Beds / Baths | Price | Details |
|---|---|---|---|---|---|

|
#11
Central St # 3
Milford, MA 01757
|
- sq. feet
|
- baths - beds |
show details | |

|
#12
Stain John Lane
Milford, MA 01757
|
- sq. feet
|
- baths - beds |
show details | |

|
#13
Sidney Rd Apt H
Milford, MA 01757
|
- sq. feet
|
- baths - beds |
show details | |

|
#14
Highland St # 2
Milford, MA 01757
|
- sq. feet
|
- baths - beds |
show details | |

|
#15
Jefferson St # 5
Milford, MA 01757
|
- sq. feet
|
- baths - beds |
show details | |

|
#16
Stillman St
Framingham, MA 01702
|
1,122 sq. feet
|
1 baths 2 beds |
$440,000
|
show details |

|
#17
Mount Pleasant Rd
Harrisville, RI 02830
|
1,232 sq. feet
|
1 baths 3 beds |
$449,900
|
show details |

|
#18
Cook Rd
Cumberland, RI 02864
|
2,050 sq. feet
|
2 baths 4 beds |
$749,500
|
show details |

|
#19
Congress St
Milford, MA 01757
|
- sq. feet
|
- baths - beds |
show details | |

|
#20
N Main St
Pascoag, RI 02859
|
- sq. feet
|
- baths - beds |
$100,000
|
show details |
| Photo | Address | Area | Beds / Baths | Price | Details |
|---|---|---|---|---|---|

|
#21
Victoria Cir
Norwood, MA 02062
|
2,980 sq. feet
|
3 baths 5 beds |
show details | |

|
#22
Glendale Ave
Uxbridge, MA 01569
|
1,302 sq. feet
|
2 baths 4 beds |
show details | |

|
#23
Everett Cir
Hopkinton, MA 01748
|
5,180 sq. feet
|
3 baths 4 beds |
show details | |

|
#24
1/2 Putnam Hill Road
Sutton, MA 01590
|
1,415 sq. feet
|
1 baths 3 beds |
show details | |

|
#25
Grove St
Woonsocket, RI 02895
|
2,534 sq. feet
|
3 baths 6 beds |
show details | |

|
#26
Mill St
Foxboro, MA 02035
|
1,584 sq. feet
|
2 baths 3 beds |
show details | |

|
#27
Briarwood Rd
Framingham, MA 01701
|
1,248 sq. feet
|
2 baths 3 beds |
show details | |

|
#28
Mallard Dr
Medway, MA 02053
|
2,024 sq. feet
|
2 baths 5 beds |
show details | |

|
#29
Cedar St
Ashland, MA 01721
|
2,756 sq. feet
|
3 baths 4 beds |
show details | |

|
#30
Laurelwood Dr # No
Hopedale, MA 01747
|
1,440 sq. feet
|
1 baths 2 beds |
show details |
| Photo | Address | Area | Beds / Baths | Price | Details |
|---|---|---|---|---|---|

|
#31
Old Mill Rd
Shrewsbury, MA 01545
|
2,110 sq. feet
|
2 baths 3 beds |
show details | |

|
#32
Depot St
North Attleboro, MA 02760
|
- sq. feet
|
2 baths 3 beds |
show details | |

|
#33
Mount Hope St
North Attleboro, MA 02760
|
3,554 sq. feet
|
2 baths 4 beds |
show details | |

|
#34
Burlingame Rd
Smithfield, RI 02917
|
1,454 sq. feet
|
2 baths 3 beds |
show details | |

|
#35
Old Farm Rd
Mansfield, MA 02048
|
1,044 sq. feet
|
1 baths 3 beds |
show details | |

|
#36
Kinsman Pl
Natick, MA 01760
|
3,616 sq. feet
|
2 baths 3 beds |
show details | |

|
#37
Ideal Rd
Worcester, MA 01604
|
1,334 sq. feet
|
1 baths 3 beds |
show details | |

|
#38
Preston Ave
Auburn, MA 01501
|
1,054 sq. feet
|
1 baths 3 beds |
show details | |

|
#39
Log Rd
Smithfield, RI 02917
|
1,276 sq. feet
|
1 baths 3 beds |
show details | |

|
#40
Pierce St
Foxboro, MA 02035
|
1,352 sq. feet
|
1 baths 3 beds |
show details |
| Photo | Address | Area | Beds / Baths | Price | Details |
|---|---|---|---|---|---|

|
#41
N Main St
Natick, MA 01760
|
1,656 sq. feet
|
2 baths 4 beds |
show details | |

|
#42
Cunningham Dr
Framingham, MA 01701
|
1,128 sq. feet
|
1 baths 3 beds |
show details | |

|
#43
Cherry St
Framingham, MA 01701
|
1,254 sq. feet
|
1 baths 3 beds |
show details | |

|
#44
Grafton St
Shrewsbury, MA 01545
|
3,951 sq. feet
|
2 baths 4 beds |
show details | |

|
#45
W Main St
Millbury, MA 01527
|
750 sq. feet
|
1 baths 4 beds |
show details | |

|
#46
Wheelock Ave
Millbury, MA 01527
|
1,115 sq. feet
|
1 baths 3 beds |
show details | |

|
#47
Gina Cir
Framingham, MA 01701
|
1,225 sq. feet
|
1 baths 3 beds |
show details | |

|
#48
Winchester Ave
Auburn, MA 01501
|
1,926 sq. feet
|
2 baths 3 beds |
show details | |

|
#49
Martin St
Millbury, MA 01527
|
1,806 sq. feet
|
1 baths 3 beds |
show details | |

|
Check over 1 million property listings on Foreclosure.com!
|
browse all offers | |||


- 18,64467.3%White alone
- 3,59313.0%Hispanic
- 2,79310.1%Two or more races
- 1,4245.1%Other race alone
- 1,0073.6%Black alone
- 7302.6%Asian alone
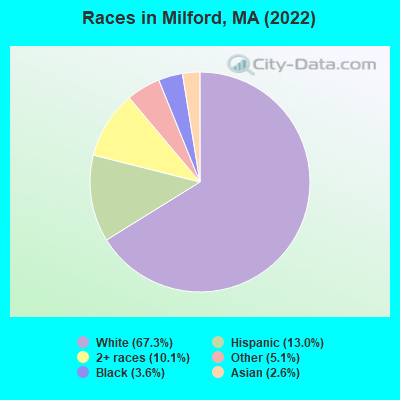
Races in Milford detailed stats: ancestries, foreign born residents, place of birth
According to our research of Massachusetts and other state lists, there were 15 registered sex offenders living in Milford, Massachusetts as of April 27, 2024.
The ratio of all residents to sex offenders in Milford is 1,726 to 1.
The ratio of registered sex offenders to all residents in this city is near the state average.
Type |
2009 |
2010 |
2011 |
2012 |
2013 |
2014 |
2015 |
2016 |
2017 |
2018 |
2019 |
2020 |
2021 |
2022 |
|---|---|---|---|---|---|---|---|---|---|---|---|---|---|---|
| Murders (per 100,000) | 0 (0.0) | 0 (0.0) | 0 (0.0) | 1 (3.5) | 0 (0.0) | 0 (0.0) | 0 (0.0) | 0 (0.0) | 2 (7.0) | 0 (0.0) | 0 (0.0) | 0 (0.0) | 0 (0.0) | 0 (0.0) |
| Rapes (per 100,000) | 5 (18.2) | 5 (17.9) | 5 (17.7) | 8 (28.2) | 13 (45.9) | 9 (31.7) | 10 (35.0) | 11 (38.5) | 13 (45.2) | 18 (61.9) | 11 (37.9) | 7 (24.1) | 14 (47.8) | 12 (39.5) |
| Robberies (per 100,000) | 6 (21.8) | 17 (60.7) | 7 (24.8) | 14 (49.4) | 7 (24.7) | 7 (24.6) | 4 (14.0) | 11 (38.5) | 2 (7.0) | 2 (6.9) | 4 (13.8) | 0 (0.0) | 3 (10.2) | 4 (13.2) |
| Assaults (per 100,000) | 49 (178.0) | 79 (282.2) | 63 (223.6) | 56 (197.6) | 38 (134.2) | 39 (137.2) | 49 (171.6) | 47 (164.3) | 41 (142.5) | 41 (141.1) | 33 (113.7) | 34 (117.0) | 32 (109.2) | 29 (95.5) |
| Burglaries (per 100,000) | 43 (156.2) | 99 (353.6) | 104 (369.2) | 93 (328.1) | 56 (197.8) | 79 (277.8) | 50 (175.1) | 57 (199.3) | 38 (132.1) | 19 (65.4) | 38 (131.0) | 27 (92.9) | 33 (112.6) | 26 (85.6) |
| Thefts (per 100,000) | 256 (930.0) | 359 (1,282) | 363 (1,289) | 412 (1,453) | 450 (1,589) | 369 (1,298) | 354 (1,240) | 270 (943.9) | 251 (872.4) | 193 (664.2) | 123 (423.9) | 120 (412.9) | 127 (433.5) | 160 (527.0) |
| Auto thefts (per 100,000) | 17 (61.8) | 30 (107.1) | 25 (88.7) | 20 (70.6) | 17 (60.0) | 13 (45.7) | 13 (45.5) | 22 (76.9) | 19 (66.0) | 22 (75.7) | 14 (48.3) | 25 (86.0) | 22 (75.1) | 17 (56.0) |
| Arson (per 100,000) | 5 (18.2) | 2 (7.1) | 1 (3.5) | 0 (0.0) | 1 (3.5) | 2 (7.0) | 1 (3.5) | 0 (0.0) | 1 (3.5) | 1 (3.4) | 2 (6.9) | 2 (6.9) | 2 (6.8) | 1 (3.3) |
| City-Data.com crime index | 109.8 | 173.5 | 150.9 | 170.7 | 153.2 | 135.2 | 132.0 | 133.0 | 130.1 | 117.0 | 87.2 | 72.6 | 94.4 | 86.2 |
The City-Data.com crime index weighs serious crimes and violent crimes more heavily. Higher means more crime, U.S. average is 246.1. It adjusts for the number of visitors and daily workers commuting into cities.
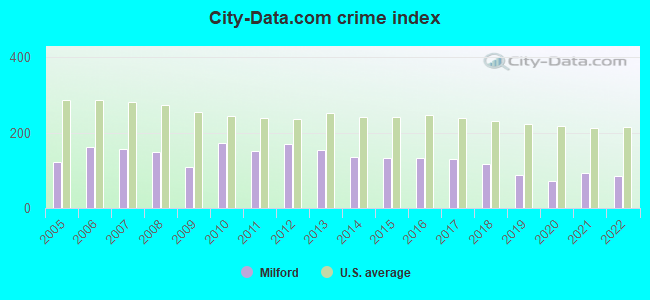
Crime rate in Milford detailed stats: murders, rapes, robberies, assaults, burglaries, thefts, arson
Full-time law enforcement employees in 2018, including police officers: 59 (49 officers - 46 male; 3 female).
| Officers per 1,000 residents here: | 1.69 |
| Massachusetts average: | 2.60 |
 Recent articles from our blog. Our writers, many of them Ph.D. graduates or candidates, create easy-to-read articles on a wide variety of topics.

 | Milford MA (15 replies) |
| Sunset Drive, Milford house - thoughts? (26 replies) |
| 12 Joseph Road Milford - thoughts/opinions? (24 replies) |
| Man found stabbed to death in Milford storage unit (1 reply) |
| Opinions on this house - Milford (21 replies) |
| Big MA Ancestry Data Thread by Town (31 replies) |
Latest news from Milford, MA collected exclusively by city-data.com from local newspapers, TV, and radio stations
Ancestries: Brazilian (23.8%), Irish (10.3%), Italian (10.0%), Portuguese (7.4%), French Canadian (4.2%), American (3.6%).
Current Local Time: EST time zone
Incorporated in 1780
Elevation: 307 feet
Land area: 9.98 square miles.
Population density: 2,512 people per square mile (average).
7,739 residents are foreign born (19.1% Latin America, 4.0% Europe).
| This place: | 27.9% |
| Massachusetts: | 17.6% |
Median real estate property taxes paid for housing units with mortgages in 2022: $4,899 (1.2%)
Median real estate property taxes paid for housing units with no mortgage in 2022: $5,497 (1.3%)
Nearest city with pop. 50,000+: Framingham, MA  (11.7 miles , pop. 66,910).
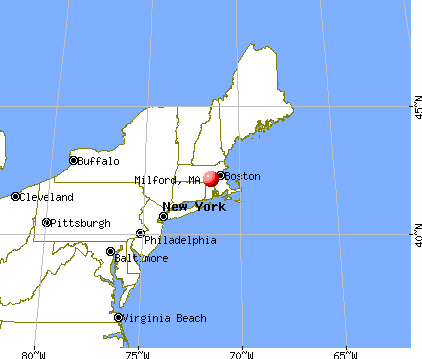
Nearest city with pop. 200,000+: Boston, MA (25.1 miles , pop. 589,141).
Nearest city with pop. 1,000,000+: Bronx, NY (151.5 miles , pop. 1,332,650).
Nearest cities:
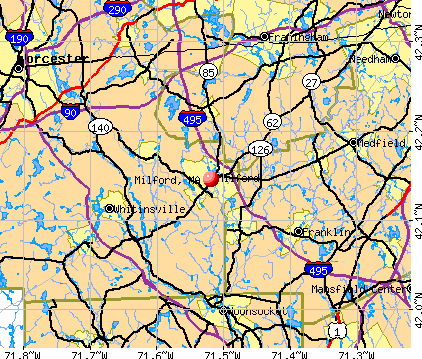
), Latitude: 42.15 N, Longitude: 71.52 W
Daytime population change due to commuting: +3,777 (+13.6%)
Workers who live and work in this place: 5,071 (34.2%)
Area codes: 508, 774
Milford, Massachusetts accommodation & food services, waste management - Economy and Business Data
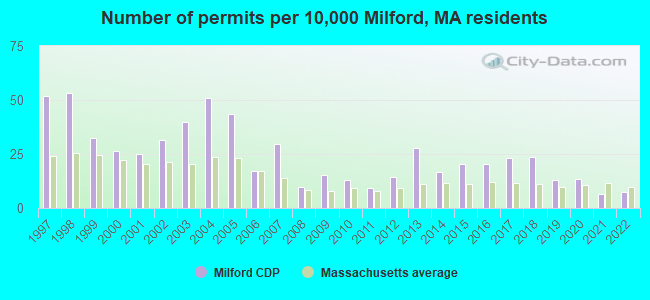
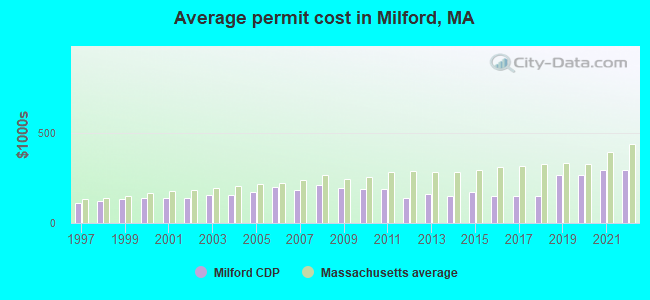
Single-family new house construction building permits:
- 2022: 18 buildings, average cost: $291,100
- 2021: 16 buildings, average cost: $291,100
- 2020: 32 buildings, average cost: $266,900
- 2019: 31 buildings, average cost: $266,900
- 2018: 57 buildings, average cost: $147,200
- 2017: 56 buildings, average cost: $147,200
- 2016: 49 buildings, average cost: $147,700
- 2015: 49 buildings, average cost: $171,100
- 2014: 40 buildings, average cost: $148,100
- 2013: 67 buildings, average cost: $159,000
- 2012: 35 buildings, average cost: $141,100
- 2011: 22 buildings, average cost: $189,200
- 2010: 31 buildings, average cost: $186,600
- 2009: 37 buildings, average cost: $193,800
- 2008: 24 buildings, average cost: $211,300
- 2007: 72 buildings, average cost: $182,100
- 2006: 41 buildings, average cost: $197,300
- 2005: 105 buildings, average cost: $173,200
- 2004: 123 buildings, average cost: $156,400
- 2003: 96 buildings, average cost: $156,400
- 2002: 76 buildings, average cost: $138,300
- 2001: 61 buildings, average cost: $136,600
- 2000: 64 buildings, average cost: $139,200
- 1999: 79 buildings, average cost: $133,300
- 1998: 129 buildings, average cost: $121,000
- 1997: 126 buildings, average cost: $112,500
| Here: | 3.6% |
| Massachusetts: | 3.5% |
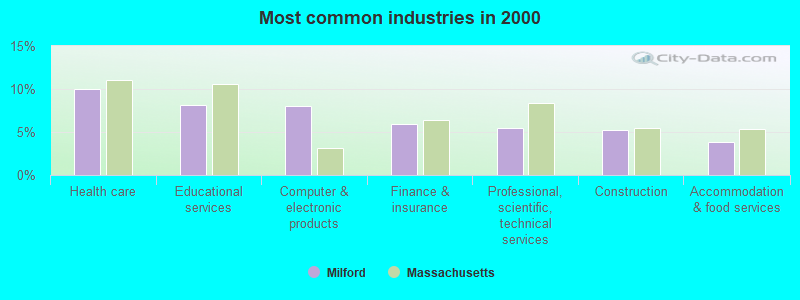
- Health care (10.0%)
- Educational services (8.2%)
- Computer & electronic products (8.0%)
- Finance & insurance (6.0%)
- Professional, scientific, technical services (5.4%)
- Construction (5.3%)
- Accommodation & food services (3.9%)
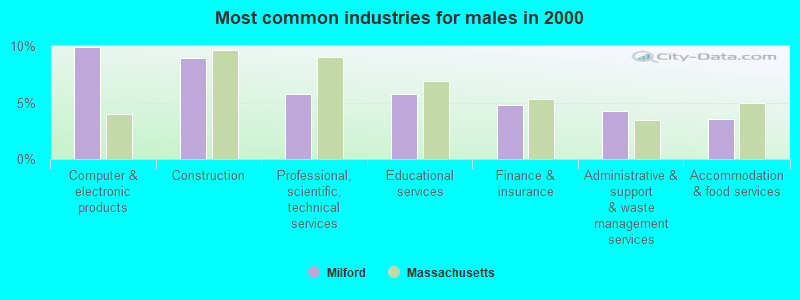
- Computer & electronic products (9.9%)
- Construction (9.0%)
- Professional, scientific, technical services (5.8%)
- Educational services (5.7%)
- Finance & insurance (4.8%)
- Administrative & support & waste management services (4.2%)
- Accommodation & food services (3.5%)

- Health care (17.2%)
- Educational services (10.8%)
- Finance & insurance (7.2%)
- Computer & electronic products (5.9%)
- Professional, scientific, technical services (5.1%)
- Accommodation & food services (4.3%)
- Social assistance (3.9%)
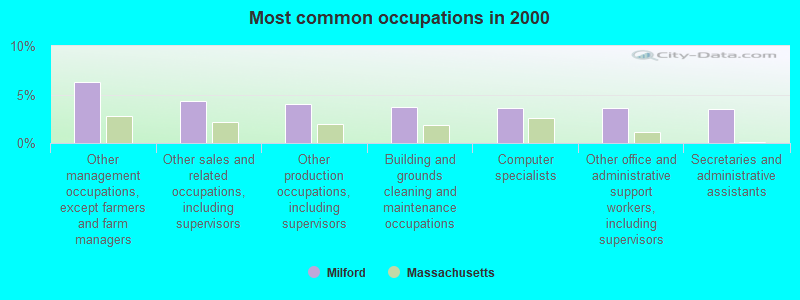
- Other management occupations, except farmers and farm managers (6.3%)
- Other sales and related occupations, including supervisors (4.3%)
- Other production occupations, including supervisors (4.0%)
- Building and grounds cleaning and maintenance occupations (3.7%)
- Computer specialists (3.6%)
- Other office and administrative support workers, including supervisors (3.6%)
- Secretaries and administrative assistants (3.5%)
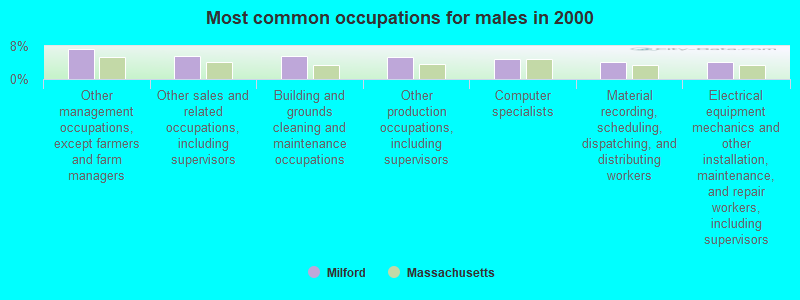
- Other management occupations, except farmers and farm managers (7.2%)
- Other sales and related occupations, including supervisors (5.6%)
- Building and grounds cleaning and maintenance occupations (5.5%)
- Other production occupations, including supervisors (5.4%)
- Computer specialists (4.7%)
- Material recording, scheduling, dispatching, and distributing workers (4.1%)
- Electrical equipment mechanics and other installation, maintenance, and repair workers, including supervisors (4.0%)

- Secretaries and administrative assistants (6.8%)
- Registered nurses (6.4%)
- Other management occupations, except farmers and farm managers (5.3%)
- Other office and administrative support workers, including supervisors (5.2%)
- Preschool, kindergarten, elementary, and middle school teachers (4.9%)
- Customer service representatives (4.0%)
- Information and record clerks, except customer service representatives (3.5%)
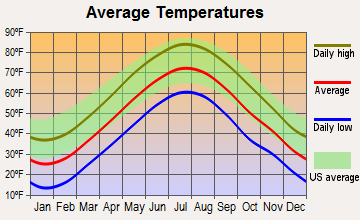
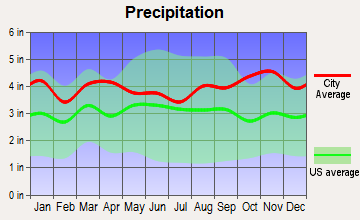
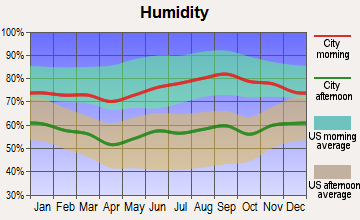
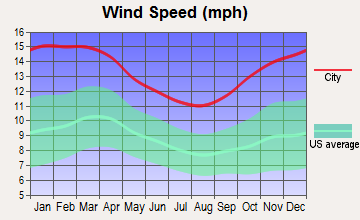
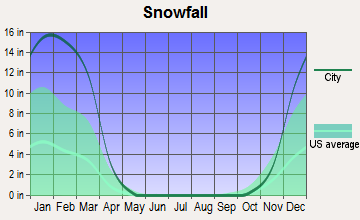
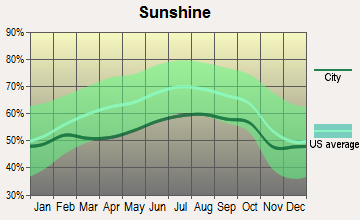
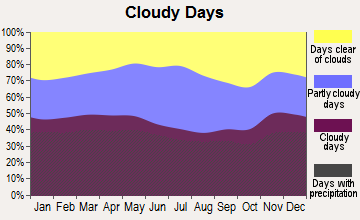
Average climate in Milford, Massachusetts
Based on data reported by over 4,000 weather stations
|
|


(lower is better)
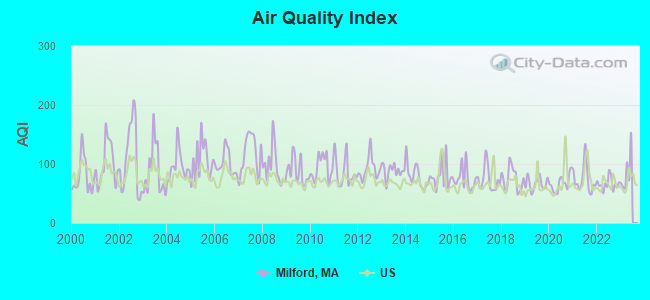
Air Quality Index (AQI) level in 2022 was 66.0. This is about average.
| City: | 66.0 |
| U.S.: | 72.6 |
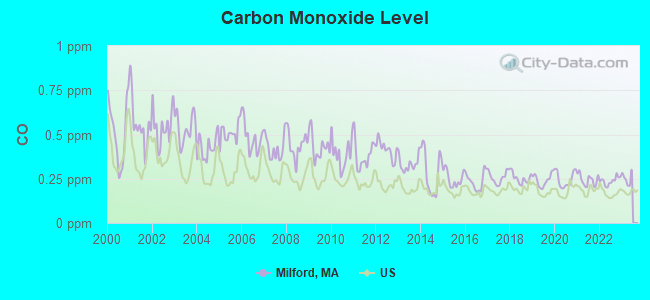
Carbon Monoxide (CO) [ppm] level in 2022 was 0.239. This is about average. Closest monitor was 16.3 miles away from the city center.
| City: | 0.239 |
| U.S.: | 0.251 |
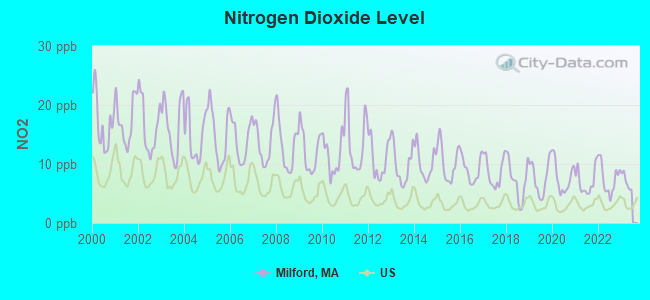
Nitrogen Dioxide (NO2) [ppb] level in 2022 was 7.46. This is significantly worse than average. Closest monitor was 9.9 miles away from the city center.
| City: | 7.46 |
| U.S.: | 5.11 |
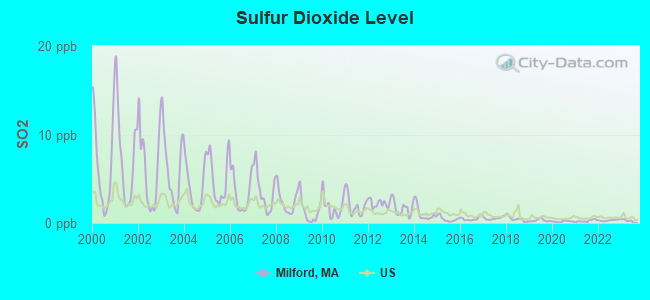
Sulfur Dioxide (SO2) [ppb] level in 2022 was 0.305. This is significantly better than average. Closest monitor was 7.8 miles away from the city center.
| City: | 0.305 |
| U.S.: | 1.515 |
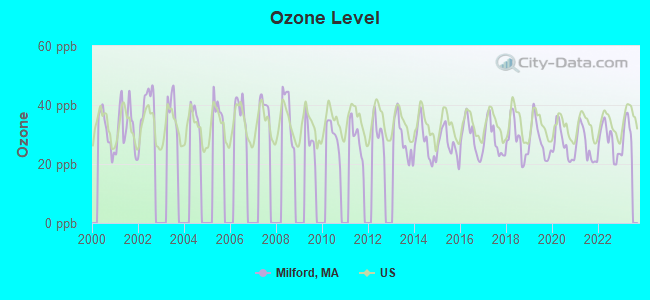
Ozone [ppb] level in 2022 was 27.8. This is about average. Closest monitor was 6.1 miles away from the city center.
| City: | 27.8 |
| U.S.: | 33.3 |
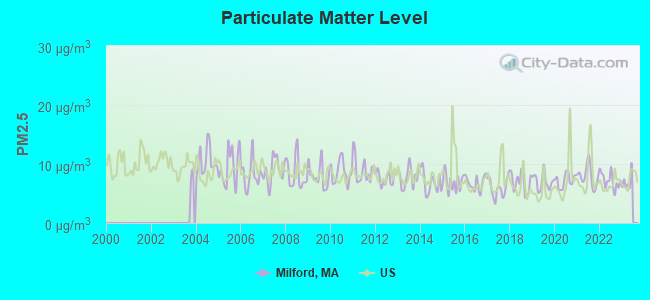
Particulate Matter (PM2.5) [µg/m3] level in 2022 was 7.18. This is about average. Closest monitor was 16.3 miles away from the city center.
| City: | 7.18 |
| U.S.: | 8.11 |
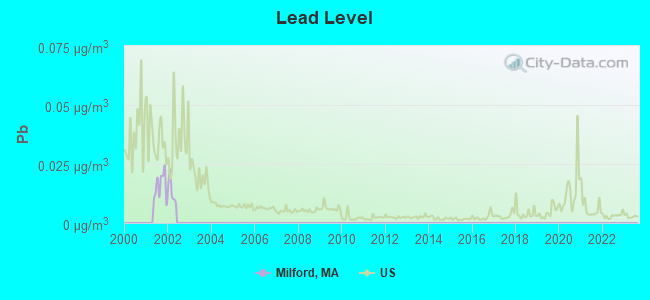
Lead (Pb) [µg/m3] level in 2001 was 0.0156. This is significantly worse than average. Closest monitor was 16.4 miles away from the city center.
| City: | 0.0156 |
| U.S.: | 0.0093 |
Tornado activity:
Milford-area historical tornado activity is slightly above Massachusetts state average. It is 33% smaller than the overall U.S. average.
On 6/9/1953, a category F4 (max. wind speeds 207-260 mph) tornado 10.7 miles away from the Milford place center killed 90 people and injured 1228 people and caused between $50,000,000 and $500,000,000 in damages.
On 6/9/1953, a category F3 (max. wind speeds 158-206 mph) tornado 13.0 miles away from the place center injured 17 people and caused between $500,000 and $5,000,000 in damages.
Earthquake activity:
Milford-area historical earthquake activity is significantly above Massachusetts state average. It is 73% smaller than the overall U.S. average.On 10/7/1983 at 10:18:46, a magnitude 5.3 (5.1 MB, 5.3 LG, 5.1 ML, Class: Moderate, Intensity: VI - VII) earthquake occurred 189.7 miles away from the city center
On 4/20/2002 at 10:50:47, a magnitude 5.3 (5.3 ML, Depth: 3.0 mi) earthquake occurred 197.0 miles away from Milford center
On 4/20/2002 at 10:50:47, a magnitude 5.2 (5.2 MB, 4.2 MS, 5.2 MW, 5.0 MW) earthquake occurred 196.1 miles away from Milford center
On 1/19/1982 at 00:14:42, a magnitude 4.7 (4.5 MB, 4.7 MD, 4.5 LG, Class: Light, Intensity: IV - V) earthquake occurred 93.8 miles away from the city center
On 10/16/2012 at 23:12:25, a magnitude 4.7 (4.7 ML, Depth: 10.0 mi) earthquake occurred 109.5 miles away from Milford center
On 8/22/1992 at 12:20:32, a magnitude 4.8 (4.8 MB, 3.8 MS, 4.7 LG, Depth: 6.2 mi) earthquake occurred 219.5 miles away from the city center
Magnitude types: regional Lg-wave magnitude (LG), body-wave magnitude (MB), duration magnitude (MD), local magnitude (ML), surface-wave magnitude (MS), moment magnitude (MW)
Natural disasters:
The number of natural disasters in Worcester County (27) is a lot greater than the US average (15).Major Disasters (Presidential) Declared: 15
Emergencies Declared: 12
Causes of natural disasters: Floods: 9, Storms: 8, Hurricanes: 6, Snowstorms: 5, Winter Storms: 4, Blizzards: 2, Snows: 2, Fire: 1, Heavy Rain: 1, Snowfall: 1, Tornado: 1, Wind: 1 (Note: some incidents may be assigned to more than one category).

Main business address for: WATERS CORP /DE/ (LABORATORY ANALYTICAL INSTRUMENTS).
Hospitals and medical centers in Milford:
- MILFORD REGIONAL MEDICAL CENTER (Voluntary non-profit - Other, 14 PROSPECT STREET)
- BLAIRE HOUSE OF MILFORD (20 CLAFLIN STREET)
- COUNTRYSIDE HEALTH CARE OF MILFORD (COUNTRYSIDE DRIVE)
- GERIATRIC AUTHORITY OF MILFORD N H (COUNTRYSIDE DR)
- MILFORD CARE AND REHABILITATION CENTER (10 VETERANS MEMORIAL DRIVE)
- FMC DIALYSIS SERVICES OF BLACKSTONE VALLEY (42 CAPE ROAD)
- VNA AND HOSPICE OF GREATER MILFORD (37 BIRCH STREET)
Heliports located in Milford:
Amtrak stations near Milford:
- 11 miles: FRAMINGHAM (443 WAVERLY ST.) . Services: public payphones, snack bar, paid short-term parking, taxi stand, public transit connection.
- 17 miles: WORCESTER (WORCHESTER, 45 SHREWSBURY ST.) . Services: ticket office, fully wheelchair accessible, enclosed waiting area, public restrooms, public payphones, vending machines, free short-term parking, free long-term parking, call for taxi service, public transit connection.
- 20 miles: ROUTE 128 (WESTWOOD, UNIVERSITY AVE. & RTE. 128) . Services: ticket office, enclosed waiting area, public restrooms, public payphones, vending machines, paid short-term parking, taxi stand, public transit connection.
Colleges/universities with over 2000 students nearest to Milford:
- Framingham State University (about 12 miles; Framingham, MA; Full-time enrollment: 5,743)
- Wellesley College (about 15 miles; Wellesley, MA; FT enrollment: 2,658)
- Bryant University (about 16 miles; Smithfield, RI; FT enrollment: 3,440)
- College of the Holy Cross (about 17 miles; Worcester, MA; FT enrollment: 3,125)
- Babson College (about 17 miles; Wellesley, MA; FT enrollment: 3,230)
- Clark University (about 18 miles; Worcester, MA; FT enrollment: 3,687)
- Worcester Polytechnic Institute (about 18 miles; Worcester, MA; FT enrollment: 3,930)
Public high school in Milford:
- MILFORD HIGH (Students: 1,164, Location: 31 WEST FOUNTAIN STREET, Grades: 8-12)
Public elementary/middle schools in Milford:
- STACY MIDDLE (Students: 963, Location: 66 SCHOOL STREET, Grades: 5-7)
- WOODLAND (Students: 625, Location: 10 NORTH VINE STREET, Grades: 3-4)
- MEMORIAL (Students: 496, Location: 12-14 WALNUT STREET, Grades: KG-2)
- BROOKSIDE (Students: 480, Location: 110 CONGRESS STREET, Grades: KG-5)
- MILFORD MIDDLE EAST (Students: 331, Location: 45 MAIN STREET, Grades: 8)
Private elementary/middle school in Milford:
Points of interest:
Notable locations in Milford: Hill Executive Office Park (A), Milford Country Club (B), Fair Shopping Plaza (C), Hills Shopping Plaza (D), Milford Fire Department Station 1 (E), Milford Fire Department Station 2 Headquarters (F), Milford-Whitinsville Regional Hospital Medical Library (G), Milford Town Library (H). Display/hide their locations on the map
Shopping Centers: Fair Shopping Plaza Shopping Center (1), Quarry Square Shopping Center (2). Display/hide their locations on the map
Main business address in Milford: WATERS CORP /DE/ (A). Display/hide its location on the map
Churches in Milford include: Unitarian Church (A), True LIght Christian Church (B), Trinity Episcopal Church (C), Temple Beth Shalom (D), Salvation Army (E), Saint Marys Church (F), Sacred Heart Parish Church (G), Sacred Heart of Jesus Church (H), Pine Street Baptist Church (I). Display/hide their locations on the map
Cemeteries: North Purchase Street Cemetery (1), Pine Grove Cemetery (2), Saint Marys Cemetery (3), Vernon Grove Cemetery (4), Sacred Heart Cemetery (5). Display/hide their locations on the map
Lakes and reservoirs: Milford Pond (A), Lake Luisa Reservoir (B), Louisa Lake (C), Cedar Swamp Pond (D). Display/hide their locations on the map
Streams, rivers, and creeks: Godfrey Brook (A), Huckleberry Brook (B). Display/hide their locations on the map
Parks in Milford include: Prospect Heights Historic District (1), Hayward Field (2). Display/hide their locations on the map
Tourist attractions: Fun Zone (Amusement & Theme Parks; 110 South Main Street), Skate Palace (Amusement & Theme Parks; 110 South Main Street).
Hotels: Courtyard by Marriott - Milford (10 Fortune Boulevard), Milford Days Inn (3 Fortune Blvd), Holiday Inn Express Milford (50 Fortune Boulevard).
Courts: Mass Commonwealth - District Court Department of Milford- Adult Probation Depart (161 West Street), Milford Juvenile Court (161 West Street), Mass Commonwealth - District Court Department of Milford (161 West Street), Mass Commonwealth - District Court Department of Milford- Juvenile Probation Depart (161 West Street).
Birthplace of: Charles Laquidara - Radio personality, George F. Johnson - Businessman and co-founder of the Endicott Johnson Corporation, Jim Pyne - College football player, Joseph Murray - Surgeon, Michael Videira - Soccer player, Virginia Martinez (Louisiana politician) - Soilder, John Davoren - Politician, William Claflin - Politician, Andres Sandoval - College basketball player (Richmond Spiders), Ralph Lumenti - Baseball player.
Drinking water stations with addresses in Milford and their reported violations in the past:
MILFORD WATER COMPANY (Population served: 27,100, Surface water):Past health violations:Past monitoring violations:
- Treatment Technique (SWTR and GWR) - In AUG-2013. Follow-up actions: St AO (w/o penalty) issued (NOV-26-2013), St Compliance achieved (NOV-26-2013)
- MCL, Average - Between JUL-2011 and SEP-2011, Contaminant: TTHM. Follow-up actions: St AO (w/penalty) issued (NOV-13-2009), St Compliance achieved (FEB-08-2012), St AO (w/o penalty) issued (FEB-08-2012)
- MCL, Average - Between APR-2011 and JUN-2011, Contaminant: TTHM. Follow-up actions: St AO (w/o penalty) issued (JUL-25-2011), St Compliance achieved (FEB-08-2012)
- MCL, Average - Between JAN-2011 and MAR-2011, Contaminant: TTHM. Follow-up actions: St AO (w/penalty) issued (NOV-13-2009), St AO (w/o penalty) issued (APR-21-2011), St Compliance achieved (FEB-08-2012)
- OCCT/SOWT Treatment Installation/Demonstration - In OCT-16-2010, Contaminant: Lead and Copper Rule. Follow-up actions: St Other (JUN-20-2011), St Compliance achieved (JUL-11-2011)
- MCL, Average - Between OCT-2010 and DEC-2010, Contaminant: TTHM. Follow-up actions: St AO (w/penalty) issued (NOV-13-2009), St AO (w/o penalty) issued (FEB-01-2011), St Compliance achieved (FEB-08-2012)
- 3 other older health violations
- Monitoring and Reporting (DBP) - Between JUL-2010 and SEP-2010, Contaminant: Chlorine. Follow-up actions: St AO (w/o penalty) issued (NOV-12-2010), St Compliance achieved (DEC-02-2010)
- One minor monitoring violation
- 2 regular monitoring violations
| This place: | 2.5 people |
| Massachusetts: | 2.5 people |
| This place: | 66.4% |
| Whole state: | 63.0% |
| This place: | 6.2% |
| Whole state: | 7.0% |
Likely homosexual households (counted as self-reported same-sex unmarried-partner households)
- Lesbian couples: 0.5% of all households
- Gay men: 0.2% of all households
People in group quarters in Milford in 2010:
- 116 people in nursing facilities/skilled-nursing facilities
- 20 people in other noninstitutional facilities
- 16 people in group homes intended for adults
- 9 people in emergency and transitional shelters (with sleeping facilities) for people experiencing homelessness
- 8 people in group homes for juveniles (non-correctional)
- 8 people in residential treatment centers for juveniles (non-correctional)
People in group quarters in Milford in 2000:
- 260 people in nursing homes
- 40 people in other noninstitutional group quarters
- 20 people in homes for the mentally retarded
- 4 people in homes or halfway houses for drug/alcohol abuse
Banks with most branches in Milford (2011 data):
- The Milford National Bank and Trust Company: The Milford National Bank And Trust, South Main Street Branch, Milford Branch, Internet Banking Office Branch. Info updated 2006/11/03: Bank assets: $267.5 mil, Deposits: $233.6 mil, local headquarters, positive income, Commercial Lending Specialization, 6 total offices, Holding Company: Mnb Bancorp
- Milford Federal Savings and Loan Association: Milford Federal Savings And Loan Ass at 246 Main St, branch established on 1937/01/01; Route 109 Plaza Branch at 91 Medway Road, branch established on 1937/01/01. Info updated 2011/07/21: Bank assets: $343.1 mil, Deposits: $301.3 mil, local headquarters, positive income, Mortgage Lending Specialization, 4 total offices
- Bank of America, National Association: Milford Branch at 82 Prospect Street, branch established on 1972/11/27; East Milford Branch at 209 East Main Street Suite #1, branch established on 2002/06/17. Info updated 2009/11/18: Bank assets: $1,451,969.3 mil, Deposits: $1,077,176.8 mil, headquarters in Charlotte, NC, positive income, 5782 total offices, Holding Company: Bank Of America Corporation
- TD Bank, National Association: Milford Branch at 196 East Main Street, branch established on 1988/11/21. Info updated 2010/10/04: Bank assets: $188,912.6 mil, Deposits: $153,149.8 mil, headquarters in Wilmington, DE, positive income, 1314 total offices, Holding Company: Toronto-Dominion Bank, The
- Middlesex Savings Bank: Milford Branch at 140 South Main Street, branch established on 2000/01/13. Info updated 2009/07/16: Bank assets: $4,034.8 mil, Deposits: $3,490.0 mil, headquarters in Natick, MA, positive income, Mortgage Lending Specialization, 33 total offices, Holding Company: Middlesex Bancorp Mhc
- RBS Citizens, National Association: Milford Stop & Shop Rt 16 Branch at 196 East Main Street, Rt 16, branch established on 2002/06/19. Info updated 2007/09/19: Bank assets: $106,940.6 mil, Deposits: $75,690.2 mil, headquarters in Providence, RI, positive income, 1135 total offices, Holding Company: Uk Financial Investments Limited
- Commerce Bank & Trust Company: Milford Branch at 91 Main Street, branch established on 2004/05/21. Info updated 2006/10/06: Bank assets: $1,410.8 mil, Deposits: $1,187.6 mil, headquarters in Worcester, MA, positive income, Commercial Lending Specialization, 14 total offices, Holding Company: Commerce Bancshares Corp.
- UniBank for Savings: Milford Branch at 91 Prospect Street, branch established on 2009/03/09. Info updated 2008/03/03: Bank assets: $1,263.1 mil, Deposits: $1,151.5 mil, headquarters in Whitinsville, MA, positive income, 8 total offices, Holding Company: Ufs Bancorp
- Rockland Trust Company: Milford Branch at 221 Main Street, branch established on 1992/11/16. Info updated 2009/05/20: Bank assets: $4,974.4 mil, Deposits: $3,903.9 mil, headquarters in Rockland, MA, positive income, Commercial Lending Specialization, 67 total offices, Holding Company: Independent Bank Corp.
For population 15 years and over in Milford:
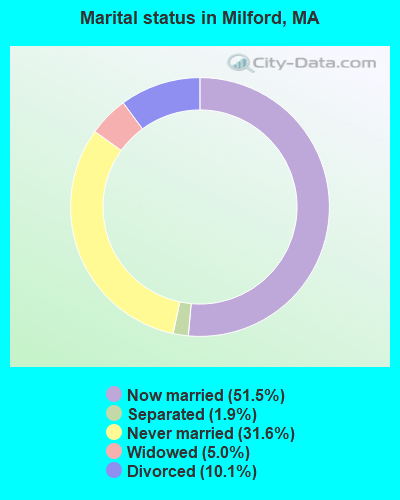
- Never married: 31.6%
- Now married: 51.5%
- Separated: 1.9%
- Widowed: 5.0%
- Divorced: 10.1%
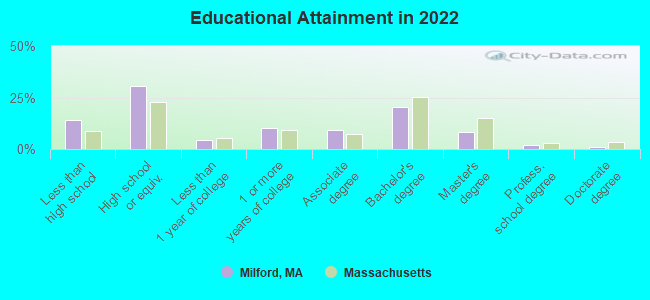
For population 25 years and over in Milford:
- High school or higher: 86.1%
- Bachelor's degree or higher: 32.1%
- Graduate or professional degree: 11.3%
- Unemployed: 4.0%
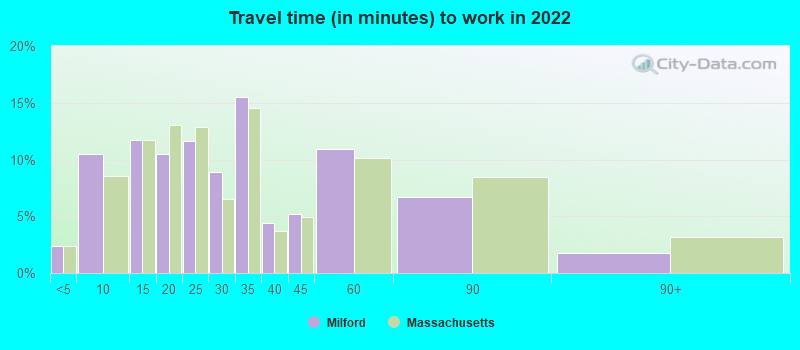
- Mean travel time to work (commute): 26.1 minutes
| Here: | 14.1 |
| Massachusetts average: | 13.0 |
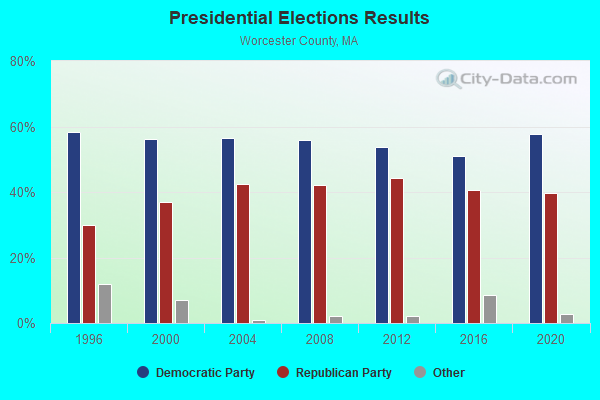
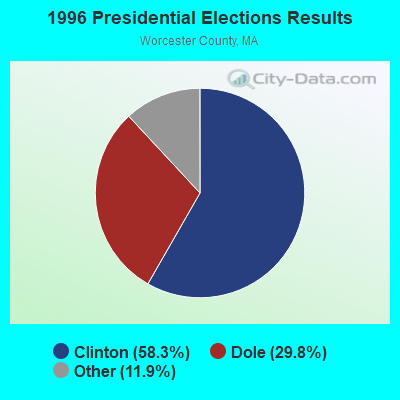
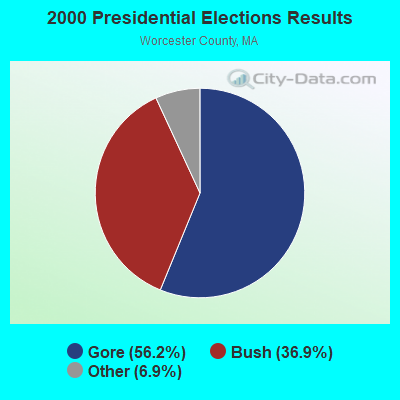
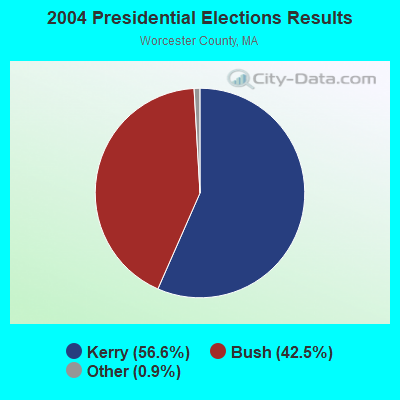

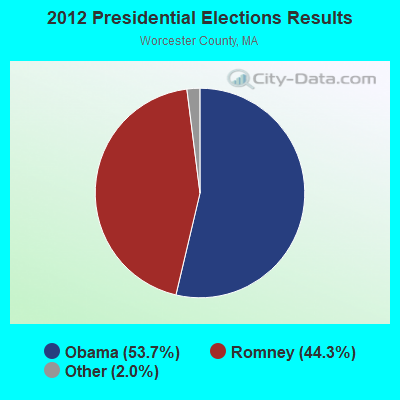

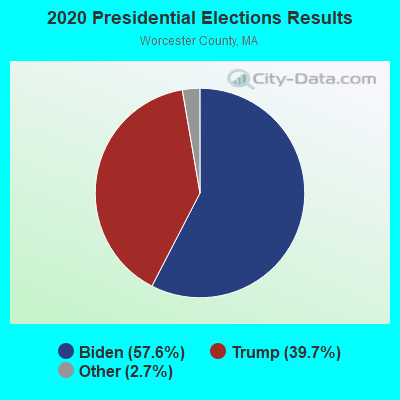
Graphs represent county-level data. Detailed 2008 Election Results
Religion statistics for Milford, MA (based on Worcester County data)
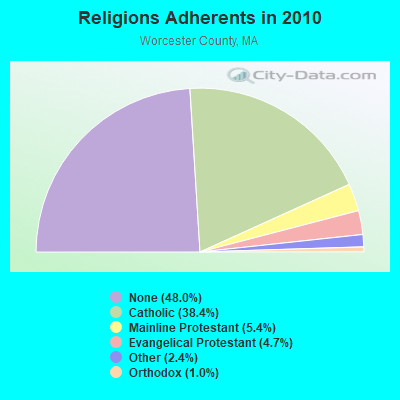
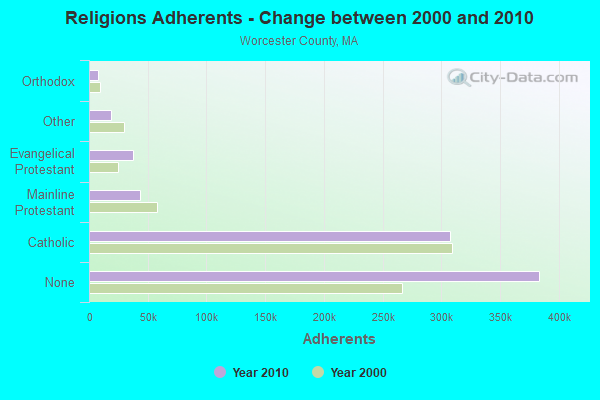
| Religion | Adherents | Congregations |
|---|---|---|
| Catholic | 306,925 | 118 |
| Mainline Protestant | 43,326 | 171 |
| Evangelical Protestant | 37,511 | 203 |
| Other | 18,931 | 69 |
| Orthodox | 7,935 | 15 |
| Black Protestant | 497 | 6 |
| None | 383,427 | - |
Food Environment Statistics:
| Here: | 1.73 / 10,000 pop. |
| Massachusetts: | 1.98 / 10,000 pop. |
| This county: | 0.05 / 10,000 pop. |
| State: | 0.05 / 10,000 pop. |
| Here: | 1.79 / 10,000 pop. |
| State: | 2.22 / 10,000 pop. |
| Worcester County: | 2.22 / 10,000 pop. |
| Massachusetts: | 1.77 / 10,000 pop. |
| This county: | 7.27 / 10,000 pop. |
| Massachusetts: | 8.76 / 10,000 pop. |
| This county: | 8.0% |
| Massachusetts: | 8.1% |
| This county: | 24.0% |
| Massachusetts: | 22.5% |
| This county: | 16.6% |
| Massachusetts: | 16.5% |
Health and Nutrition:
| Milford: | 48.8% |
| State: | 50.5% |
| This city: | 45.1% |
| Massachusetts: | 48.0% |
| Milford: | 28.6 |
| Massachusetts: | 28.4 |
| Milford: | 21.9% |
| Massachusetts: | 20.7% |
| Milford: | 10.4% |
| Massachusetts: | 10.4% |
| Here: | 6.8 |
| State: | 6.8 |
| This city: | 33.4% |
| Massachusetts: | 33.4% |
| This city: | 55.5% |
| State: | 57.1% |
| Here: | 78.1% |
| Massachusetts: | 79.2% |
More about Health and Nutrition of Milford, MA Residents
4.71% of this county's 2021 resident taxpayers lived in other counties in 2020 ($76,229 average adjusted gross income)
| Here: | 4.71% |
| Massachusetts average: | 6.35% |
0.02% of residents moved from foreign countries ($100 average AGI)
Worcester County: 0.02% Massachusetts average: 0.01%
Top counties from which taxpayers relocated into this county between 2020 and 2021:
| from Middlesex County, MA | |
| from Norfolk County, MA | |
| from Suffolk County, MA |
4.84% of this county's 2020 resident taxpayers moved to other counties in 2021 ($87,252 average adjusted gross income)
| Here: | 4.84% |
| Massachusetts average: | 7.18% |
0.03% of residents moved to foreign countries ($199 average AGI)
Worcester County: 0.03% Massachusetts average: 0.02%
Top counties to which taxpayers relocated from this county between 2020 and 2021:
| to Middlesex County, MA | |
| to Norfolk County, MA | |
| to Suffolk County, MA |
| Businesses in Milford, MA | ||||
| Name | Count | Name | Count | |
|---|---|---|---|---|
| ALDI | 1 | Lowe's | 1 | |
| AT&T | 1 | Marriott | 2 | |
| Ace Hardware | 1 | MasterBrand Cabinets | 4 | |
| Advance Auto Parts | 1 | McDonald's | 2 | |
| Applebee's | 1 | Nike | 2 | |
| AutoZone | 1 | Nissan | 1 | |
| Bed Bath & Beyond | 1 | Payless | 1 | |
| Burger King | 1 | Penske | 1 | |
| CVS | 2 | RadioShack | 1 | |
| Circle K | 1 | Rite Aid | 2 | |
| Comfort Inn | 1 | Ryder Rental & Truck Leasing | 1 | |
| DHL | 1 | Shaw's | 1 | |
| Dairy Queen | 1 | Sprint Nextel | 1 | |
| Domino's Pizza | 1 | Staples | 1 | |
| Dunkin Donuts | 5 | Stop & Shop | 1 | |
| FedEx | 5 | Subway | 2 | |
| GNC | 1 | T-Mobile | 2 | |
| H&R Block | 1 | T.G.I. Driday's | 1 | |
| Hilton | 1 | T.J.Maxx | 1 | |
| Holiday Inn | 1 | Target | 1 | |
| Jones New York | 1 | Toyota | 1 | |
| KFC | 1 | UPS | 8 | |
| Kmart | 1 | Walgreens | 1 | |
| Kohl's | 1 | Wendy's | 1 | |
| La Quinta | 1 | World Gym | 1 | |
Strongest AM radio stations in Milford:
- WMRC (1490 AM; 1 kW; MILFORD, MA; Owner: FIRST CLASS RADIO CORP.)
- WAMG (890 AM; 25 kW; DEDHAM, MA; Owner: MEGA COMMUNICATIONS OF DEDHAM LICENSEE, LLC)
- WKOX (1200 AM; 50 kW; FRAMINGHAM, MA; Owner: CAPSTAR TX LIMITED PARTNERSHIP)
- WBIX (1060 AM; 40 kW; NATICK, MA; Owner: LANGER BROADCASTING CORPORATION)
- WALE (990 AM; 50 kW; GREENVILLE, RI; Owner: NORTH AMERICAN BROADCASTING CO., INC.)
- WEEI (850 AM; 50 kW; BOSTON, MA; Owner: ENTERCOM BOSTON LICENSE, LLC)
- WCRN (830 AM; 50 kW; WORCESTER, MA; Owner: CARTER BROADCASTING CORPORATION)
- WRKO (680 AM; 50 kW; BOSTON, MA; Owner: ENTERCOM BOSTON LICENSE, LLC)
- WWZN (1510 AM; 50 kW; BOSTON, MA; Owner: ROSE CITY RADIO CORPORATION)
- WRCA (1330 AM; 25 kW; WALTHAM, MA; Owner: WRCA LICENSE, LLC)
- WBZ (1030 AM; 50 kW; BOSTON, MA; Owner: INFINITY BROADCASTING OPERATIONS, INC.)
- WSRO (650 AM; 2 kW; ASHLAND, MA; Owner: LANGER BROADCASTING GROUP, LLC)
- WVNE (760 AM; daytime; 25 kW; LEICESTER, MA; Owner: BLOUNT MASSCOM, INC.)
Strongest FM radio stations in Milford:
- WBMX (98.5 FM; BOSTON, MA; Owner: INFINITY RADIO OPERATIONS INC.)
- WJMN (94.5 FM; BOSTON, MA; Owner: AMFM RADIO LICENSES, L.L.C.)
- WCRB (102.5 FM; WALTHAM, MA; Owner: CHARLES RIVER BROADCASTING WCRB LICE)
- WTKK (96.9 FM; BOSTON, MA; Owner: GREATER BOSTON RADIO, INC.)
- WBOS (92.9 FM; BROOKLINE, MA; Owner: GREATER BOSTON RADIO, INC.)
- WROR-FM (105.7 FM; FRAMINGHAM, MA; Owner: GREATER BOSTON RADIO, INC.)
- WGBH (89.7 FM; BOSTON, MA; Owner: WGBH EDUCATIONAL FOUNDATION)
- WBUR-FM (90.9 FM; BOSTON, MA; Owner: TRUSTEES OF BOSTON UNIVERSITY)
- WHHB (99.9 FM; HOLLISTON, MA; Owner: HOLLISTON HIGH SCHOOL)
- WWKX (106.3 FM; WOONSOCKET, RI; Owner: AAA ENTERTAINMENT LICENSING LLC)
- WODS (103.3 FM; BOSTON, MA; Owner: INFINITY BROADCASTING OPERATIONS, INC.)
- WAAF (107.3 FM; WORCESTER, MA; Owner: ENTERCOM BOSTON LICENSE, LLC)
- WXKS-FM (107.9 FM; MEDFORD, MA; Owner: AMFM RADIO LICENSES, L.L.C.)
- WWBB (101.5 FM; PROVIDENCE, RI; Owner: CLEAR CHANNEL BROADCASTING LICENSES, INC.)
- WMJX (106.7 FM; BOSTON, MA; Owner: GREATER BOSTON RADIO, INC.)
- WSRS (96.1 FM; WORCESTER, MA; Owner: CAPSTAR TX LIMITED PARTNERSHIP)
- WGAO (88.3 FM; FRANKLIN, MA; Owner: DEAN COLLEGE)
- WICN (90.5 FM; WORCESTER, MA; Owner: WICN PUBLIC RADIO, INC)
- WBCN (104.1 FM; BOSTON, MA; Owner: HEMISPHERE BROADCASTING CORPORATION)
- WZLX (100.7 FM; BOSTON, MA; Owner: INFINITY BROADCASTING CORPORATION OF BOSTON)
TV broadcast stations around Milford:
- WCVB-TV (Channel 5; BOSTON, MA; Owner: WCVB HEARST-ARGYLE TV, INC.)
- WGBH-TV (Channel 2; BOSTON, MA; Owner: WGBH EDUCATIONAL FOUNDATION)
- WUNI (Channel 27; WORCESTER, MA; Owner: ENTRAVISION HOLDINGS, LLC)
- WUTF (Channel 66; MARLBOROUGH, MA; Owner: TELEFUTURA BOSTON LLC)
- WMFP (Channel 62; LAWRENCE, MA; Owner: WSAH LICENSE, INC.)
- WBZ-TV (Channel 4; BOSTON, MA; Owner: VIACOM INC.)
- WGBX-TV (Channel 44; BOSTON, MA; Owner: WGBH EDUCATIONAL FOUNDATION)
- WHDH-TV (Channel 7; BOSTON, MA; Owner: WHDH-TV)
- WSBK-TV (Channel 38; BOSTON, MA; Owner: VIACOM INC.)
- WLVI-TV (Channel 56; CAMBRIDGE, MA; Owner: WLVI, INC.)
- WFXT (Channel 25; BOSTON, MA; Owner: FOX TELEVISION STATIONS INC.)
- W40BO (Channel 40; BOSTON, MA; Owner: PAXSON COMMUNICATIONS LPTV, INC.)
- WNAC-TV (Channel 64; PROVIDENCE, RI; Owner: WNAC, LLC)
- WPRI-TV (Channel 12; PROVIDENCE, RI; Owner: TVL BROADCASTING OF RHODE ISLAND, LLC)
- WLNE-TV (Channel 6; NEW BEDFORD, MA; Owner: FREEDOM BROADCASTING OF SOUTHERN NEW ENGLAND, INC.)
- WWDP (Channel 46; NORWELL, MA; Owner: NORWELL TELEVISION, LLC)
- WJAR (Channel 10; PROVIDENCE, RI; Owner: OUTLET BROADCASTING, INC.)
- WBPX (Channel 68; BOSTON, MA; Owner: PAXSON BOSTON-68 LICENSE, INC.)
- WSBE-TV (Channel 36; PROVIDENCE, RI; Owner: RHODE ISLAND PUBLIC TELECOM. AUTHORITY)
- WPXQ (Channel 69; BLOCK ISLAND, RI; Owner: OCEAN STATE TELEVISION, L.L.C.)
- WTMU-LP (Channel 32; BOSTON, MA; Owner: ZGS BOSTON, INC.)
- WCEA-LP (Channel 58; BOSTON, MA; Owner: CHANNEL 19 TV CORPORATION)
- WYDN (Channel 48; WORCESTER, MA; Owner: EDUCATIONAL PUBLIC TV CORPORATION)
- WRIW-LP (Channel 50; PROVIDENCE, RI; Owner: ZGS PROVIDENCE, INC.)
- WCRN-LP (Channel 34; LEICESTER, MA; Owner: CARTER BROADCASTING CORPORATION)
- National Bridge Inventory (NBI) Statistics
- 14Number of bridges
- 135ft / 41.0mTotal length
- $33,232,000Total costs
- 453,025Total average daily traffic
- 32,830Total average daily truck traffic
- 787,375Total future (year 2031) average daily traffic
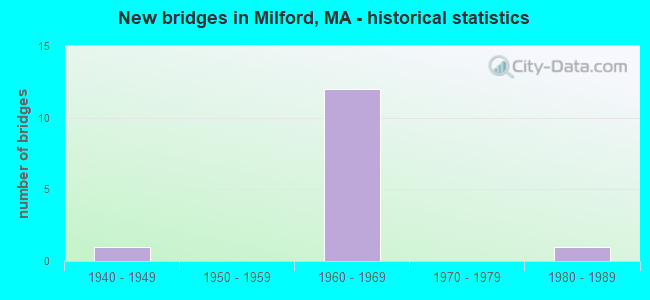
- New bridges - historical statistics
- 11940-1949
- 121960-1969
- 11980-1989
FCC Registered Antenna Towers: 39 (See the full list of FCC Registered Antenna Towers)
FCC Registered Private Land Mobile Towers: 4 (See the full list of FCC Registered Private Land Mobile Towers in Milford, MA)
FCC Registered Broadcast Land Mobile Towers: 21 (See the full list of FCC Registered Broadcast Land Mobile Towers)
FCC Registered Microwave Towers: 10 (See the full list of FCC Registered Microwave Towers in this town)
FCC Registered Paging Towers: 6 (See the full list of FCC Registered Paging Towers)
FCC Registered Amateur Radio Licenses: 107 (See the full list of FCC Registered Amateur Radio Licenses in Milford)
FAA Registered Aircraft Manufacturers and Dealers: 1 (See the full list of FAA Registered Manufacturers and Dealers in Milford)
FAA Registered Aircraft: 11 (See the full list of FAA Registered Aircraft)
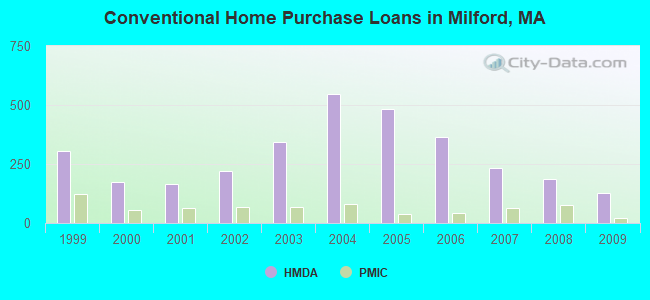
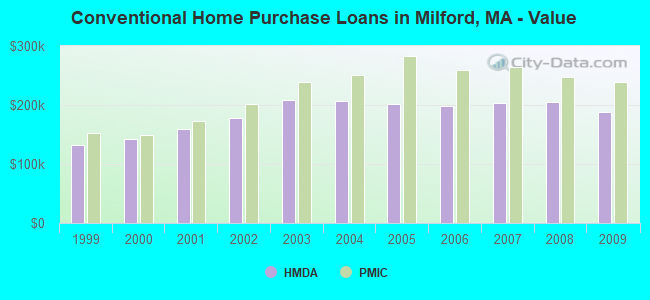
| Home Mortgage Disclosure Act Aggregated Statistics For Year 2009 (Based on 4 full and 1 partial tracts) | ||||||||||
| A) FHA, FSA/RHS & VA Home Purchase Loans | B) Conventional Home Purchase Loans | C) Refinancings | D) Home Improvement Loans | F) Non-occupant Loans on < 5 Family Dwellings (A B C & D) | ||||||
|---|---|---|---|---|---|---|---|---|---|---|
| Number | Average Value | Number | Average Value | Number | Average Value | Number | Average Value | Number | Average Value | |
| LOANS ORIGINATED | 77 | $238,422 | 129 | $187,842 | 539 | $203,462 | 22 | $105,403 | 35 | $155,006 |
| APPLICATIONS APPROVED, NOT ACCEPTED | 6 | $241,638 | 10 | $188,489 | 35 | $232,463 | 2 | $11,245 | 4 | $146,725 |
| APPLICATIONS DENIED | 14 | $203,780 | 27 | $156,772 | 124 | $245,572 | 14 | $80,571 | 17 | $164,647 |
| APPLICATIONS WITHDRAWN | 10 | $207,475 | 12 | $167,168 | 103 | $226,156 | 4 | $206,662 | 4 | $130,637 |
| FILES CLOSED FOR INCOMPLETENESS | 1 | $311,170 | 0 | $0 | 47 | $206,218 | 3 | $197,370 | 4 | $127,160 |
Detailed HMDA statistics for the following Tracts: 7441.01 , 7441.02, 7442.00, 7443.00, 7444.00
| Private Mortgage Insurance Companies Aggregated Statistics For Year 2009 (Based on 4 full and 1 partial tracts) | ||||||
| A) Conventional Home Purchase Loans | B) Refinancings | C) Non-occupant Loans on < 5 Family Dwellings (A & B) | ||||
|---|---|---|---|---|---|---|
| Number | Average Value | Number | Average Value | Number | Average Value | |
| LOANS ORIGINATED | 21 | $239,600 | 10 | $287,639 | 0 | $0 |
| APPLICATIONS APPROVED, NOT ACCEPTED | 7 | $242,597 | 9 | $297,412 | 1 | $268,000 |
| APPLICATIONS DENIED | 2 | $361,660 | 3 | $386,643 | 0 | $0 |
| APPLICATIONS WITHDRAWN | 1 | $244,730 | 1 | $210,750 | 0 | $0 |
| FILES CLOSED FOR INCOMPLETENESS | 0 | $0 | 0 | $0 | 0 | $0 |
Detailed PMIC statistics for the following Tracts: 7441.01 , 7441.02, 7442.00, 7443.00, 7444.00
2002 - 2018 National Fire Incident Reporting System (NFIRS) incidents
- Fire incident types reported to NFIRS in Milford, MA
- 1,11748.9%Structure Fires
- 82536.2%Outside Fires
- 30513.4%Mobile Property/Vehicle Fires
- 351.5%Other
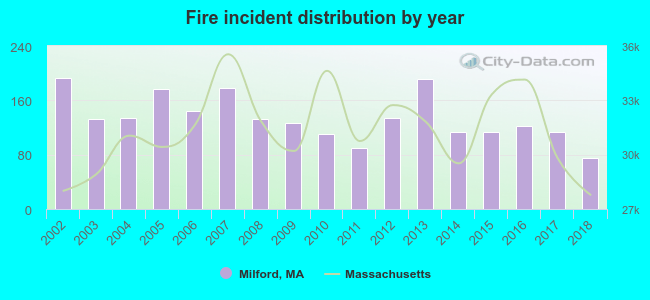 According to the data from the years 2002 - 2018 the average number of fire incidents per year is 134. The highest number of reported fires - 193 took place in 2002, and the least - 75 in 2018. The data has a decreasing trend.
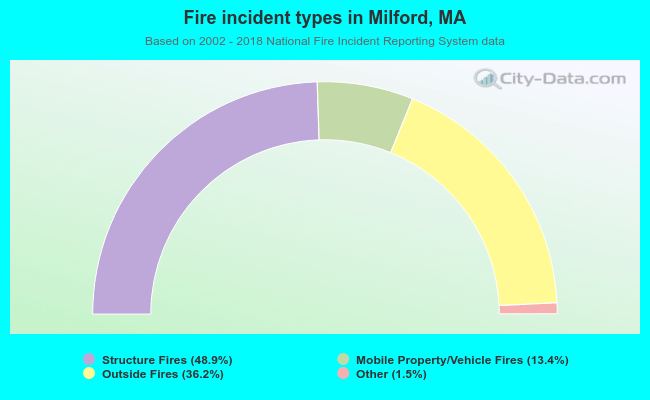 When looking into fire subcategories, the most reports belonged to: Structure Fires (48.9%), and Outside Fires (36.2%).
Fire-safe hotels and motels in Milford, Massachusetts:
- Doubletree, 11 Beaver St, Milford, Massachusetts 01757 , Phone: (508) 478-7010, Fax: (508) 478-5600
- Best Western, 3 Fortune Blvd, Milford, Massachusetts 01757 , Phone: (508) 634-2499
- Holiday Inn Express, 50 Fortune Blvd, Milford, Massachusetts 01757 , Phone: (508) 634-1054, Fax: (508) 634-0096
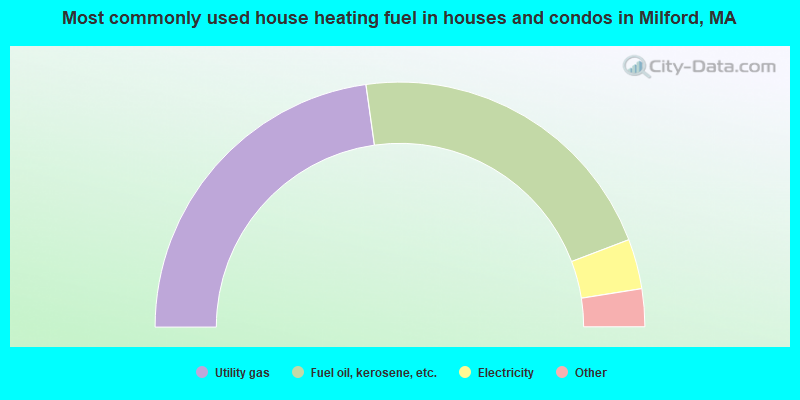
- 45.6%Utility gas
- 42.9%Fuel oil, kerosene, etc.
- 6.6%Electricity
- 3.6%Bottled, tank, or LP gas
- 0.6%Wood
- 0.4%Solar energy
- 0.3%Other fuel
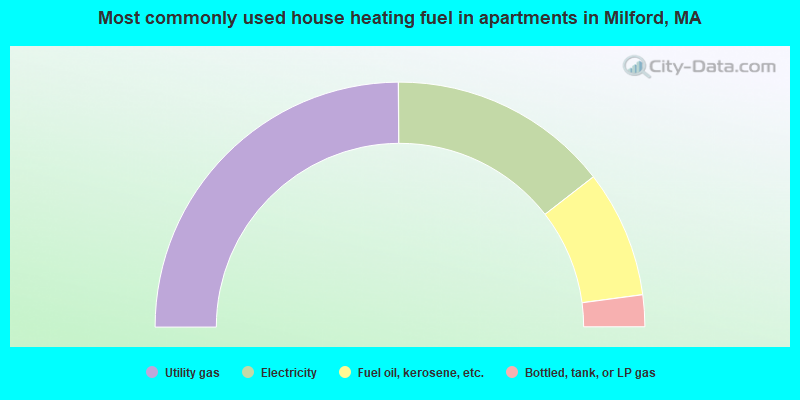
- 49.8%Utility gas
- 29.2%Electricity
- 16.8%Fuel oil, kerosene, etc.
- 4.2%Bottled, tank, or LP gas
Milford compared to Massachusetts state average:
- Unemployed percentage significantly below state average.
- Foreign-born population percentage above state average.
- Length of stay since moving in above state average.
Milford on our top lists:
- #16 on the list of "Top 101 cities with the most residents born in Brazil (population 500+)"
- #27 on the list of "Top 101 cities with the most residents born in Portugal (population 500+)"
- #59 on the list of "Top 101 cities with the most residents born in Southern Europe (population 500+)"
- #71 on the list of "Top 101 cities with the most residents born in Ecuador (population 500+)"
- #80 on the list of "Top 101 cities with the most residents born in Chile (population 500+)"
- #97 on the list of "Top 101 cities with the most residents born in South America (population 500+)"
- #4 on the list of "Top 101 counties with the highest carbon monoxide air pollution readings in 2012 (ppm)"
- #5 on the list of "Top 101 counties with the most Catholic congregations"
- #12 on the list of "Top 101 counties with the highest surface withdrawal of fresh water for public supply"
- #16 on the list of "Top 101 counties with the highest total withdrawal of fresh water for public supply"
- #23 on the list of "Top 101 counties with the highest Sulfur Oxides Annual air pollution readings in 2012 (µg/m3)"

|
|
Total of 412 patent applications in 2008-2024.