Work and Jobs in Tucson, Arizona (AZ) Detailed Stats
Occupations, Industries, Unemployment, Workers, Commute
Settings
X


Recent posts about work in Tucson, Arizona on our local forum with over 2,400,000 registered users:
 | Job Comparisons... Eugene vs Tucson (5 replies) |
| Retirement income in Tucson (8 replies) |
| Teaching jobs in Tucson (8 replies) |
| Jobs/employment picture in Tucson (9 replies) |
| Tucson Minimum Wage (4 replies) |
| Thoughts on my concerns about a move to Phoenix or Tucson -50yo professional and 24yo son. (6 replies) |
Latest news about work in Tucson, AZ collected exclusively by city-data.com from local newspapers, TV, and radio stations
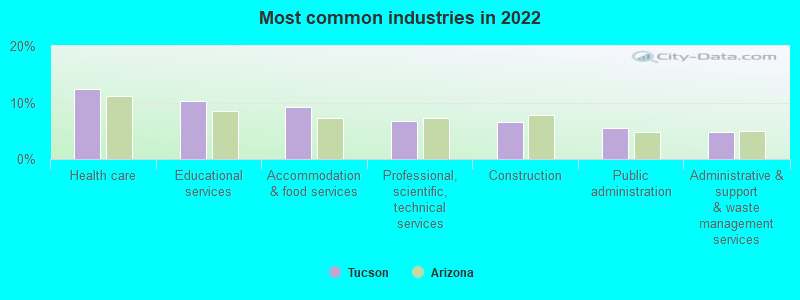
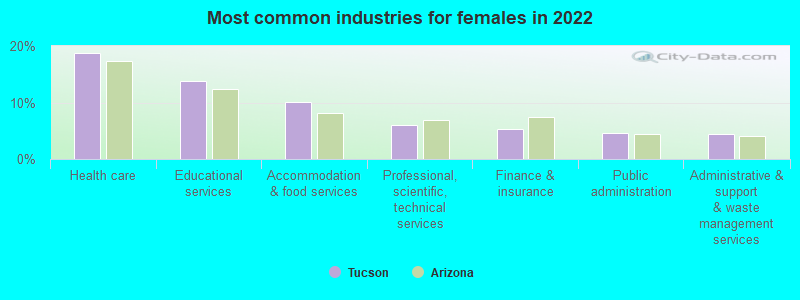
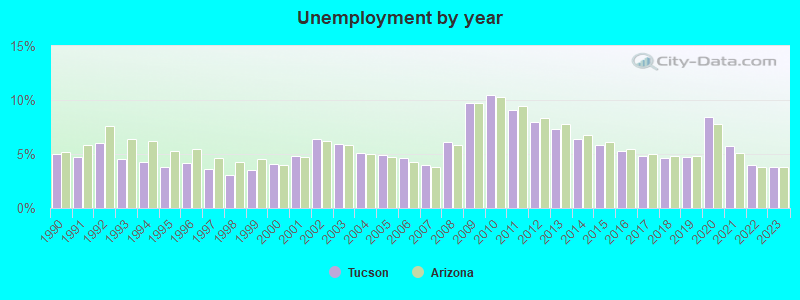
The unemployment rate in 2023 in Tucson, AZ was 3.8%, which was about the same as the unemployment rate of 3.8% across the entire state of Arizona. Compared to the unemployment rate of 7.3% in 2013, this represents a decrease of 92.1%. According to 2022 data, the most common industries in Tucson are: Health care (12.4% of civilian employees), Educational services (10.2% of civilian employees), Accommodation & food services (9.3% of civilian employees). 97.9% of workers work in Pima County and 13.4% of all workers work at home. 66.0% of workers are employees of private companies, which is 4.9% less than the rate of 69.3% across the entire state of Arizona.
Whole page based on the data from 2000 / 2022 when the population of Tucson, Arizona was 486,699 / 546,598
Whole page based on the data from 2000 / 2022 when the population of Tucson, Arizona was 486,699 / 546,598
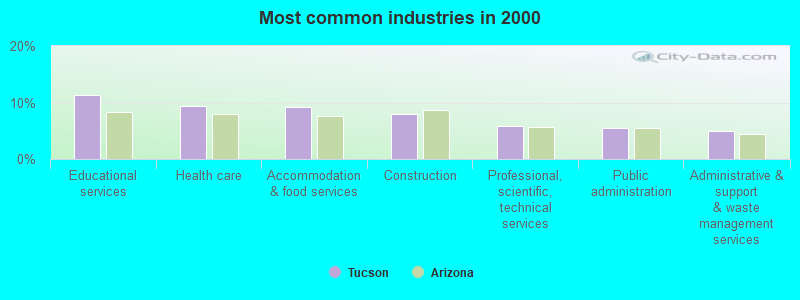
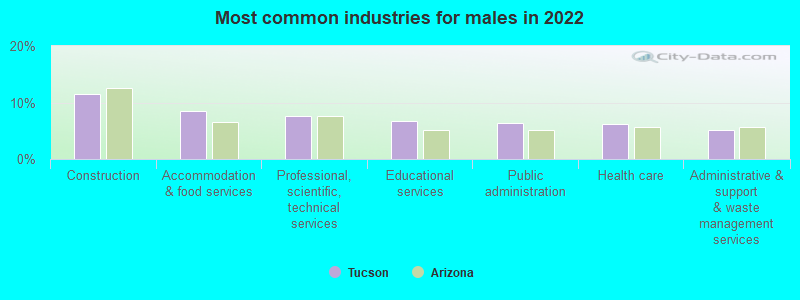
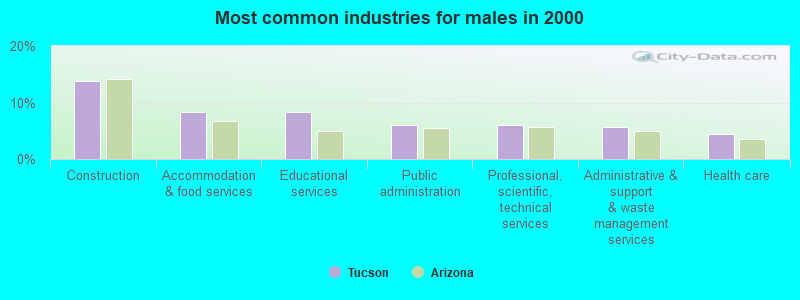
Most common industries
Most common industries | Most common industries | |||||
|---|---|---|---|---|---|---|
Industry | All | Males | Females | All | Males | Females |
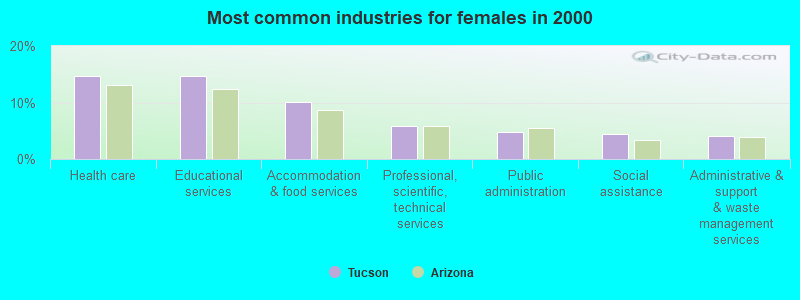
| Health care | 12.4% (31,688) | 6.3% (8,274) | 18.8% (23,414) | 9.3% (20,165) | 4.5% (5,073) | 14.7% (15,092) |
| Educational services | 10.2% (26,240) | 6.8% (8,952) | 13.9% (17,288) | 11.4% (24,518) | 8.3% (9,447) | 14.7% (15,071) |
| Accommodation and food services | 9.3% (23,746) | 8.4% (11,108) | 10.2% (12,638) | 9.2% (19,843) | 8.4% (9,501) | 10.1% (10,342) |
| Professional, scientific, and technical services | 6.8% (17,399) | 7.5% (9,958) | 6.0% (7,441) | 5.9% (12,737) | 6.0% (6,812) | 5.8% (5,925) |
| Construction | 6.6% (16,910) | 11.4% (15,106) | 1.4% (1,804) | 8.0% (17,337) | 13.9% (15,722) | 1.6% (1,615) |
| Public administration | 5.5% (13,999) | 6.3% (8,335) | 4.6% (5,664) | 5.4% (11,698) | 6.1% (6,874) | 4.7% (4,824) |
| Administrative and support and waste management services | 4.8% (12,307) | 5.2% (6,839) | 4.4% (5,468) | 4.9% (10,557) | 5.6% (6,377) | 4.1% (4,180) |
| Finance and insurance | 3.8% (9,643) | 2.3% (3,048) | 5.3% (6,595) | 2.9% (6,190) | 1.8% (2,075) | 4.0% (4,115) |
| Transportation equipment | 2.9% (7,372) | 4.8% (6,375) | 0.8% (997) | 2.6% (5,698) | 3.6% (4,112) | 1.5% (1,586) |
| Other transportation, and support activities, and couriers | 2.5% (6,294) | 3.3% (4,362) | 1.6% (1,932) | 1.1% (2,418) | 1.4% (1,619) | 0.8% (799) |
| Social assistance | 2.4% (6,132) | 0.5% (705) | 4.4% (5,427) | 2.5% (5,433) | 0.8% (908) | 4.4% (4,525) |
| Real estate and rental and leasing | 2.2% (5,649) | 2.0% (2,688) | 2.4% (2,961) | 2.4% (5,148) | 2.1% (2,394) | 2.7% (2,754) |
| Arts, entertainment, and recreation | 2.0% (5,189) | 2.5% (3,332) | 1.5% (1,857) | 2.2% (4,697) | 2.3% (2,647) | 2.0% (2,050) |
| Food and beverage stores | 1.9% (4,988) | 1.7% (2,244) | 2.2% (2,744) | 2.2% (4,671) | 2.3% (2,590) | 2.0% (2,081) |
| Department and other general merchandise stores | 1.9% (4,848) | 1.8% (2,376) | 2.0% (2,472) | 1.9% (4,077) | 1.4% (1,528) | 2.5% (2,549) |
| Personal and laundry services | 1.9% (4,749) | 1.4% (1,842) | 2.3% (2,907) | 1.5% (3,187) | 0.7% (745) | 2.4% (2,442) |
| Repair and maintenance | 1.5% (3,759) | 2.1% (2,804) | 0.8% (955) | 1.7% (3,769) | 3.0% (3,356) | 0.4% (413) |
| Religious, grantmaking, civic, professional, and similar organizations | 1.4% (3,596) | 1.2% (1,613) | 1.6% (1,983) | 1.3% (2,728) | 0.9% (1,027) | 1.7% (1,701) |
| Motor vehicle and parts dealers | 1.4% (3,531) | 2.4% (3,125) | 0.3% (406) | 1.7% (3,573) | 2.3% (2,657) | 0.9% (916) |
| Building material and garden equipment and supplies dealers | 1.3% (3,373) | 1.7% (2,224) | 0.9% (1,149) | 0.8% (1,736) | 1.1% (1,278) | 0.4% (458) |
| Electronic shopping and mail-order houses | 1.1% (2,709) | 1.1% (1,450) | 1.0% (1,259) | 0.5% (1,034) | 0.2% (273) | 0.7% (761) |
| Clothing and accessories, including shoe, stores | 0.9% (2,377) | 0.5% (617) | 1.4% (1,760) | 0.5% (1,127) | 0.3% (341) | 0.8% (786) |
| Private households | 0.9% (2,310) | 0.3% (332) | 1.6% (1,978) | 0.6% (1,219) | 0.0% (54) | 1.1% (1,165) |
| Furniture and home furnishings, and household appliance stores | 0.8% (2,137) | 1.1% (1,438) | 0.6% (699) | 0.7% (1,543) | 0.9% (977) | 0.6% (566) |
| Truck transportation | 0.8% (1,980) | 1.4% (1,844) | 0.1% (136) | 0.6% (1,380) | 1.1% (1,204) | 0.2% (176) |
| Warehousing and storage | 0.7% (1,733) | 1.0% (1,334) | 0.3% (399) | 0.1% (159) | 0.1% (128) | 0.0% (31) |
| Broadcasting and telecommunications | 0.7% (1,668) | 0.5% (680) | 0.8% (988) | 1.5% (3,346) | 1.5% (1,679) | 1.6% (1,667) |
| Miscellaneous manufacturing | 0.6% (1,624) | 0.4% (512) | 0.9% (1,112) | 1.0% (2,089) | 1.2% (1,357) | 0.7% (732) |
| Used merchandise, gift, novelty, and souvenir, and other miscellaneous stores | 0.6% (1,598) | 0.5% (724) | 0.7% (874) | 0.9% (1,943) | 0.6% (725) | 1.2% (1,218) |
| Publishing, and motion picture and sound recording industries | 0.6% (1,534) | 0.9% (1,220) | 0.3% (314) | 0.9% (1,917) | 0.8% (936) | 1.0% (981) |
| Agriculture, forestry, fishing and hunting | 0.6% (1,509) | 1.0% (1,352) | 0.1% (157) | 0.2% (525) | 0.3% (308) | 0.2% (217) |
| Computer and electronic products | 0.5% (1,396) | 0.8% (1,034) | 0.3% (362) | 1.3% (2,859) | 1.7% (1,871) | 1.0% (988) |
| Machinery | 0.5% (1,362) | 0.9% (1,246) | 0.1% (116) | 0.4% (959) | 0.6% (681) | 0.3% (278) |
| Pharmacies and drug stores | 0.5% (1,315) | 0.3% (360) | 0.8% (955) | 0.5% (1,100) | 0.3% (341) | 0.7% (759) |
| Metal and metal products | 0.5% (1,281) | 0.9% (1,236) | 0.0% (45) | 0.8% (1,706) | 1.0% (1,172) | 0.5% (534) |
| Gasoline stations | 0.5% (1,262) | 0.4% (465) | 0.6% (797) | 0.2% (384) | 0.2% (223) | 0.2% (161) |
| Sporting goods, camera, and hobby and toy stores | 0.5% (1,261) | 0.8% (996) | 0.2% (265) | 0.4% (766) | 0.4% (411) | 0.3% (355) |
| Other direct selling establishments | 0.5% (1,251) | 0.3% (416) | 0.7% (835) | 0.5% (1,050) | 0.4% (454) | 0.6% (596) |
| Radio, TV, and computer stores | 0.5% (1,206) | 0.6% (805) | 0.3% (401) | 0.8% (1,691) | 0.9% (1,059) | 0.6% (632) |
| Health and personal care, except drug, stores | 0.4% (1,007) | 0.2% (269) | 0.6% (738) | 0.2% (383) | 0.1% (135) | 0.2% (248) |
| Mining, quarrying, and oil and gas extraction | 0.4% (953) | 0.7% (871) | 0.1% (82) | 0.3% (726) | 0.6% (639) | 0.1% (87) |
| Electrical equipment, appliances, and components | 0.3% (845) | 0.6% (845) | 0.0% (0) | 0.1% (315) | 0.2% (212) | 0.1% (103) |
| Retail florists | 0.3% (837) | 0.0% (0) | 0.7% (837) | 0.1% (184) | 0.0% (12) | 0.2% (172) |
| U. S. Postal service | 0.3% (798) | 0.2% (296) | 0.4% (502) | 0.6% (1,260) | 0.8% (871) | 0.4% (389) |
| Hardware, plumbing and heating equipment, and supplies merchant wholesalers | 0.3% (757) | 0.6% (757) | 0.0% (0) | 0.1% (280) | 0.2% (205) | 0.1% (75) |
| Furniture and related product manufacturing | 0.3% (734) | 0.5% (628) | 0.1% (106) | 0.3% (647) | 0.5% (545) | 0.1% (102) |
| Food | 0.3% (706) | 0.4% (572) | 0.1% (134) | 0.3% (631) | 0.3% (341) | 0.3% (290) |
| Machinery, equipment, and supplies merchant wholesalers | 0.2% (636) | 0.3% (356) | 0.2% (280) | 0.2% (526) | 0.4% (415) | 0.1% (111) |
| Nonmetallic mineral products | 0.2% (629) | 0.3% (437) | 0.2% (192) | 0.4% (767) | 0.5% (543) | 0.2% (224) |
| Rail transportation | 0.2% (614) | 0.5% (614) | 0.0% (0) | 0.2% (414) | 0.3% (391) | 0.0% (23) |
| Groceries and related products merchant wholesalers | 0.2% (572) | 0.4% (476) | 0.1% (96) | 0.4% (866) | 0.6% (687) | 0.2% (179) |
| Utilities | 0.2% (552) | 0.1% (177) | 0.3% (375) | 0.6% (1,334) | 0.9% (998) | 0.3% (336) |
| Plastics and rubber products | 0.2% (529) | 0.3% (420) | 0.1% (109) | 0.3% (631) | 0.3% (384) | 0.2% (247) |
| Air transportation | 0.2% (476) | 0.4% (476) | 0.0% (0) | 0.8% (1,667) | 0.6% (651) | 1.0% (1,016) |
| Professional and commercial equipment and supplies merchant wholesalers | 0.2% (419) | 0.1% (130) | 0.2% (289) | 0.3% (581) | 0.3% (300) | 0.3% (281) |
| Jewelry, luggage, and leather goods stores | 0.1% (293) | 0.1% (123) | 0.1% (170) | 0.2% (362) | 0.1% (149) | 0.2% (213) |
| Data processing, libraries, and other information services | 0.1% (284) | 0.1% (105) | 0.1% (179) | 0.5% (1,087) | 0.4% (484) | 0.6% (603) |
| Music stores | 0.1% (282) | 0.1% (140) | 0.1% (142) | 0.1% (267) | 0.2% (193) | 0.1% (74) |
| Book stores and news dealers | 0.1% (275) | 0.1% (84) | 0.2% (191) | 0.2% (428) | 0.2% (180) | 0.2% (248) |
| Printing and related support activities | 0.1% (234) | 0.1% (185) | 0.0% (49) | 0.5% (973) | 0.5% (597) | 0.4% (376) |
| Vending machine operators | 0.1% (228) | 0.2% (228) | 0.0% (0) | 0.0% (101) | 0.1% (73) | 0.0% (28) |
| Wood products | 0.1% (142) | 0.0% (50) | 0.1% (92) | 0.1% (275) | 0.2% (228) | 0.0% (47) |
| Beverage and tobacco products | 0.0% (118) | 0.1% (118) | 0.0% (0) | 0.1% (251) | 0.2% (179) | 0.1% (72) |
| Paper | 0.0% (66) | 0.0% (0) | 0.1% (66) | 0.1% (154) | 0.1% (121) | 0.0% (33) |
| Lumber and other construction materials merchant wholesalers | 0.0% (62) | 0.0% (62) | 0.0% (0) | 0.2% (356) | 0.3% (303) | 0.1% (53) |
| Motor vehicles, parts and supplies merchant wholesalers | 0.0% (53) | 0.0% (53) | 0.0% (0) | 0.1% (302) | 0.2% (275) | 0.0% (27) |
| Office supplies and stationery stores | 0.0% (47) | 0.0% (47) | 0.0% (0) | 0.1% (317) | 0.1% (152) | 0.2% (165) |
| Alcoholic beverages merchant wholesalers | 0.0% (0) | 0.0% (0) | 0.0% (0) | 0.1% (237) | 0.2% (178) | 0.1% (59) |
| Miscellaneous nondurable goods merchant wholesalers | 0.0% (0) | 0.0% (0) | 0.0% (0) | 0.2% (376) | 0.3% (303) | 0.1% (73) |
| Electrical and electronic goods merchant wholesalers | 0.0% (0) | 0.0% (0) | 0.0% (0) | 0.2% (513) | 0.3% (376) | 0.1% (137) |
| Recyclable material merchant wholesalers | 0.0% (0) | 0.0% (0) | 0.0% (0) | 0.1% (164) | 0.1% (155) | 0.0% (9) |
Unemployment in Tucson
- Unemployment by race in 2022
- Unemployment rate for White non-Hispanic residents
- 3.7%Males
- 3.9%Females
- Unemployment rate for Black residents
- 12.6%Males
- 17.1%Females
- Unemployment rate for American Indian and Alaska Native residents
- 4.5%Males
- 18.0%Females
- Unemployment rate for Asian residents
- 2.6%Males
- 3.6%Females
- Unemployment rate for other race residents
- 6.6%Males
- 7.6%Females
- Unemployment rate for two or more race residents
- 5.8%Males
- 5.3%Females
- Unemployment rate for Hispanic or Latino residents
- 6.4%Males
- 5.8%Females
- Unemployment by race in 2000
- Unemployment rate for White non-Hispanic residents
- 5.4%Males
- 4.4%Females
- Unemployment rate for Black residents
- 9.2%Males
- 8.9%Females
- Unemployment rate for American Indian and Alaska Native residents
- 10.9%Males
- 10.6%Females
- Unemployment rate for Asian residents
- 4.0%Males
- 5.9%Females
- Unemployment rate for other race residents
- 6.5%Males
- 8.3%Females
- Unemployment rate for two or more race residents
- 9.0%Males
- 7.5%Females
- Unemployment rate for Hispanic or Latino residents
- 7.1%Males
- 7.2%Females
Unemployment in 2023:
| Tucson: | 3.8% |
| Arizona: | 3.8% |
Unemployment in 2022:
| Tucson: | 4.0% |
| Arizona: | 3.8% |
Unemployment in 2021:
| Tucson: | 5.7% |
| Arizona: | 5.1% |
Unemployment in 2020:
| Tucson: | 8.4% |
| Arizona: | 7.8% |
Unemployment in 2019:
| Tucson: | 4.7% |
| Arizona: | 4.8% |
Unemployment in 2018:
| Tucson: | 4.6% |
| Arizona: | 4.8% |
Unemployment in 2017:
| Tucson: | 4.8% |
| Arizona: | 5.0% |
Unemployment in 2016:
| Tucson: | 5.3% |
| Arizona: | 5.5% |
Unemployment in 2015:
| Tucson: | 5.8% |
| Arizona: | 6.1% |
Unemployment in 2014:
| Tucson: | 6.4% |
| Arizona: | 6.8% |
Unemployment in 2013:
| Tucson: | 7.3% |
| Arizona: | 7.8% |
Unemployment in 2012:
| Tucson: | 8.0% |
| Arizona: | 8.3% |
Unemployment in 2011:
| Tucson: | 9.1% |
| Arizona: | 9.4% |
Unemployment in 2010:
| Tucson: | 10.5% |
| Arizona: | 10.3% |
Unemployment in 2009:
| Tucson: | 9.7% |
| Arizona: | 9.7% |
Unemployment in 2008:
| Tucson: | 6.1% |
| Arizona: | 5.8% |
Unemployment in 2007:
| Tucson: | 4.0% |
| Arizona: | 3.8% |
Unemployment in 2006:
| Tucson: | 4.6% |
| Arizona: | 4.3% |
Unemployment in 2005:
| Tucson: | 4.9% |
| Arizona: | 4.7% |
Unemployment in 2004:
| Tucson: | 5.1% |
| Arizona: | 5.0% |
Unemployment in 2003:
| Tucson: | 5.9% |
| Arizona: | 5.8% |
Unemployment in 2002:
| Tucson: | 6.4% |
| Arizona: | 6.2% |
Unemployment in 2001:
| Tucson: | 4.8% |
| Arizona: | 4.7% |
Unemployment in 2000:
| Tucson: | 4.1% |
| Arizona: | 4.0% |
Unemployment in 1999:
| Tucson: | 3.5% |
| Arizona: | 4.5% |
Unemployment in 1998:
| Tucson: | 3.1% |
| Arizona: | 4.3% |
Unemployment in 1997:
| Tucson: | 3.6% |
| Arizona: | 4.6% |
Unemployment in 1996:
| Tucson: | 4.2% |
| Arizona: | 5.5% |
Unemployment in 1995:
| Tucson: | 3.8% |
| Arizona: | 5.3% |
Unemployment in 1994:
| Tucson: | 4.3% |
| Arizona: | 6.2% |
Unemployment in 1993:
| Tucson: | 4.5% |
| Arizona: | 6.4% |
Unemployment in 1992:
| Tucson: | 6.0% |
| Arizona: | 7.6% |
Unemployment in 1991:
| Tucson: | 4.7% |
| Arizona: | 5.8% |
Unemployment in 1990:
| Tucson: | 5.0% |
| Arizona: | 5.2% |
Time leaving home to go to work

12:00 a.m. to 4:59 a.m.:
| Tucson: | 5.4% (11,949) |
| Arizona: | 8.7% (238,659) |
5:00 a.m. to 5:29 a.m.:
| Tucson: | 4.2% (9,312) |
| Arizona: | 6.0% (164,616) |
5:30 a.m. to 5:59 a.m.:
| Tucson: | 6.4% (14,155) |
| Arizona: | 5.4% (149,311) |
6:00 a.m. to 6:29 a.m.:
| Tucson: | 6.9% (15,290) |
| Arizona: | 9.3% (256,070) |
6:30 a.m. to 6:59 a.m.:
| Tucson: | 10.5% (23,415) |
| Arizona: | 9.1% (249,459) |
7:00 a.m. to 7:29 a.m.:
| Tucson: | 13.2% (29,426) |
| Arizona: | 13.4% (369,779) |
7:30 a.m. to 7:59 a.m.:
| Tucson: | 12.1% (26,929) |
| Arizona: | 10.4% (285,166) |
8:00 a.m. to 8:29 a.m.:
| Tucson: | 8.8% (19,525) |
| Arizona: | 10.0% (273,857) |
8:30 a.m. to 8:59 a.m.:
| Tucson: | 5.4% (11,925) |
| Arizona: | 4.2% (116,729) |
9:00 a.m. to 9:59 a.m.:
| Tucson: | 6.5% (14,591) |
| Arizona: | 5.9% (161,259) |
10:00 a.m. to 10:59 a.m.:
| Tucson: | 2.5% (5,478) |
| Arizona: | 2.6% (71,656) |
11:00 a.m. to 11:59 a.m.:
| Tucson: | 2.1% (4,641) |
| Arizona: | 1.5% (41,498) |
12:00 p.m. to 3:59 p.m.:
| Tucson: | 9.9% (21,952) |
| Arizona: | 6.9% (190,458) |
4:00 p.m. to 11:59 p.m.:
| Tucson: | 6.4% (14,222) |
| Arizona: | 6.6% (182,731) |
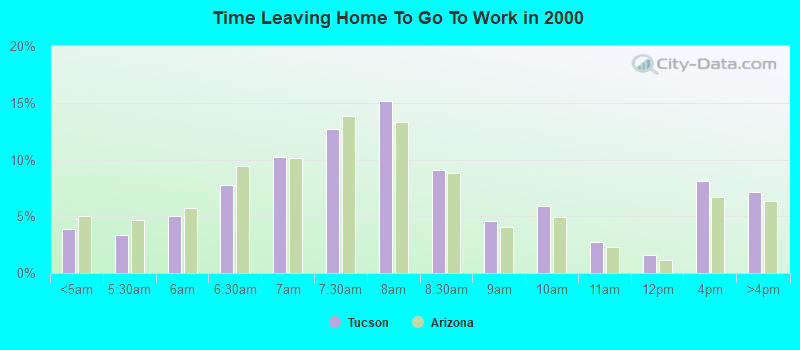
<5am:
| Tucson: | 3.9% (8,336) |
| Arizona: | 5.0% (110,126) |
5:30am:
| Tucson: | 3.4% (7,293) |
| Arizona: | 4.7% (102,952) |
6am:
| Tucson: | 5.1% (10,942) |
| Arizona: | 5.8% (127,515) |
6:30am:
| Tucson: | 7.8% (16,798) |
| Arizona: | 9.4% (207,722) |
7am:
| Tucson: | 10.2% (22,024) |
| Arizona: | 10.2% (224,484) |
7:30am:
| Tucson: | 12.7% (27,413) |
| Arizona: | 13.8% (306,057) |
8am:
| Tucson: | 15.1% (32,753) |
| Arizona: | 13.3% (293,152) |
8:30am:
| Tucson: | 9.0% (19,536) |
| Arizona: | 8.8% (194,812) |
9am:
| Tucson: | 4.6% (9,972) |
| Arizona: | 4.0% (88,904) |
10am:
| Tucson: | 5.9% (12,698) |
| Arizona: | 5.0% (109,614) |
11am:
| Tucson: | 2.7% (5,924) |
| Arizona: | 2.3% (50,098) |
12pm:
| Tucson: | 1.6% (3,378) |
| Arizona: | 1.1% (24,825) |
4pm:
| Tucson: | 8.1% (17,607) |
| Arizona: | 6.7% (148,259) |
>4pm:
| Tucson: | 7.1% (15,400) |
| Arizona: | 6.4% (140,717) |
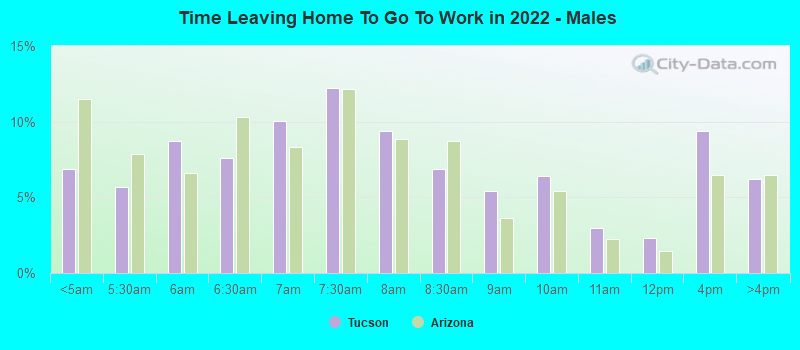
12:00 a.m. to 4:59 a.m. - Males:
| Tucson: | 6.9% (8,213) |
| Arizona: | 11.5% (176,357) |
5:00 a.m. to 5:29 a.m. - Males:
| Tucson: | 5.7% (6,786) |
| Arizona: | 7.9% (120,345) |
5:30 a.m. to 5:59 a.m. - Males:
| Tucson: | 8.7% (10,471) |
| Arizona: | 6.6% (100,978) |
6:00 a.m. to 6:29 a.m. - Males:
| Tucson: | 7.6% (9,078) |
| Arizona: | 10.3% (157,240) |
6:30 a.m. to 6:59 a.m. - Males:
| Tucson: | 10.0% (12,016) |
| Arizona: | 8.3% (127,572) |
7:00 a.m. to 7:29 a.m. - Males:
| Tucson: | 12.2% (14,627) |
| Arizona: | 12.1% (185,665) |
7:30 a.m. to 7:59 a.m. - Males:
| Tucson: | 9.4% (11,255) |
| Arizona: | 8.8% (135,322) |
8:00 a.m. to 8:29 a.m. - Males:
| Tucson: | 6.9% (8,261) |
| Arizona: | 8.7% (133,365) |
8:30 a.m. to 8:59 a.m. - Males:
| Tucson: | 5.4% (6,531) |
| Arizona: | 3.6% (55,636) |
9:00 a.m. to 9:59 a.m. - Males:
| Tucson: | 6.4% (7,645) |
| Arizona: | 5.4% (82,467) |
10:00 a.m. to 10:59 a.m. - Males:
| Tucson: | 3.0% (3,591) |
| Arizona: | 2.2% (34,272) |
11:00 a.m. to 11:59 a.m. - Males:
| Tucson: | 2.3% (2,752) |
| Arizona: | 1.5% (22,502) |
12:00 p.m. to 3:59 p.m. - Males:
| Tucson: | 9.4% (11,220) |
| Arizona: | 6.5% (99,326) |
4:00 p.m. to 11:59 p.m. - Males:
| Tucson: | 6.2% (7,414) |
| Arizona: | 6.5% (98,859) |
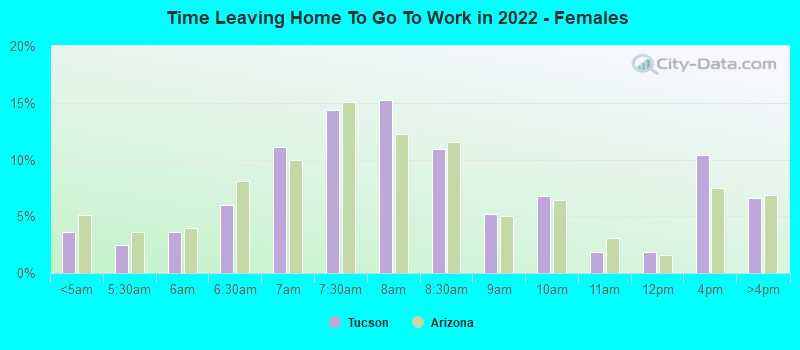
12:00 a.m. to 4:59 a.m. - Females:
| Tucson: | 3.6% (3,736) |
| Arizona: | 5.1% (62,302) |
5:00 a.m. to 5:29 a.m. - Females:
| Tucson: | 2.5% (2,526) |
| Arizona: | 3.6% (44,271) |
5:30 a.m. to 5:59 a.m. - Females:
| Tucson: | 3.6% (3,684) |
| Arizona: | 4.0% (48,333) |
6:00 a.m. to 6:29 a.m. - Females:
| Tucson: | 6.0% (6,212) |
| Arizona: | 8.1% (98,830) |
6:30 a.m. to 6:59 a.m. - Females:
| Tucson: | 11.1% (11,399) |
| Arizona: | 10.0% (121,887) |
7:00 a.m. to 7:29 a.m. - Females:
| Tucson: | 14.4% (14,799) |
| Arizona: | 15.1% (184,114) |
7:30 a.m. to 7:59 a.m. - Females:
| Tucson: | 15.2% (15,674) |
| Arizona: | 12.3% (149,844) |
8:00 a.m. to 8:29 a.m. - Females:
| Tucson: | 10.9% (11,264) |
| Arizona: | 11.5% (140,492) |
8:30 a.m. to 8:59 a.m. - Females:
| Tucson: | 5.2% (5,394) |
| Arizona: | 5.0% (61,093) |
9:00 a.m. to 9:59 a.m. - Females:
| Tucson: | 6.7% (6,946) |
| Arizona: | 6.5% (78,792) |
10:00 a.m. to 10:59 a.m. - Females:
| Tucson: | 1.8% (1,887) |
| Arizona: | 3.1% (37,384) |
11:00 a.m. to 11:59 a.m. - Females:
| Tucson: | 1.8% (1,889) |
| Arizona: | 1.6% (18,996) |
12:00 p.m. to 3:59 p.m. - Females:
| Tucson: | 10.4% (10,732) |
| Arizona: | 7.5% (91,132) |
4:00 p.m. to 11:59 p.m. - Females:
| Tucson: | 6.6% (6,808) |
| Arizona: | 6.9% (83,872) |
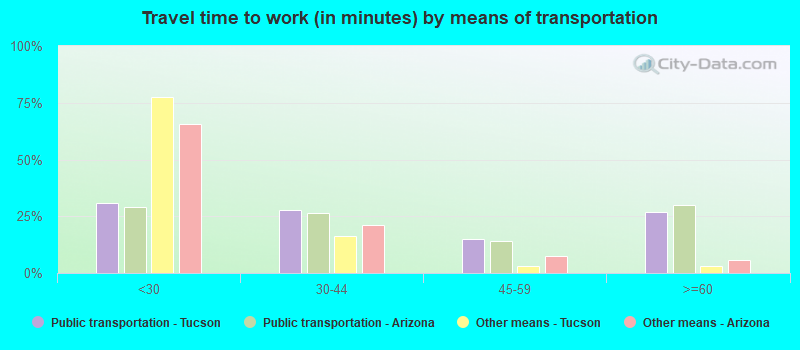
Travel time to work
Percentage of workers working in this county: 97.9%
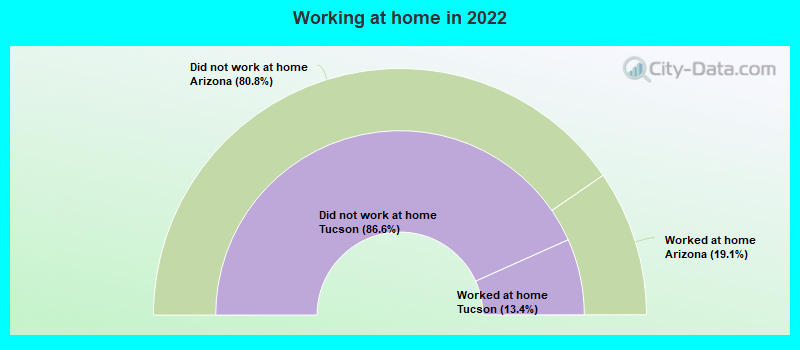
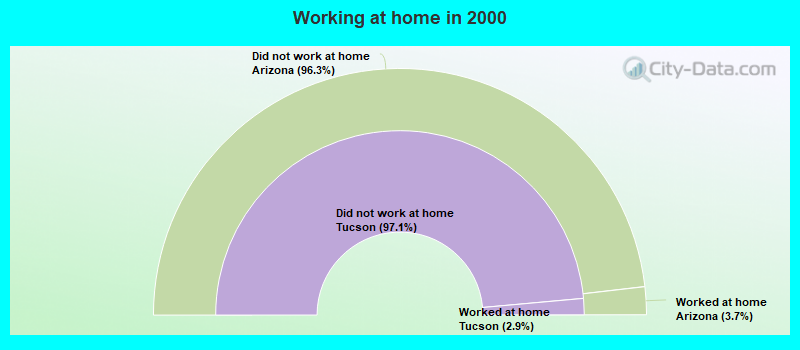
Number of people working at home: 34,383 (13.4% of all workers)
Daytime population change due to commuting: +43,454 (+8.9%)
Workers who live and work in this city: 172,709 (79.8%)
Number of people working at home: 34,383 (13.4% of all workers)
Daytime population change due to commuting: +43,454 (+8.9%)
Workers who live and work in this city: 172,709 (79.8%)

Less than 5 minutes:
| Tucson: | 2.2% (6,299) |
| Arizona: | 2.8% (76,832) |
5 to 9 minutes:
| Tucson: | 8.5% (23,812) |
| Arizona: | 9.3% (254,268) |
10 to 14 minutes:
| Tucson: | 11.2% (31,479) |
| Arizona: | 13.0% (354,212) |
15 to 19 minutes:
| Tucson: | 16.6% (46,519) |
| Arizona: | 15.5% (423,571) |
20 to 24 minutes:
| Tucson: | 17.8% (50,026) |
| Arizona: | 15.5% (422,070) |
25 to 29 minutes:
| Tucson: | 9.3% (26,257) |
| Arizona: | 7.9% (214,914) |
30 to 34 minutes:
| Tucson: | 16.9% (47,462) |
| Arizona: | 15.3% (415,851) |
35 to 39 minutes:
| Tucson: | 4.0% (11,278) |
| Arizona: | 3.3% (89,572) |
40 to 44 minutes:
| Tucson: | 3.5% (9,710) |
| Arizona: | 4.0% (108,405) |
45 to 59 minutes:
| Tucson: | 6.4% (17,862) |
| Arizona: | 7.7% (210,356) |
60 to 89 minutes:
| Tucson: | 2.5% (6,942) |
| Arizona: | 4.2% (113,557) |
90 or more minutes:
| Tucson: | 1.2% (3,422) |
| Arizona: | 1.5% (41,169) |
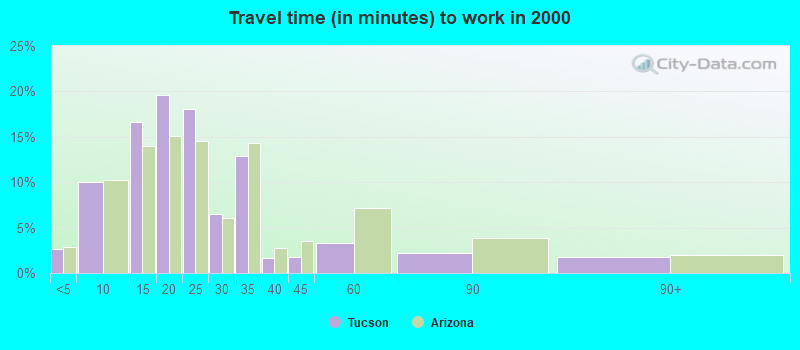
Less than 5 minutes:
| Tucson: | 2.6% (5,684) |
| Arizona: | 2.9% (64,004) |
5 to 9 minutes:
| Tucson: | 10.0% (21,715) |
| Arizona: | 10.2% (225,933) |
10 to 14 minutes:
| Tucson: | 16.7% (36,028) |
| Arizona: | 14.0% (308,552) |
15 to 19 minutes:
| Tucson: | 19.6% (42,435) |
| Arizona: | 15.1% (334,014) |
20 to 24 minutes:
| Tucson: | 18.0% (38,993) |
| Arizona: | 14.5% (320,419) |
25 to 29 minutes:
| Tucson: | 6.5% (14,113) |
| Arizona: | 6.0% (132,976) |
30 to 34 minutes:
| Tucson: | 12.9% (27,994) |
| Arizona: | 14.3% (315,678) |
35 to 39 minutes:
| Tucson: | 1.7% (3,661) |
| Arizona: | 2.8% (61,595) |
40 to 44 minutes:
| Tucson: | 1.8% (3,851) |
| Arizona: | 3.6% (78,627) |
45 to 59 minutes:
| Tucson: | 3.3% (7,171) |
| Arizona: | 7.2% (158,690) |
60 to 89 minutes:
| Tucson: | 2.2% (4,735) |
| Arizona: | 3.9% (85,177) |
90 or more minutes:
| Tucson: | 1.7% (3,694) |
| Arizona: | 2.0% (43,572) |
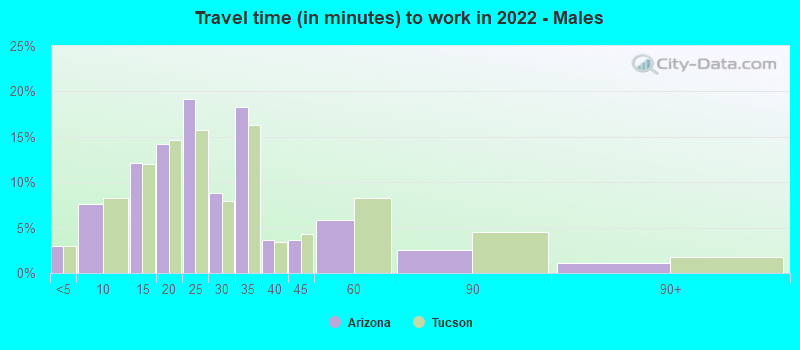
Less than 5 minutes - Males:
| Tucson: | 2.9% (4,513) |
| Arizona: | 2.9% (44,216) |
5 to 9 minutes - Males:
| Tucson: | 7.6% (11,692) |
| Arizona: | 8.2% (124,251) |
10 to 14 minutes - Males:
| Tucson: | 12.1% (18,584) |
| Arizona: | 12.0% (180,886) |
15 to 19 minutes - Males:
| Tucson: | 14.2% (21,660) |
| Arizona: | 14.6% (220,493) |
20 to 24 minutes - Males:
| Tucson: | 19.2% (29,348) |
| Arizona: | 15.8% (237,809) |
25 to 29 minutes - Males:
| Tucson: | 8.8% (13,506) |
| Arizona: | 7.9% (119,389) |
30 to 34 minutes - Males:
| Tucson: | 18.2% (27,896) |
| Arizona: | 16.3% (246,495) |
35 to 39 minutes - Males:
| Tucson: | 3.7% (5,616) |
| Arizona: | 3.5% (52,175) |
40 to 44 minutes - Males:
| Tucson: | 3.7% (5,609) |
| Arizona: | 4.3% (64,494) |
45 to 59 minutes - Males:
| Tucson: | 5.9% (9,015) |
| Arizona: | 8.2% (123,837) |
60 to 89 minutes - Males:
| Tucson: | 2.5% (3,865) |
| Arizona: | 4.5% (68,643) |
90 or more minutes - Males:
| Tucson: | 1.1% (1,708) |
| Arizona: | 1.8% (26,594) |
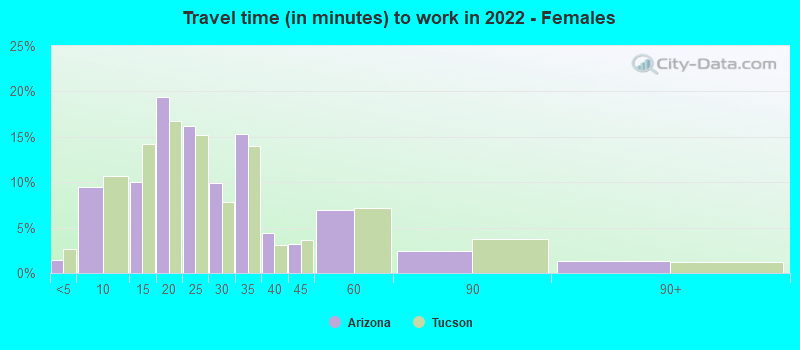
Less than 5 minutes - Females:
| Tucson: | 1.4% (1,786) |
| Arizona: | 2.7% (32,616) |
5 to 9 minutes - Females:
| Tucson: | 9.5% (12,120) |
| Arizona: | 10.7% (130,017) |
10 to 14 minutes - Females:
| Tucson: | 10.1% (12,895) |
| Arizona: | 14.3% (173,326) |
15 to 19 minutes - Females:
| Tucson: | 19.4% (24,859) |
| Arizona: | 16.7% (203,078) |
20 to 24 minutes - Females:
| Tucson: | 16.1% (20,678) |
| Arizona: | 15.2% (184,261) |
25 to 29 minutes - Females:
| Tucson: | 10.0% (12,751) |
| Arizona: | 7.9% (95,525) |
30 to 34 minutes - Females:
| Tucson: | 15.3% (19,566) |
| Arizona: | 13.9% (169,356) |
35 to 39 minutes - Females:
| Tucson: | 4.4% (5,662) |
| Arizona: | 3.1% (37,397) |
40 to 44 minutes - Females:
| Tucson: | 3.2% (4,101) |
| Arizona: | 3.6% (43,911) |
45 to 59 minutes - Females:
| Tucson: | 6.9% (8,847) |
| Arizona: | 7.1% (86,519) |
60 to 89 minutes - Females:
| Tucson: | 2.4% (3,077) |
| Arizona: | 3.7% (44,914) |
90 or more minutes - Females:
| Tucson: | 1.3% (1,714) |
| Arizona: | 1.2% (14,575) |
Means of transportation to work

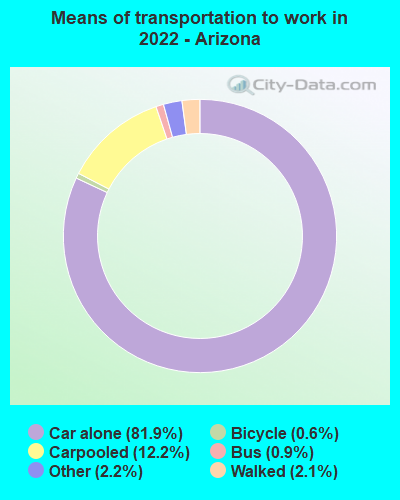
Drove car alone:
| Tucson: | 81.8% (229,902) |
| Arizona: | 81.9% (984,683) |
Carpooled:
| Tucson: | 11.2% (31,389) |
| Arizona: | 12.2% (161,249) |
Bus:
| Tucson: | 1.7% (4,675) |
| Arizona: | 0.9% (11,018) |
Subway or elevated rail:
| Tucson: | 0.0% (52) |
| Arizona: | 0.0% (664) |
Bicycle:
| Tucson: | 1.2% (3,397) |
| Arizona: | 0.6% (5,207) |
Walked:
| Tucson: | 2.7% (7,625) |
| Arizona: | 2.1% (26,321) |
Other means:
| Tucson: | 1.4% (4,028) |
| Arizona: | 2.2% (25,693) |
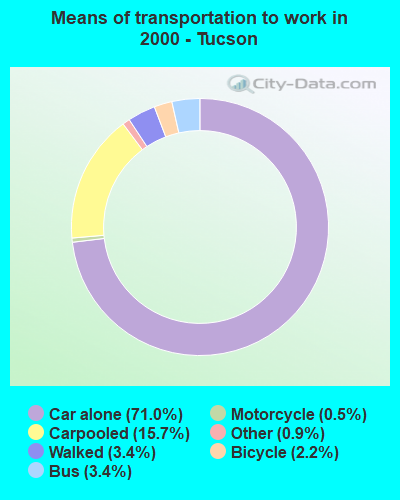
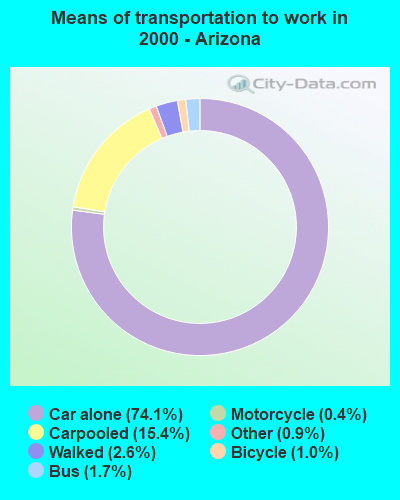
Drove car alone:
| Tucson: | 71.0% (153,493) |
| Arizona: | 74.1% (1,638,752) |
Carpooled:
| Tucson: | 15.7% (33,899) |
| Arizona: | 15.4% (340,447) |
Bus or trolley bus:
| Tucson: | 3.4% (7,257) |
| Arizona: | 1.7% (37,354) |
Streetcar or trolley car:
| Tucson: | 0.0% (60) |
| Arizona: | 0.0% (654) |
Subway or elevated:
| Tucson: | 0.0% (43) |
| Arizona: | 0.0% (459) |
Railroad:
| Tucson: | 0.0% (6) |
| Arizona: | 0.0% (467) |
Ferryboat:
| Tucson: | 0.0% (10) |
| Arizona: | 0.0% (170) |
Taxicab:
| Tucson: | 0.1% (154) |
| Arizona: | 0.1% (2,001) |
Motorcycle:
| Tucson: | 0.5% (1,010) |
| Arizona: | 0.4% (8,569) |
Bicycle:
| Tucson: | 2.2% (4,791) |
| Arizona: | 1.0% (22,209) |
Walked:
| Tucson: | 3.4% (7,438) |
| Arizona: | 2.6% (58,015) |
Other means:
| Tucson: | 0.9% (1,913) |
| Arizona: | 0.9% (20,140) |
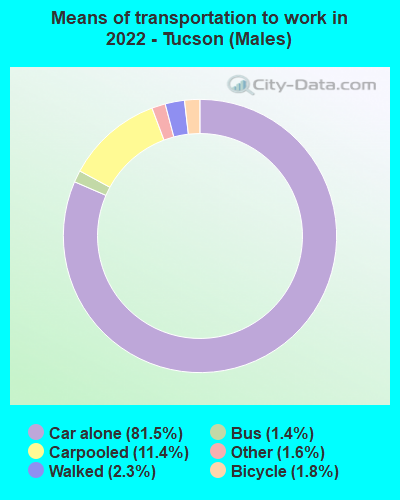
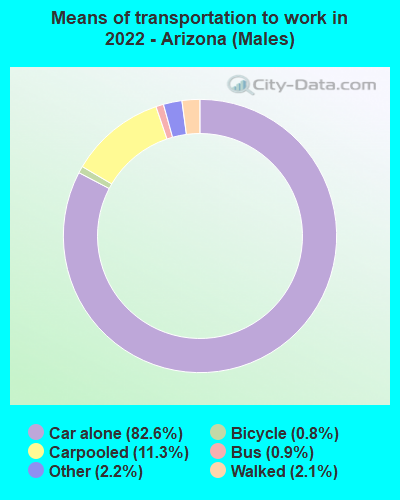
Drove car alone - Males:
| Tucson: | 81.5% (124,726) |
| Arizona: | 82.6% (984,683) |
Carpooled - Males:
| Tucson: | 11.4% (17,450) |
| Arizona: | 11.3% (161,249) |
Bus - Males:
| Tucson: | 1.4% (2,218) |
| Arizona: | 0.9% (11,018) |
Bicycle - Males:
| Tucson: | 1.8% (2,712) |
| Arizona: | 0.8% (5,207) |
Walked - Males:
| Tucson: | 2.3% (3,446) |
| Arizona: | 2.1% (26,321) |
Other means - Males:
| Tucson: | 1.6% (2,460) |
| Arizona: | 2.2% (25,693) |
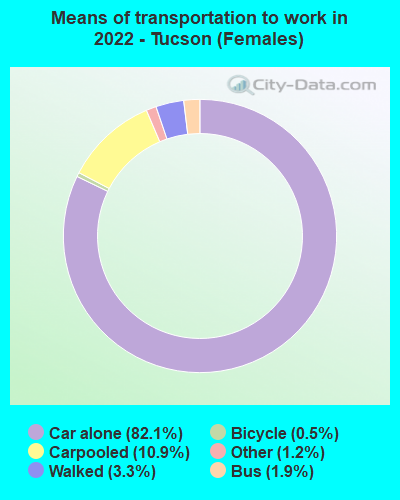
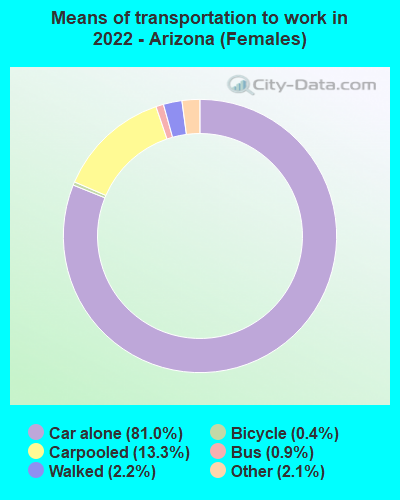
Drove car alone - Females:
| Tucson: | 82.1% (105,176) |
| Arizona: | 81.0% (984,683) |
Carpooled - Females:
| Tucson: | 10.9% (13,939) |
| Arizona: | 13.3% (161,249) |
Bus - Females:
| Tucson: | 1.9% (2,457) |
| Arizona: | 0.9% (11,018) |
Subway or elevated rail - Females:
| Tucson: | 0.0% (52) |
| Arizona: | 0.1% (664) |
Bicycle - Females:
| Tucson: | 0.5% (685) |
| Arizona: | 0.4% (5,207) |
Walked - Females:
| Tucson: | 3.3% (4,179) |
| Arizona: | 2.2% (26,321) |
Other means - Females:
| Tucson: | 1.2% (1,568) |
| Arizona: | 2.1% (25,693) |
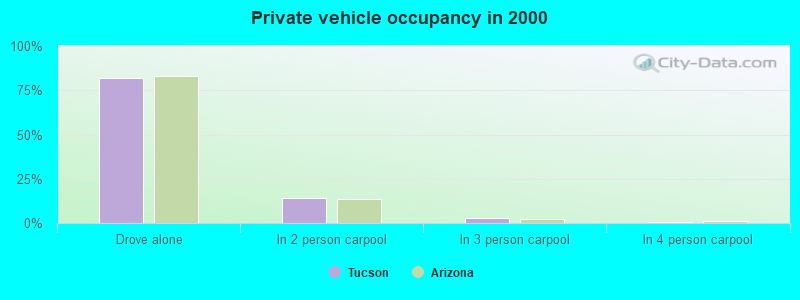
Private vehicle occupancy
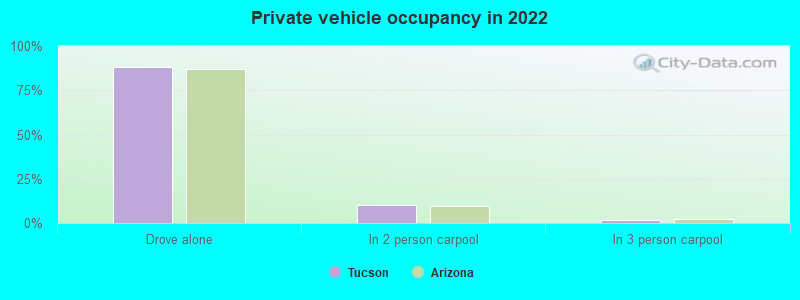
Drove alone:
| Tucson: | 88.0% (178,725) |
| Arizona: | 87.1% (2,249,618) |
In 2 person carpool:
| Tucson: | 9.9% (20,121) |
| Arizona: | 9.6% (248,016) |
In 3 person carpool:
| Tucson: | 1.6% (3,273) |
| Arizona: | 2.1% (53,152) |
In 4 person carpool:
| Tucson: | 0.3% (553) |
| Arizona: | 0.7% (18,165) |
In 5-6 person carpool:
| Tucson: | 0.2% (411) |
| Arizona: | 0.4% (11,360) |
In 7+ person carpool:
| Tucson: | 0.1% (113) |
| Arizona: | 0.1% (3,800) |
Drove alone:
| Tucson: | 81.9% (153,493) |
| Arizona: | 82.8% (1,638,752) |
In 2 person carpool:
| Tucson: | 14.0% (26,221) |
| Arizona: | 13.3% (263,536) |
In 3 person carpool:
| Tucson: | 2.6% (4,949) |
| Arizona: | 2.4% (47,418) |
In 4 person carpool:
| Tucson: | 0.8% (1,534) |
| Arizona: | 0.8% (16,752) |
In 5-6 person carpool:
| Tucson: | 0.4% (802) |
| Arizona: | 0.5% (8,993) |
In 7+ person carpool:
| Tucson: | 0.2% (393) |
| Arizona: | 0.2% (3,748) |
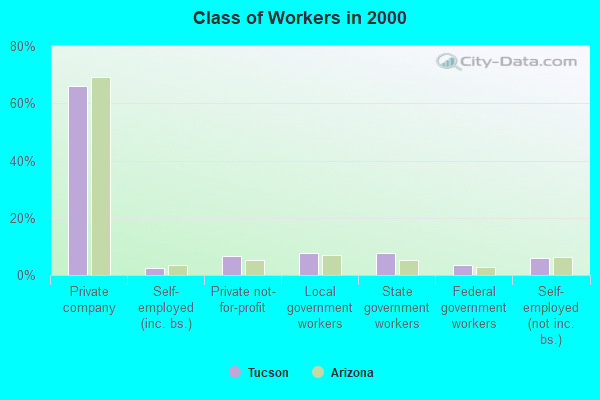
Class of workers

Employee of private company:
| Tucson: | 66.0% (169,387) |
| Arizona: | 69.3% (2,383,933) |
Self-employed in own incorporated business:
| Tucson: | 3.9% (9,877) |
| Arizona: | 4.1% (141,657) |
Private not-for-profit wage and salary workers:
| Tucson: | 7.9% (20,222) |
| Arizona: | 7.0% (239,758) |
Local government workers:
| Tucson: | 6.3% (16,122) |
| Arizona: | 6.6% (228,494) |
State government workers:
| Tucson: | 6.4% (16,337) |
| Arizona: | 4.3% (149,309) |
Federal government workers:
| Tucson: | 4.3% (11,024) |
| Arizona: | 2.7% (91,276) |
Self-employed workers in own not incorporated business:
| Tucson: | 5.1% (12,966) |
| Arizona: | 5.8% (199,501) |
Unpaid family workers:
| Tucson: | 0.2% (563) |
| Arizona: | 0.2% (7,748) |
Employee of private company:
| Tucson: | 65.9% (142,293) |
| Arizona: | 69.3% (1,546,865) |
Self-employed in own incorporated business:
| Tucson: | 2.4% (5,224) |
| Arizona: | 3.5% (77,314) |
Private not-for-profit wage and salary workers:
| Tucson: | 6.8% (14,630) |
| Arizona: | 5.4% (119,598) |
Local government workers:
| Tucson: | 7.5% (16,297) |
| Arizona: | 6.9% (155,187) |
State government workers:
| Tucson: | 7.8% (16,879) |
| Arizona: | 5.3% (119,292) |
Federal government workers:
| Tucson: | 3.5% (7,614) |
| Arizona: | 2.9% (65,075) |
Self-employed workers in own not incorporated business:
| Tucson: | 5.8% (12,598) |
| Arizona: | 6.4% (143,564) |
Unpaid family workers:
| Tucson: | 0.2% (471) |
| Arizona: | 0.3% (6,109) |
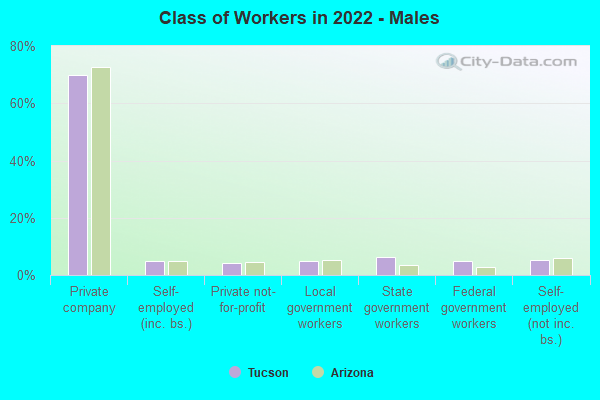
Employee of private company - Males:
| Tucson: | 69.8% (92,169) |
| Arizona: | 72.5% (1,346,166) |
Self-employed in own incorporated business - Males:
| Tucson: | 4.7% (6,238) |
| Arizona: | 5.0% (92,967) |
Private not-for-profit wage and salary workers - Males:
| Tucson: | 4.2% (5,568) |
| Arizona: | 4.7% (86,909) |
Local government workers - Males:
| Tucson: | 4.8% (6,329) |
| Arizona: | 5.3% (98,091) |
State government workers - Males:
| Tucson: | 6.2% (8,185) |
| Arizona: | 3.4% (63,497) |
Federal government workers - Males:
| Tucson: | 4.7% (6,265) |
| Arizona: | 2.9% (53,017) |
Self-employed workers in own not incorporated business - Males:
| Tucson: | 5.3% (6,988) |
| Arizona: | 6.0% (111,844) |
Unpaid family workers - Males:
| Tucson: | 0.2% (318) |
| Arizona: | 0.2% (3,295) |
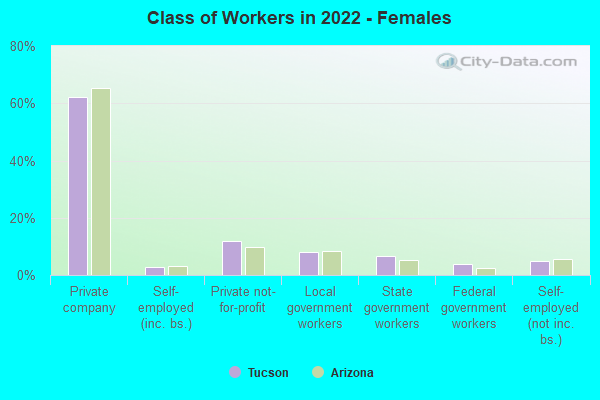
Employee of private company - Females:
| Tucson: | 62.1% (77,218) |
| Arizona: | 65.4% (1,037,767) |
Self-employed in own incorporated business - Females:
| Tucson: | 2.9% (3,639) |
| Arizona: | 3.1% (48,690) |
Private not-for-profit wage and salary workers - Females:
| Tucson: | 11.8% (14,654) |
| Arizona: | 9.6% (152,849) |
Local government workers - Females:
| Tucson: | 7.9% (9,793) |
| Arizona: | 8.2% (130,403) |
State government workers - Females:
| Tucson: | 6.6% (8,152) |
| Arizona: | 5.4% (85,812) |
Federal government workers - Females:
| Tucson: | 3.8% (4,759) |
| Arizona: | 2.4% (38,259) |
Self-employed workers in own not incorporated business - Females:
| Tucson: | 4.8% (5,978) |
| Arizona: | 5.5% (87,657) |
Unpaid family workers - Females:
| Tucson: | 0.2% (245) |
| Arizona: | 0.3% (4,453) |