Estimated zip code population in 2022: 28,673 Zip code population in 2010: 27,003 Zip code population in 2000: 26,062
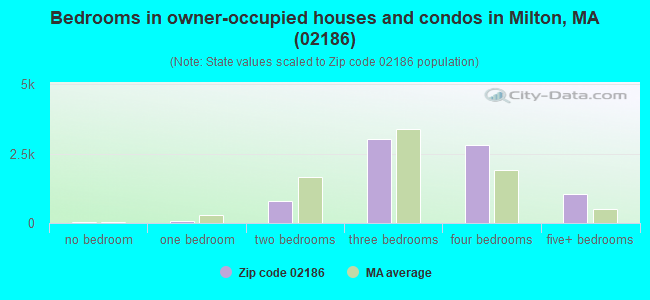
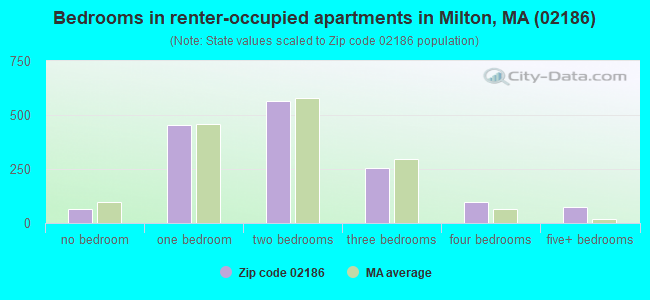
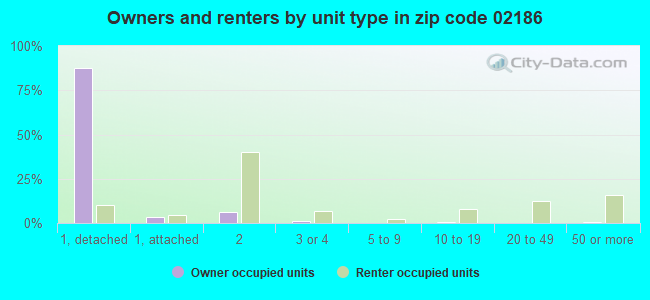
Houses and condos: 9,622 Renter-occupied apartments: 1,517
% of renters here:
16%
State:
38%
March 2022 cost of living index in zip code 02186: 133.4 (high, U.S. average is 100)
Land area: 13.0 sq. mi. Water area: 0.3 sq. mi.
Population density: 2,204 people per square mile
(low).
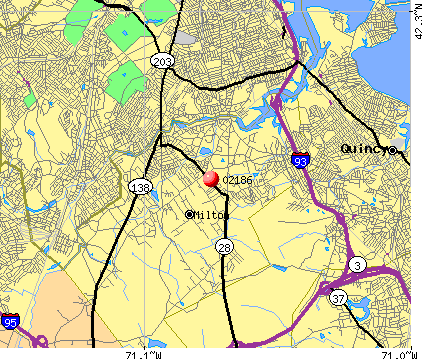
OSM Map
Google Map
MSN Map
OSM Map
General Map
Google Map
MSN Map
OSM Map
Google Map
MSN Map
OSM Map
Google Map
MSN Map
Please wait while loading the map...
Real estate property taxes paid for housing units in 2022:
This zip code:
0.9% ($8,790)
Massachusetts:
1.0% ($5,536)
Median real estate property taxes paid for housing units with mortgages in 2022: $8,729 (0.9%) Median real estate property taxes paid for housing units with no mortgage in 2022: $8,944 (1.2%)
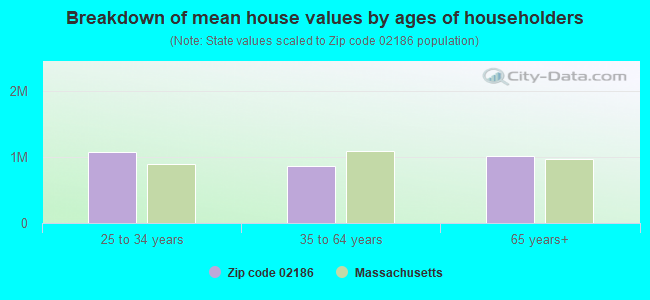
Estimated median house/condo value in 2022: $926,084
02186:
$926,084
Massachusetts:
$534,700
According to our research of Massachusetts and other state lists, there was 1 registered sex offender living in 02186 zip code as of April 27, 2024. The ratio of all residents to sex offenders in zip code 02186 is 27,743 to 1. The ratio of registered sex offenders to all residents in this zip code is much lower than the state average.
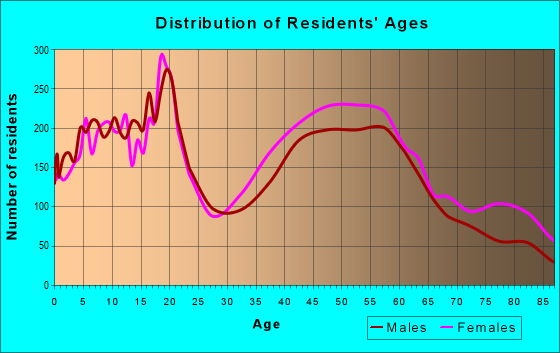
Median resident age:
This zip code:
40.5 years
Massachusetts median age:
40.3 years
Average household size:
This zip code:
2.9 people
Massachusetts:
2.4 people
Averages for the 2020 tax year for zip code 02186, filed in 2021:
Average Adjusted Gross Income (AGI) in 2020: $176,875 (Individual Income Tax Returns)
Here:
$176,875
State:
$105,130
Salary/wage: $142,137 (reported on 79.5% of returns)
Here:
$142,137
State:
$82,951
(% of AGI for various income ranges: 1129.5% for AGIs below $25k, 3660.8% for AGIs $25k-50k, 6404.7% for AGIs $50k-75k, 9639.1% for AGIs $75k-100k, 20900.9% for AGIs $100k-200k, 117394.2% for AGIs over 200k)
Taxable interest for individuals: $2,618 (reported on 48.7% of returns)
This zip code:
$2,618
Massachusetts:
$2,361
(% of AGI for various income ranges: 31.2% for AGIs below $25k, 57.9% for AGIs $25k-50k, 89.7% for AGIs $50k-75k, 135.4% for AGIs $75k-100k, 170.1% for AGIs $100k-200k, 1332.9% for AGIs over 200k)
Ordinary dividends: $9,163 (reported on 38.9% of returns)
Here:
$9,163
State:
$10,365
(% of AGI for various income ranges: 72.1% for AGIs below $25k, 126.4% for AGIs $25k-50k, 233.5% for AGIs $50k-75k, 337.7% for AGIs $75k-100k, 529.2% for AGIs $100k-200k, 3767.5% for AGIs over 200k)
Net capital gain/loss in AGI: +$61,216 (reported on 34.8% of returns)
Here:
+$61,216
State:
+$48,178
(% of AGI for various income ranges: 40.8% for AGIs below $25k, 95.9% for AGIs $25k-50k, 192.6% for AGIs $50k-75k, 253.3% for AGIs $75k-100k, 876.5% for AGIs $100k-200k, 30293.0% for AGIs over 200k)
Profit/loss from business: +$35,731 (reported on 18.9% of returns)
Here:
+$35,731
State:
+$20,792
(% of AGI for various income ranges: 110.1% for AGIs below $25k, 244.4% for AGIs $25k-50k, 328.8% for AGIs $50k-75k, 647.8% for AGIs $75k-100k, 1081.8% for AGIs $100k-200k, 7182.5% for AGIs over 200k)
Taxable individual retirement arrangement distribution: $27,799 (reported on 12.1% of returns)
02186:
$27,799
Massachusetts:
$22,790
(% of AGI for various income ranges: 80.9% for AGIs below $25k, 138.7% for AGIs $25k-50k, 348.9% for AGIs $50k-75k, 586.8% for AGIs $75k-100k, 1034.9% for AGIs $100k-200k, 2329.3% for AGIs over 200k)
Self-employed (Keogh) retirement plans: $29,750 (reported on 2.7% of returns)
02186:
$29,750
Massachusetts:
$26,868
(% of AGI for various income ranges: 30.5% for AGIs $50k-75k, 55.2% for AGIs $100k-200k, 1085.6% for AGIs over 200k)
Total itemized deductions: $38,499 (reported on 26.6% of returns)
Here:
$38,499
State:
$36,722
(% of AGI for various income ranges: 205.7% for AGIs below $25k, 350.9% for AGIs $25k-50k, 659.3% for AGIs $50k-75k, 1154.2% for AGIs $75k-100k, 2085.8% for AGIs $100k-200k, 9815.4% for AGIs over 200k)
Charity contributions: $12,716 (reported on 22.4% of returns)
Here:
$12,716
State:
$12,529
(% of AGI for various income ranges: 9.7% for AGIs below $25k, 34.6% for AGIs $25k-50k, 74.9% for AGIs $50k-75k, 189.7% for AGIs $75k-100k, 262.9% for AGIs $100k-200k, 3616.1% for AGIs over 200k)
Taxes paid: $9,429 (reported on 26.5% of returns)
02186:
$9,429
State:
$8,782
(% of AGI for various income ranges: 46.6% for AGIs below $25k, 86.7% for AGIs $25k-50k, 209.8% for AGIs $50k-75k, 397.1% for AGIs $75k-100k, 672.2% for AGIs $100k-200k, 2008.5% for AGIs over 200k)
Earned income credit: $1,643 (reported on 4.7% of returns)
Here:
$1,643
State:
$1,909
(% of AGI for various income ranges: 39.3% for AGIs below $25k, 34.5% for AGIs $25k-50k)
Percentage of individuals using paid preparers for their 2020 taxes: 91.3%
Here:
91%
State:
92%
(% for various income ranges: 89.1% for AGIs below $25k, 89.8% for AGIs $25k-50k, 89.9% for AGIs $50k-75k, 90.9% for AGIs $75k-100k, 92.2% for AGIs $100k-200k, 94.3% for AGIs over 200k)
Averages for the 2012 tax year for zip code 02186, filed in 2013:
Average Adjusted Gross Income (AGI) in 2012: $164,337 (Individual Income Tax Returns)
Here:
$164,337
State:
$81,425
Salary/wage: $103,780 (reported on 81.0% of returns)
Here:
$103,780
State:
$64,752
(% of AGI for various income ranges: 68.9% for AGIs below $25k, 71.0% for AGIs $25k-50k, 67.6% for AGIs $50k-75k, 69.5% for AGIs $75k-100k, 78.3% for AGIs $100k-200k, 39.5% for AGIs over 200k)
Taxable interest for individuals: $7,474 (reported on 53.7% of returns)
This zip code:
$7,474
Massachusetts:
$2,136
(% of AGI for various income ranges: 2.3% for AGIs below $25k, 1.3% for AGIs $25k-50k, 1.0% for AGIs $50k-75k, 1.0% for AGIs $75k-100k, 0.7% for AGIs $100k-200k, 3.2% for AGIs over 200k)
Ordinary dividends: $12,996 (reported on 36.7% of returns)
Here:
$12,996
State:
$9,473
(% of AGI for various income ranges: 3.7% for AGIs below $25k, 2.3% for AGIs $25k-50k, 2.1% for AGIs $50k-75k, 2.4% for AGIs $75k-100k, 1.8% for AGIs $100k-200k, 3.3% for AGIs over 200k)
Net capital gain/loss in AGI: +$65,141 (reported on 29.4% of returns)
Here:
+$65,141
State:
+$31,437
(% of AGI for various income ranges: 0.6% for AGIs $25k-50k, 0.6% for AGIs $50k-75k, 1.2% for AGIs $75k-100k, 1.3% for AGIs $100k-200k, 17.0% for AGIs over 200k)
Profit/loss from business: +$32,725 (reported on 17.7% of returns)
Here:
+$32,725
State:
+$20,662
(% of AGI for various income ranges: 7.5% for AGIs below $25k, 5.3% for AGIs $25k-50k, 5.2% for AGIs $50k-75k, 4.6% for AGIs $75k-100k, 4.1% for AGIs $100k-200k, 3.0% for AGIs over 200k)
Taxable individual retirement arrangement distribution: $22,117 (reported on 13.3% of returns)
02186:
$22,117
Massachusetts:
$18,892
(% of AGI for various income ranges: 3.9% for AGIs below $25k, 3.2% for AGIs $25k-50k, 3.8% for AGIs $50k-75k, 3.8% for AGIs $75k-100k, 2.8% for AGIs $100k-200k, 1.1% for AGIs over 200k)
Self-employment retirement plans: $26,424 (reported on 2.5% of returns)
02186:
$26,424
Massachusetts:
$20,669
(% of AGI for various income ranges: 0.5% for AGIs $25k-50k, 0.2% for AGIs $75k-100k, 0.3% for AGIs $100k-200k, 0.5% for AGIs over 200k)
Total itemized deductions: $44,830 (16% of AGI, reported on 54.7% of returns)
Here:
$44,830
State:
$28,907
Here:
16.4% of AGI
State:
18.2% of AGI
(% of AGI for various income ranges: 17.8% for AGIs below $25k, 14.4% for AGIs $25k-50k, 17.5% for AGIs $50k-75k, 18.8% for AGIs $75k-100k, 18.6% for AGIs $100k-200k, 13.4% for AGIs over 200k)
Charity contributions: $8,838 (reported on 48.7% of returns)
Here:
$8,838
State:
$4,208
(% of AGI for various income ranges: 1.1% for AGIs below $25k, 1.3% for AGIs $25k-50k, 1.6% for AGIs $50k-75k, 1.8% for AGIs $75k-100k, 1.5% for AGIs $100k-200k, 3.2% for AGIs over 200k)
Taxes paid: $20,957 (reported on 54.7% of returns)
02186:
$20,957
State:
$13,303
(% of AGI for various income ranges: 6.2% for AGIs below $25k, 5.3% for AGIs $25k-50k, 7.1% for AGIs $50k-75k, 8.4% for AGIs $75k-100k, 9.0% for AGIs $100k-200k, 6.4% for AGIs over 200k)
Earned income credit: $1,763 (reported on 6.2% of returns)
Here:
$1,763
State:
$1,971
(% of AGI for various income ranges: 2.7% for AGIs below $25k, 0.6% for AGIs $25k-50k)
Percentage of individuals using paid preparers for their 2012 taxes: 62.3%
Here:
62%
State:
56%
(% for various income ranges: 55.3% for AGIs below $25k, 58.5% for AGIs $25k-50k, 62.7% for AGIs $50k-75k, 62.7% for AGIs $75k-100k, 65.1% for AGIs $100k-200k, 75.1% for AGIs over 200k)
Averages for the 2004 tax year for zip code 02186, filed in 2005:
Average Adjusted Gross Income (AGI) in 2004: $102,271 (Individual Income Tax Returns)
Here:
$102,271
State:
$62,877
Salary/wage: $82,793 (reported on 78.4% of returns)
Here:
$82,793
State:
$52,969
(% of AGI for various income ranges: 192.5% for AGIs below $10k, 56.7% for AGIs $10k-25k, 71.1% for AGIs $25k-50k, 71.0% for AGIs $50k-75k, 75.6% for AGIs $75k-100k, 60.2% for AGIs over 100k)
Taxable interest for individuals: $2,988 (reported on 67.6% of returns)
This zip code:
$2,988
Massachusetts:
$1,945
(% of AGI for various income ranges: 17.2% for AGIs below $10k, 6.0% for AGIs $10k-25k, 2.8% for AGIs $25k-50k, 2.1% for AGIs $50k-75k, 1.7% for AGIs $75k-100k, 1.7% for AGIs over 100k)
Taxable dividends: $5,001 (reported on 44.8% of returns)
Here:
$5,001
State:
$5,323
(% of AGI for various income ranges: 19.3% for AGIs below $10k, 3.9% for AGIs $10k-25k, 2.1% for AGIs $25k-50k, 2.4% for AGIs $50k-75k, 1.6% for AGIs $75k-100k, 2.1% for AGIs over 100k)
Net capital gain/loss: +$20,207 (reported on 36.3% of returns)
Here:
+$20,207
State:
+$20,377
(% of AGI for various income ranges: -6.0% for AGIs below $10k, 0.6% for AGIs $10k-25k, 0.9% for AGIs $25k-50k, 1.0% for AGIs $50k-75k, 1.1% for AGIs $75k-100k, 9.4% for AGIs over 100k)
Profit/loss from business: +$25,057 (reported on 17.3% of returns)
Here:
+$25,057
State:
+$17,837
(% of AGI for various income ranges: -3.9% for AGIs below $10k, 6.7% for AGIs $10k-25k, 4.6% for AGIs $25k-50k, 4.5% for AGIs $50k-75k, 5.3% for AGIs $75k-100k, 4.0% for AGIs over 100k)
IRA payment deduction: $3,314 (reported on 2.8% of returns)
02186:
$3,314
Massachusetts:
$3,100
(% of AGI for various income ranges: 0.3% for AGIs $10k-25k, 0.3% for AGIs $25k-50k, 0.2% for AGIs $50k-75k, 0.1% for AGIs $75k-100k, 0.0% for AGIs over 100k)
Self-employed pension: $17,105 (reported on 3.0% of returns)
Here:
$17,105
Massachusetts:
$14,516
(% of AGI for various income ranges: 0.2% for AGIs $25k-50k, 0.2% for AGIs $50k-75k, 0.3% for AGIs $75k-100k, 0.6% for AGIs over 100k)
Total itemized deductions: $31,339 (19% of AGI, reported on 53.9% of returns)
Here:
$31,339
State:
$22,573
Here:
18.6% of AGI
State:
19.5% of AGI
(% of AGI for various income ranges: 47.5% for AGIs below $10k, 22.1% for AGIs $10k-25k, 17.2% for AGIs $25k-50k, 20.9% for AGIs $50k-75k, 20.7% for AGIs $75k-100k, 15.2% for AGIs over 100k)
Charity contributions deductions: $4,153 (3% of AGI, reported on 50.4% of returns)
Here:
$4,153
State:
$3,295
Here:
2.6% of AGI
State:
2.7% of AGI
(% of AGI for various income ranges: 2.1% for AGIs below $10k, 2.0% for AGIs $10k-25k, 2.0% for AGIs $25k-50k, 2.5% for AGIs $50k-75k, 2.1% for AGIs $75k-100k, 2.0% for AGIs over 100k)
Total tax: $21,852 (reported on 82.5% of returns)
02186:
$21,852
State:
$11,494
(% of AGI for various income ranges: 7.2% for AGIs below $10k, 4.9% for AGIs $10k-25k, 8.2% for AGIs $25k-50k, 10.0% for AGIs $50k-75k, 10.7% for AGIs $75k-100k, 20.6% for AGIs over 100k)
Earned income credit: $1,433 (reported on 4.3% of returns)
Here:
$1,433
State:
$1,518
Percentage of individuals using paid preparers for their 2004 taxes: 63.0%
Here:
63%
State:
58%
(% for various income ranges: 55.7% for AGIs below $10k, 60.9% for AGIs $10k-25k, 58.8% for AGIs $25k-50k, 66.6% for AGIs $50k-75k, 66.1% for AGIs $75k-100k, 69.5% for AGIs over 100k)
Likely homosexual households (counted as self-reported same-sex unmarried-partner households)
Lesbian couples: 0.1% of all households
Gay men: 0.2% of all households
Household received Food Stamps/SNAP in the past 12 months: 509 Household did not receive Food Stamps/SNAP in the past 12 months: 8,688
Women who had a birth in the past 12 months: 296 (312 now married, 0 unmarried) Women who did not have a birth in the past 12 months: 6,547 (2,695 now married, 3,833 unmarried)
Housing units in zip code 02186 with a mortgage: 5,677 (1,226 second mortgage, 63 home equity loan, 1,045 both second mortgage and home equity loan) Houses without a mortgage: 102
Median monthly owner costs for units with a mortgage: $3,533 Median monthly owner costs for units without a mortgage: $1,310
Residents with income below the poverty level in 2022:
This zip code:
6.5%
Whole state:
10.4%
Residents with income below 50% of the poverty level in 2022:
This zip code:
3.7%
Whole state:
5.1%
Median number of rooms in houses and condos:
Here:
7.4
State:
6.5
Median number of rooms in apartments:
Here:
4.3
State:
4.0
Notable locations in this zip code not listed on our city pages
Notable locations in zip code 02186: Presidents Golf Course (A), Milton Fire Department Station 2 (B), Milton Fire Department Station 1 Headquarters (C), Milton Fire Department Station 4 (D), Fontbonne Academy Library (E), Cox Library (F), Forbes House Museum (G), Levin Library (H), Louis R Levin Memorial Library (I), Milton Public Library (J), Museum of American China Trade (K). Display/hide their locations on the map
Churches in zip code 02186 include: Trinity Episcopal Church (A), Saint Pius X Church (B), Saint Michaels Episcopal Church (C), Saint Mary of the Hills Church (D), Saint Elizabeth Church (E), Saint Agathas Convent (F), Parkway United Methodist Church (G), Mattapan Baptist Church (H), First Parish in Milton Church (I). Display/hide their locations on the map
Lakes, reservoirs, and swamps: Hemenway Pond (A), Hillside Pond (B), Houghtons Pond (C), Popes Pond (D), Turners Pond (E), Pine Tree Brook Reservoir (F), Neponset River Reservoir (G), Neponset River Marshes (H). Display/hide their locations on the map
Streams, rivers, and creeks: Unquity Brook (A), Trout Brook (B), Pine Tree Brook (C), Balster Brook (D), Chestnut Run (E), Coon Hollow Brook (F). Display/hide their locations on the map
5,576 married couples with children.
996 single-parent households (209 men, 787 women).
80.2% of residents of 02186 zip code speak English at home.
2.5% of residents speak Spanish at home (85% very well, 15% well).
11.5% of residents speak other Indo-European language at home (79% very well, 15% well, 5% not well, 1% not at all).
3.9% of residents speak Asian or Pacific Island language at home (70% very well, 19% well, 8% not well, 4% not at all).
1.2% of residents speak other language at home (78% very well, 20% well, 2% not at all).
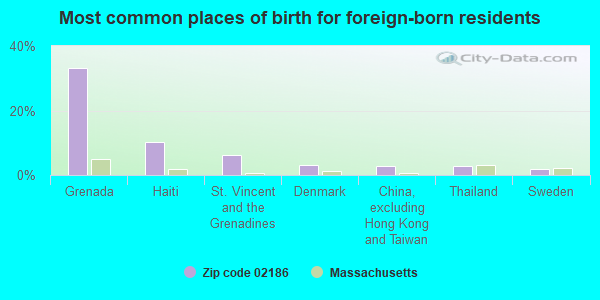
Foreign born population: 4,662 (16.3%) (64.6% of them are naturalized citizens)
This zip code:
16.3%
Whole state:
18.0%
33%Grenada
10%Haiti
6%St. Vincent and the Grenadines
3%Denmark
3%China, excluding Hong Kong and Taiwan
3%Thailand
2%Sweden
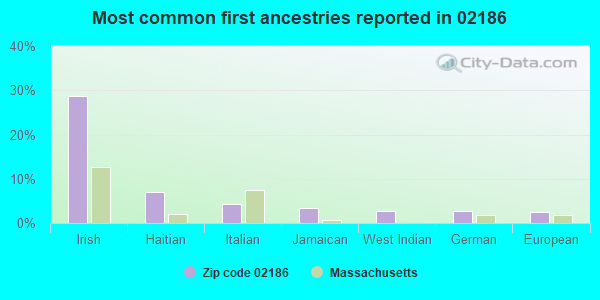
29%Irish
7%Haitian
4%Italian
3%Jamaican
3%West Indian
3%German
3%European
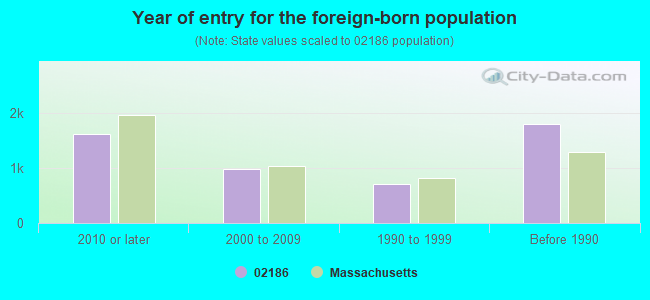
Year of entry for the foreign-born population
1,6192010 or later
9742000 to 2009
7121990 to 1999
1,784Before 1990
Major facilities with environmental interests located in this zip code:
MILTON HIGH SCHOOL (25 GILE RD in MILTON, MA)
AIR MINOR (AIRS/AFS) STATE MASTER (MA-EPICS) - NEI-1192020, CRITERIA AND HAZARDOUS AIR POLLUTANT INVENTORY, AIR PROGRAM (National Center for Education Statistics) - STATE ID-189410 Business SIC classification: ELEMENTARY AND SECONDARY SCHOOLS Alternative names: CHARLES S PIERCE MIDDLE, PIERCE JR HIGH SCH, PIERCE MIDDLE SCHOOL
COLLICOT (80 EDGE HILL RD in MILTON, MA)
(National Center for Education Statistics) - STATE ID-189005 Organizations: MILTON (SCHOOL DISTRICT)
MILTON HIGH (451 CENTRAL AVENUE in MILTON, MA)
(National Center for Education Statistics) - STATE ID-189505
NAZZAROS EXXON (310 GRANITE AVE in MILTON, MA)
Small Quantity Generators, between 100 kg and 1000 kg of hazardous waste/month (Resource Conservation and Recovery Act (tracking hazardous waste)) - notification HAZARDOUS WASTE BIENNIAL REPORTER (Resource Conservation and Recovery Act (tracking hazardous waste)) (Resource Conservation and Recovery Act (tracking hazardous waste)) Organizations: TOSCO CORP (CONTACT/OPERATOR)
, WILLIAM NAZZARO (CONTACT/OWNER)
, EXXON MOBIL (CONTACT/OWNER)
Alternative names: EXXON RAS 35505
AQUINAS JUNIOR COLLEGE (303 ADAMS STREET in MILTON, MA)
AIR MINOR (AIRS/AFS) CRITERIA AND HAZARDOUS AIR POLLUTANT INVENTORY (Inventory of air pollution sources) Business SIC classification: ELEMENTARY AND SECONDARY SCHOOLS; JUNIOR COLLEGES AND TECHNICAL INSTITUTES Alternative names: AQUINAS COL @ MILTON, AQUINAS COLLEGE, AQUINAS JR.COLLEGE
MILTON HOSPITAL (92 HIGHLAND STREET in MILTON, MA)
AIR SYNTHETIC MINOR (AIRS/AFS) CRITERIA AND HAZARDOUS AIR POLLUTANT INVENTORY (Inventory of air pollution sources) Small Quantity Generators, between 100 kg and 1000 kg of hazardous waste/month (Resource Conservation and Recovery Act (tracking hazardous waste)) - notification Business SIC classification: GENERAL MEDICAL AND SURGICAL HOSPITALS
MILTON TOWN OF PUBLIC WORKS DEPT PUMPING STATION (ADDRESS NOT IN PCS in MILTON, MA)
National Pollutant Discharge Elimination System NON-MAJOR (Tracking pollutant discharge elimination systems) - permit Business SIC classification: SEWERAGE SYSTEMS Alternative names: MILTON TOWN OF (PUMPING STA)
MILTON MEDICAL LAB INC (75 ADAMS ST in MILTON, MA)
(Resource Conservation and Recovery Act (tracking hazardous waste))
MILTON SHELL (11 BRYANT AVE in MILTON, MA)
(Resource Conservation and Recovery Act (tracking hazardous waste)) Organizations: HEIDIMARINE SERVICE CORP (CONTACT/OWNER)
NEW ENGLAND TELE (114 ADAMS ST in MILTON, MA)
(Resource Conservation and Recovery Act (tracking hazardous waste))
MA HIGHWAY DEPARTMENT (73 GRANITE AVE in MILTON, MA)
Conditionally Exempt Small Quantity Generators, less than 100 kg/month of hazardous waste (Resource Conservation and Recovery Act (tracking hazardous waste)) - notification Organizations: COMM OF MASS (CONTACT/OWNER)
Alternative names: COMM OF MASS DPW, MA DEPARTMENT OF PUBLIC WORKS
MILTON (TOWN OF MILTON in MILTON, MA)
AIR MINOR (AIRS/AFS) Business SIC classification: GENERAL GOVERNMENT
MILTON SCHOOL DEPT (381 CENTRE STREET in MILTON, MA)
AIR MINOR (AIRS/AFS) Business SIC classification: ELEMENTARY AND SECONDARY SCHOOLS
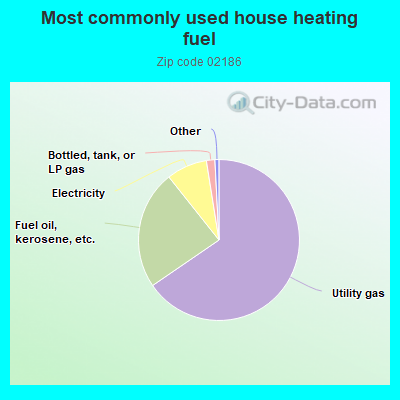
65.5%Utility gas
23.9%Fuel oil, kerosene, etc.
8.2%Electricity
1.7%Bottled, tank, or LP gas
Population in 1990: 25,558. Population change in the 1990s: +504 (+2.0%).
Place of birth for U.S.-born residents:
This state: 17,242
Northeast: 3,417
Midwest: 1,057
South: 1,054
West: 743
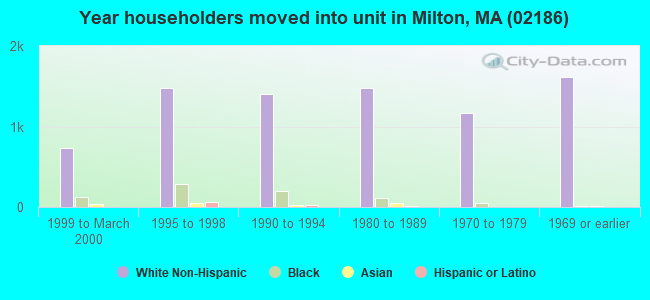
71% of the 02186 zip code residents lived in the same house 5 years ago. Out of people who lived in different houses, 48% lived in this county. Out of people who lived in different counties, 50% lived in Massachusetts.
93% of the 02186 zip code residents lived in the same house 1 year ago. Out of people who lived in different houses, 39% moved from this county. Out of people who lived in different houses, 50% moved from different county within same state. Out of people who lived in different houses, 11% moved from different state. Out of people who lived in different houses, 1% moved from abroad.
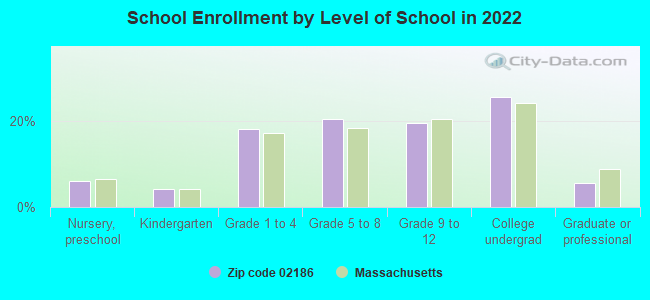
Private vs. public school enrollment:
Students in private schools in grades 1 to 8 (elementary and middle school): 311
Here:
8.8%
Massachusetts:
10.3%
Students in private schools in grades 9 to 12 (high school): 648
Here:
35.3%
Massachusetts:
12.3%
Students in private undergraduate colleges: 1,903
Here:
79.3%
Massachusetts:
51.2%
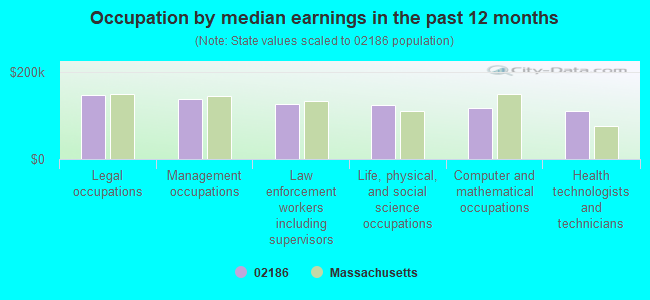
Occupation by median earnings in the past 12 months ($)
148,014Legal occupations
138,227Management occupations
125,627Law enforcement workers including supervisors
124,436Life, physical, and social science occupations
118,001Computer and mathematical occupations
110,677Health technologists and technicians
Companies with federal contracts located in this zip code:
0LUE HILL OBSERVATORY SCIENCE (1 OBSERVATORY RD in MILTON, MA; small business) 3 employees, $74000 revenue.
$39,000 with National Oceanic and Atmospheric Administration/Under Secretary for Oceans and Atmosphere for Weather Reporting/Observation Services. Signed on 1999-12-15. Completion date: 2000-09-15.
HOPSON PINO INC (175 THACHER STREET in MILTON, MA; small business) : $9,950 in 2 contractsfrom 2003 to 2005
$7,500 with U.S. Army Corps of Engineers - civil program financing only for Real Property Appraisals Services (SIC 6531). Signed on 2003-02-22. Completion date: 2003-04-11.
$2,450 with Army for Real Property Appraisals Services (SIC 6531). Signed on 2005-07-07. Completion date: 2005-08-09.
AINSLIE CORPORATION (610 HARLAND STREET in MILTON, MA; small business) : -$732,452 in 14 contractsfrom 2000 to 2004
Contracts for Hardware, Commercial, Antennas, Waveguides, and Related Equipment, Night Vision Equipment, Emitted and Reflected Radiation, Power and Hand Pumps, and moreby Army, Defense Logistics Agency Signed by year:2000: -$897,844; 2001: $49,310; 2002: $36,828; 2003: $0; 2004: $79,254; 2005: $0; 2006: $0.
Biggest contracts:
$424,288 with Army for Hardware, Commercial. Signed on 2000-11-13. Completion date: 2001-06-11.
$82,432 with Army for Antennas, Waveguides, and Related Equipment. Signed on 2000-11-28. Completion date: 2001-05-28.
$81,141, same as above.Signed on 2000-07-17. Completion date: 2001-01-14.
$79,254 with Army for Hardware, Commercial. Signed on 2004-08-10. Completion date: 2004-09-09.
Top industries in this zip code by the number of employees in 2005:
Health Care and Social Assistance: Ambulance Services (500-999 employees: 1 establishment)
Health Care and Social Assistance: General Medical and Surgical Hospitals (500-999: 1)
Educational Services: Colleges, Universities, and Professional Schools (500-999: 1)
Health Care and Social Assistance: Specialty (except Psychiatric and Substance Abuse) Hospitals (250-499: 1)
Other Services (except Public Administration): Religious Organizations (50-99: 2, 5-9: 6, 1-4: 5)
Health Care and Social Assistance: Offices of Physicians (except Mental Health Specialists) (20-49: 2, 10-19: 1, 5-9: 8, 1-4: 18)
Health Care and Social Assistance: Nursing Care Facilities (100-249: 1)
Information: Data Processing, Hosting, and Related Services (100-249: 1)
Educational Services: Elementary and Secondary Schools (50-99: 1, 20-49: 2)
Real Estate and Rental and Leasing: Residential Property Managers (20-49: 2, 10-19: 1, 1-4: 6)
People in group quarters in 2010:
1,229 people in college/university student housing
137 people in nursing facilities/skilled-nursing facilities
98 people in workers' group living quarters and job corps centers
48 people in other noninstitutional facilities
4 people in group homes intended for adults
People in group quarters in 2000:
753 people in college dormitories (includes college quarters off campus)
265 people in nursing homes
15 people in homes for the mentally retarded
2 people in religious group quarters
Fatal accident statistics in 2014:
Fatal accident count: 2
Vehicles involved in fatal accidents: 3
Fatal accidents caused by drunken drivers: 1
Fatalities: 2
Persons involved in fatal accidents: 3
Pedestrians involved in fatal accidents: 0
Fatal accident statistics in 2013:
Fatal accident count: 2
Vehicles involved in fatal accidents: 3
Fatal accidents caused by drunken drivers: 1
Fatalities: 2
Persons involved in fatal accidents: 3
Pedestrians involved in fatal accidents: 0
Home Mortgage Disclosure Act Aggregated Statistics For Year 2009 (Based on 6 full and 4 partial tracts)
A) FHA, FSA/RHS & VA Home Purchase Loans
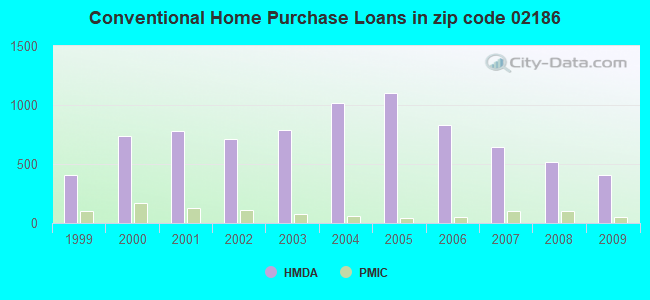
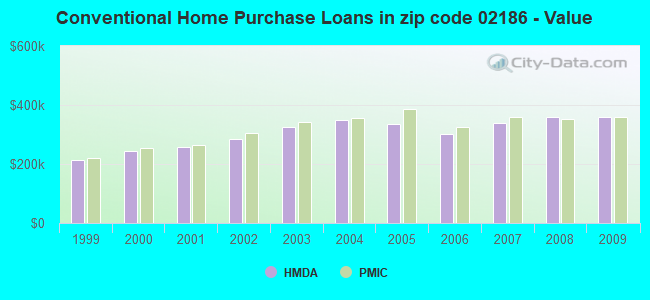
B) Conventional Home Purchase Loans
C) Refinancings
D) Home Improvement Loans
E) Loans on Dwellings For 5+ Families
F) Non-occupant Loans on < 5 Family Dwellings (A B C & D)
Number
Average Value
Number
Average Value
Number
Average Value
Number
Average Value
Number
Average Value
Number
Average Value
LOANS ORIGINATED
132
$382,799
411
$360,780
2,226
$310,254
82
$159,354
1
$497,420
21
$276,758
APPLICATIONS APPROVED, NOT ACCEPTED
11
$294,935
25
$286,833
146
$309,018
8
$233,116
1
$639,320
2
$329,850
APPLICATIONS DENIED
18
$349,893
57
$352,878
417
$348,246
22
$145,238
0
$0
9
$249,737
APPLICATIONS WITHDRAWN
14
$400,456
62
$395,294
310
$330,983
14
$226,021
0
$0
9
$288,442
FILES CLOSED FOR INCOMPLETENESS
2
$302,010
16
$406,794
116
$317,448
8
$210,020
0
$0
2
$209,860
Aggregated Statistics For Year 2008 (Based on 6 full and 4 partial tracts)
A) FHA, FSA/RHS & VA Home Purchase Loans
B) Conventional Home Purchase Loans
C) Refinancings
D) Home Improvement Loans
E) Loans on Dwellings For 5+ Families
F) Non-occupant Loans on < 5 Family Dwellings (A B C & D)
Number
Average Value
Number
Average Value
Number
Average Value
Number
Average Value
Number
Average Value
Number
Average Value
LOANS ORIGINATED
64
$367,278
521
$360,868
852
$319,552
79
$105,751
2
$1,462,580
73
$370,236
APPLICATIONS APPROVED, NOT ACCEPTED
2
$363,510
50
$353,378
107
$311,386
13
$136,576
0
$0
8
$414,222
APPLICATIONS DENIED
17
$374,731
62
$339,802
267
$360,056
63
$94,804
0
$0
8
$271,982
APPLICATIONS WITHDRAWN
4
$377,928
78
$360,279
137
$396,750
2
$50,310
0
$0
14
$290,709
FILES CLOSED FOR INCOMPLETENESS
4
$315,540
24
$426,672
44
$512,816
4
$296,340
0
$0
6
$250,432
Aggregated Statistics For Year 2007 (Based on 6 full and 4 partial tracts)
A) FHA, FSA/RHS & VA Home Purchase Loans
B) Conventional Home Purchase Loans
C) Refinancings
D) Home Improvement Loans
E) Loans on Dwellings For 5+ Families
F) Non-occupant Loans on < 5 Family Dwellings (A B C & D)
Number
Average Value
Number
Average Value
Number
Average Value
Number
Average Value
Number
Average Value
Number
Average Value
LOANS ORIGINATED
4
$362,832
647
$338,170
928
$337,054
210
$116,333
4
$289,762
64
$337,353
APPLICATIONS APPROVED, NOT ACCEPTED
2
$731,760
99
$324,844
176
$359,353
25
$193,133
0
$0
8
$412,325
APPLICATIONS DENIED
2
$363,510
151
$351,718
604
$382,314
95
$133,180
0
$0
37
$248,835
APPLICATIONS WITHDRAWN
0
$0
80
$276,171
262
$371,558
16
$178,269
0
$0
20
$310,102
FILES CLOSED FOR INCOMPLETENESS
0
$0
28
$411,348
90
$373,748
2
$280,350
0
$0
4
$300,595
Aggregated Statistics For Year 2006 (Based on 6 full and 4 partial tracts)
A) FHA, FSA/RHS & VA Home Purchase Loans
B) Conventional Home Purchase Loans
C) Refinancings
D) Home Improvement Loans
E) Loans on Dwellings For 5+ Families
F) Non-occupant Loans on < 5 Family Dwellings (A B C & D)
G) Loans On Manufactured Home Dwelling (A B C & D)
Number
Average Value
Number
Average Value
Number
Average Value
Number
Average Value
Number
Average Value
Number
Average Value
Number
Average Value
LOANS ORIGINATED
4
$476,608
828
$302,093
1,256
$320,096
268
$134,492
4
$547,220
95
$312,844
2
$85,810
APPLICATIONS APPROVED, NOT ACCEPTED
0
$0
117
$233,017
232
$338,525
45
$145,031
0
$0
2
$427,030
2
$114,335
APPLICATIONS DENIED
2
$335,850
193
$352,388
615
$408,413
102
$145,286
0
$0
36
$357,318
0
$0
APPLICATIONS WITHDRAWN
2
$405,985
96
$376,732
361
$390,699
24
$260,602
0
$0
7
$412,396
0
$0
FILES CLOSED FOR INCOMPLETENESS
0
$0
44
$270,656
123
$357,301
10
$190,397
0
$0
16
$315,801
2
$444,510
Aggregated Statistics For Year 2005 (Based on 6 full and 4 partial tracts)
A) FHA, FSA/RHS & VA Home Purchase Loans
B) Conventional Home Purchase Loans
C) Refinancings
D) Home Improvement Loans
E) Loans on Dwellings For 5+ Families
F) Non-occupant Loans on < 5 Family Dwellings (A B C & D)
G) Loans On Manufactured Home Dwelling (A B C & D)
Number
Average Value
Number
Average Value
Number
Average Value
Number
Average Value
Number
Average Value
Number
Average Value
Number
Average Value
LOANS ORIGINATED
2
$304,240
1,102
$336,681
1,535
$322,296
213
$163,669
1
$1,272,480
79
$299,794
4
$296,872
APPLICATIONS APPROVED, NOT ACCEPTED
0
$0
96
$325,007
167
$293,994
26
$116,413
0
$0
10
$206,627
0
$0
APPLICATIONS DENIED
0
$0
189
$343,453
522
$359,833
146
$133,694
0
$0
40
$293,672
0
$0
APPLICATIONS WITHDRAWN
0
$0
142
$316,818
573
$334,842
47
$226,006
2
$184,720
43
$362,944
2
$70,610
FILES CLOSED FOR INCOMPLETENESS
0
$0
35
$360,176
139
$326,489
11
$94,784
0
$0
7
$451,107
0
$0
Aggregated Statistics For Year 2004 (Based on 6 full and 4 partial tracts)
B) Conventional Home Purchase Loans
C) Refinancings
D) Home Improvement Loans
E) Loans on Dwellings For 5+ Families
F) Non-occupant Loans on < 5 Family Dwellings (A B C & D)
G) Loans On Manufactured Home Dwelling (A B C & D)
Number
Average Value
Number
Average Value
Number
Average Value
Number
Average Value
Number
Average Value
Number
Average Value
LOANS ORIGINATED
1,013
$348,947
1,893
$291,638
222
$145,184
9
$422,514
117
$289,588
2
$455,375
APPLICATIONS APPROVED, NOT ACCEPTED
111
$367,840
230
$343,044
59
$137,432
0
$0
18
$325,397
0
$0
APPLICATIONS DENIED
167
$352,451
436
$320,772
108
$92,113
0
$0
18
$292,828
0
$0
APPLICATIONS WITHDRAWN
103
$349,494
547
$303,975
28
$130,155
2
$467,230
24
$303,084
0
$0
FILES CLOSED FOR INCOMPLETENESS
28
$296,215
162
$343,467
6
$171,213
0
$0
6
$290,942
0
$0
Aggregated Statistics For Year 2003 (Based on 6 full and 4 partial tracts)
A) FHA, FSA/RHS & VA Home Purchase Loans
B) Conventional Home Purchase Loans
C) Refinancings
D) Home Improvement Loans
E) Loans on Dwellings For 5+ Families
F) Non-occupant Loans on < 5 Family Dwellings (A B C & D)
Number
Average Value
Number
Average Value
Number
Average Value
Number
Average Value
Number
Average Value
Number
Average Value
LOANS ORIGINATED
4
$180,062
785
$325,582
5,072
$243,153
138
$93,098
1
$621,970
168
$266,383
APPLICATIONS APPROVED, NOT ACCEPTED
2
$294,055
108
$360,989
557
$231,485
48
$68,395
0
$0
18
$265,083
APPLICATIONS DENIED
0
$0
111
$362,122
848
$268,675
64
$74,686
0
$0
47
$282,099
APPLICATIONS WITHDRAWN
4
$288,790
83
$343,058
475
$251,518
12
$28,075
0
$0
24
$234,008
FILES CLOSED FOR INCOMPLETENESS
0
$0
5
$391,932
87
$286,972
4
$67,738
0
$0
2
$242,010
Aggregated Statistics For Year 2002 (Based on 6 full and 4 partial tracts)
A) FHA, FSA/RHS & VA Home Purchase Loans
B) Conventional Home Purchase Loans
C) Refinancings
D) Home Improvement Loans
E) Loans on Dwellings For 5+ Families
F) Non-occupant Loans on < 5 Family Dwellings (A B C & D)
Number
Average Value
Number
Average Value
Number
Average Value
Number
Average Value
Number
Average Value
Number
Average Value
LOANS ORIGINATED
4
$293,215
716
$285,252
3,665
$228,934
208
$72,656
1
$1,060,400
113
$200,080
APPLICATIONS APPROVED, NOT ACCEPTED
0
$0
76
$324,499
421
$225,699
87
$70,912
0
$0
10
$238,361
APPLICATIONS DENIED
0
$0
86
$286,810
509
$238,518
117
$93,357
0
$0
31
$207,699
APPLICATIONS WITHDRAWN
0
$0
75
$292,294
315
$251,938
36
$62,818
0
$0
21
$293,123
FILES CLOSED FOR INCOMPLETENESS
0
$0
6
$243,382
179
$238,542
0
$0
0
$0
8
$234,191
Aggregated Statistics For Year 2001 (Based on 6 full and 4 partial tracts)
A) FHA, FSA/RHS & VA Home Purchase Loans
B) Conventional Home Purchase Loans
C) Refinancings
D) Home Improvement Loans
E) Loans on Dwellings For 5+ Families
F) Non-occupant Loans on < 5 Family Dwellings (A B C & D)
Number
Average Value
Number
Average Value
Number
Average Value
Number
Average Value
Number
Average Value
Number
Average Value
LOANS ORIGINATED
12
$246,127
781
$258,615
2,352
$221,951
214
$59,697
2
$344,055
76
$249,712
APPLICATIONS APPROVED, NOT ACCEPTED
2
$258,500
93
$250,574
295
$164,711
59
$49,517
0
$0
14
$167,624
APPLICATIONS DENIED
0
$0
53
$205,747
390
$206,988
133
$41,821
0
$0
27
$239,606
APPLICATIONS WITHDRAWN
4
$201,195
67
$297,201
280
$210,378
29
$46,590
0
$0
10
$347,023
FILES CLOSED FOR INCOMPLETENESS
0
$0
12
$270,412
72
$236,141
4
$29,688
0
$0
1
$158,100
Aggregated Statistics For Year 2000 (Based on 6 full and 4 partial tracts)
A) FHA, FSA/RHS & VA Home Purchase Loans
B) Conventional Home Purchase Loans
C) Refinancings
D) Home Improvement Loans
E) Loans on Dwellings For 5+ Families
F) Non-occupant Loans on < 5 Family Dwellings (A B C & D)
Number
Average Value
Number
Average Value
Number
Average Value
Number
Average Value
Number
Average Value
Number
Average Value
LOANS ORIGINATED
22
$199,212
734
$243,245
597
$196,344
252
$44,246
1
$354,750
51
$195,291
APPLICATIONS APPROVED, NOT ACCEPTED
5
$164,868
73
$251,514
109
$155,907
71
$37,302
0
$0
11
$161,478
APPLICATIONS DENIED
2
$220,280
79
$222,267
224
$131,862
135
$46,066
0
$0
18
$165,485
APPLICATIONS WITHDRAWN
2
$156,415
83
$235,699
178
$107,847
27
$44,799
0
$0
2
$419,700
FILES CLOSED FOR INCOMPLETENESS
2
$209,795
18
$322,978
30
$165,394
6
$123,992
0
$0
2
$178,605
Aggregated Statistics For Year 1999 (Based on 3 full and 2 partial tracts)
A) FHA, FSA/RHS & VA Home Purchase Loans
B) Conventional Home Purchase Loans
C) Refinancings
D) Home Improvement Loans
E) Loans on Dwellings For 5+ Families
F) Non-occupant Loans on < 5 Family Dwellings (A B C & D)
2002 - 2018 National Fire Incident Reporting System (NFIRS) incidents
According to the data from the years 2002 - 2018 the average number of fires per year is 177. The highest number of fire incidents - 234 took place in 2007, and the least - 72 in 2018. The data has a declining trend.
When looking into fire subcategories, the most reports belonged to: Structure Fires (63.5%), and Outside Fires (22.1%).
Fire incident types reported to NFIRS in Zip Code 02186


 Nearest zip codes: 02126, 02124, 02136, 02131, 02122, 02121.


 According to the data from the years 2002 - 2018 the average number of fires per year is 177. The highest number of fire incidents - 234 took place in 2007, and the least - 72 in 2018. The data has a declining trend.
 When looking into fire subcategories, the most reports belonged to: Structure Fires (63.5%), and Outside Fires (22.1%).