Estimated zip code population in 2022: 29,810 Zip code population in 2010: 25,978 Zip code population in 2000: 25,057
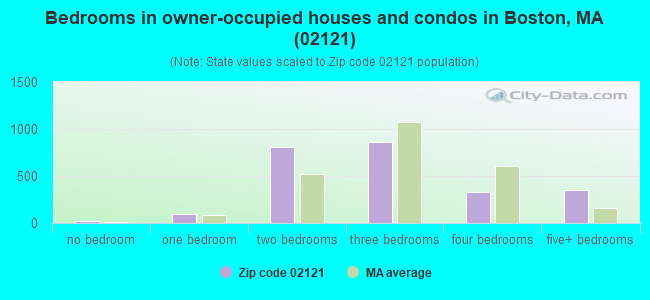
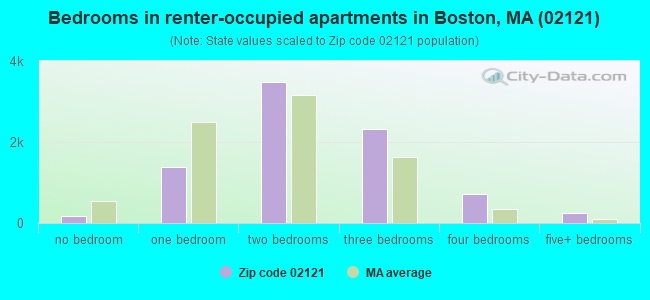
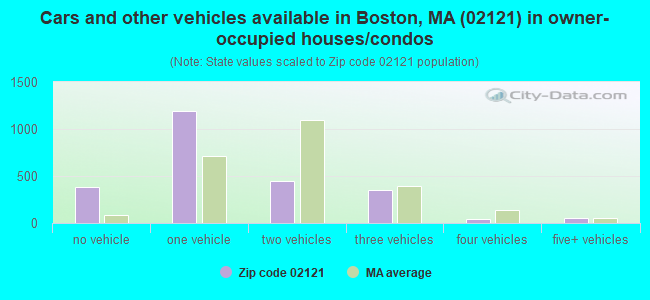
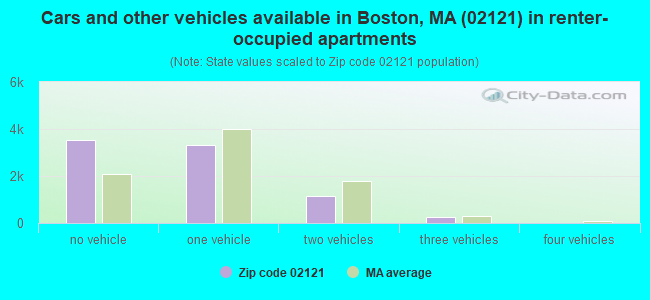
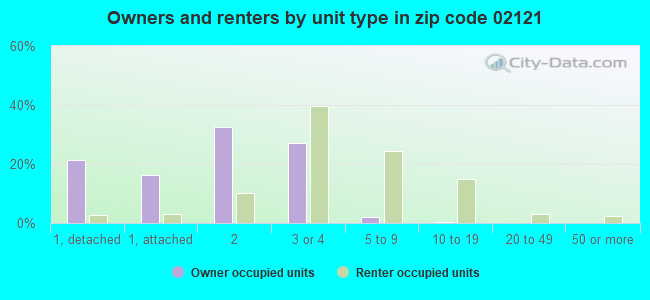
Houses and condos: 11,726 Renter-occupied apartments: 8,303
% of renters here:
77%
State:
38%
March 2022 cost of living index in zip code 02121: 143.7 (very high, U.S. average is 100)
Land area: 1.7 sq. mi. Water area: 0.0 sq. mi.
Population density: 17,080 people per square mile
(very high).
OSM Map
Google Map
MSN Map
OSM Map
General Map
Google Map
MSN Map
OSM Map
Google Map
MSN Map
OSM Map
Google Map
MSN Map
Please wait while loading the map...
Real estate property taxes paid for housing units in 2022:
This zip code:
0.5% ($2,702)
Massachusetts:
1.0% ($5,536)
Median real estate property taxes paid for housing units with mortgages in 2022: $2,658 (0.5%) Median real estate property taxes paid for housing units with no mortgage in 2022: $2,968 (0.5%)
Averages for the 2020 tax year for zip code 02121, filed in 2021:
Average Adjusted Gross Income (AGI) in 2020: $38,417 (Individual Income Tax Returns)
Here:
$38,417
State:
$105,130
Salary/wage: $35,084 (reported on 85.7% of returns)
Here:
$35,084
State:
$82,951
(% of AGI for various income ranges: 1070.2% for AGIs below $25k, 3422.1% for AGIs $25k-50k, 6967.8% for AGIs $50k-75k, 9905.2% for AGIs $75k-100k, 18837.9% for AGIs $100k-200k, 80480.0% for AGIs over 200k)
Taxable interest for individuals: $237 (reported on 11.2% of returns)
This zip code:
$237
Massachusetts:
$2,361
(% of AGI for various income ranges: 2.5% for AGIs below $25k, 1.2% for AGIs $25k-50k, 4.9% for AGIs $50k-75k, 12.2% for AGIs $75k-100k, 18.8% for AGIs $100k-200k, 75.0% for AGIs over 200k)
Ordinary dividends: $882 (reported on 3.2% of returns)
Here:
$882
State:
$10,365
(% of AGI for various income ranges: 0.9% for AGIs below $25k, 1.5% for AGIs $25k-50k, 4.9% for AGIs $50k-75k, 9.1% for AGIs $75k-100k, 35.5% for AGIs $100k-200k, 250.0% for AGIs over 200k)
Net capital gain/loss in AGI: +$6,157 (reported on 3.3% of returns)
Here:
+$6,157
State:
+$48,178
(% of AGI for various income ranges: 1.6% for AGIs below $25k, 1.5% for AGIs $25k-50k, 7.2% for AGIs $50k-75k, 21.3% for AGIs $75k-100k, 175.2% for AGIs $100k-200k, 9535.0% for AGIs over 200k)
Profit/loss from business: +$5,359 (reported on 15.3% of returns)
Here:
+$5,359
State:
+$20,792
(% of AGI for various income ranges: 94.4% for AGIs below $25k, 64.0% for AGIs $25k-50k, 107.2% for AGIs $50k-75k, 212.2% for AGIs $75k-100k, 628.2% for AGIs $100k-200k)
Taxable individual retirement arrangement distribution: $11,764 (reported on 1.6% of returns)
02121:
$11,764
Massachusetts:
$22,790
(% of AGI for various income ranges: 7.3% for AGIs below $25k, 13.7% for AGIs $25k-50k, 41.7% for AGIs $50k-75k, 55.9% for AGIs $75k-100k, 246.1% for AGIs $100k-200k)
Total itemized deductions: $25,047 (reported on 3.9% of returns)
Here:
$25,047
State:
$36,722
(% of AGI for various income ranges: 15.7% for AGIs below $25k, 54.6% for AGIs $25k-50k, 227.6% for AGIs $50k-75k, 453.7% for AGIs $75k-100k, 1184.5% for AGIs $100k-200k, 6080.0% for AGIs over 200k)
Charity contributions: $5,698 (reported on 2.9% of returns)
Here:
$5,698
State:
$12,529
(% of AGI for various income ranges: 0.8% for AGIs below $25k, 8.6% for AGIs $25k-50k, 34.1% for AGIs $50k-75k, 82.6% for AGIs $75k-100k, 198.8% for AGIs $100k-200k, 1495.0% for AGIs over 200k)
Taxes paid: $6,194 (reported on 3.9% of returns)
02121:
$6,194
State:
$8,782
(% of AGI for various income ranges: 2.4% for AGIs below $25k, 10.2% for AGIs $25k-50k, 43.6% for AGIs $50k-75k, 121.3% for AGIs $75k-100k, 367.3% for AGIs $100k-200k, 1625.0% for AGIs over 200k)
Earned income credit: $2,273 (reported on 28.4% of returns)
Here:
$2,273
State:
$1,909
(% of AGI for various income ranges: 127.1% for AGIs below $25k, 86.4% for AGIs $25k-50k, 0.6% for AGIs $50k-75k)
Percentage of individuals using paid preparers for their 2020 taxes: 91.7%
Here:
92%
State:
92%
(% for various income ranges: 90.6% for AGIs below $25k, 93.6% for AGIs $25k-50k, 91.7% for AGIs $50k-75k, 90.5% for AGIs $75k-100k, 89.7% for AGIs $100k-200k, 87.5% for AGIs over 200k)
Averages for the 2012 tax year for zip code 02121, filed in 2013:
Average Adjusted Gross Income (AGI) in 2012: $28,760 (Individual Income Tax Returns)
Here:
$28,760
State:
$81,425
Salary/wage: $27,915 (reported on 89.6% of returns)
Here:
$27,915
State:
$64,752
(% of AGI for various income ranges: 82.3% for AGIs below $25k, 91.1% for AGIs $25k-50k, 89.5% for AGIs $50k-75k, 87.4% for AGIs $75k-100k, 77.4% for AGIs $100k-200k)
Taxable interest for individuals: $294 (reported on 11.3% of returns)
This zip code:
$294
Massachusetts:
$2,136
(% of AGI for various income ranges: 0.1% for AGIs below $25k, 0.1% for AGIs $25k-50k)
Ordinary dividends: $1,362 (reported on 3.0% of returns)
Here:
$1,362
State:
$9,473
(% of AGI for various income ranges: 0.2% for AGIs below $25k, 0.1% for AGIs $25k-50k, 0.3% for AGIs $100k-200k)
Net capital gain/loss in AGI: +$17 (reported on 1.6% of returns)
Here:
+$17
State:
+$31,437
(% of AGI for various income ranges: 0.1% for AGIs $100k-200k)
Profit/loss from business: +$8,141 (reported on 9.5% of returns)
Here:
+$8,141
State:
+$20,662
(% of AGI for various income ranges: 8.4% for AGIs below $25k, 1.2% for AGIs $25k-50k, 0.5% for AGIs $50k-75k, 1.1% for AGIs $75k-100k, 0.6% for AGIs $100k-200k)
Taxable individual retirement arrangement distribution: $11,437 (reported on 2.4% of returns)
02121:
$11,437
Massachusetts:
$18,892
(% of AGI for various income ranges: 0.6% for AGIs below $25k, 0.5% for AGIs $25k-50k, 1.7% for AGIs $50k-75k, 2.9% for AGIs $100k-200k)
Total itemized deductions: $16,284 (27% of AGI, reported on 12.0% of returns)
Here:
$16,284
State:
$28,907
Here:
26.7% of AGI
State:
18.2% of AGI
(% of AGI for various income ranges: 3.0% for AGIs below $25k, 5.2% for AGIs $25k-50k, 9.1% for AGIs $50k-75k, 10.3% for AGIs $75k-100k, 13.3% for AGIs $100k-200k)
Charity contributions: $3,395 (reported on 9.5% of returns)
Here:
$3,395
State:
$4,208
(% of AGI for various income ranges: 0.4% for AGIs below $25k, 0.9% for AGIs $25k-50k, 1.6% for AGIs $50k-75k, 1.6% for AGIs $75k-100k, 2.5% for AGIs $100k-200k)
Taxes paid: $4,279 (reported on 11.9% of returns)
02121:
$4,279
State:
$13,303
(% of AGI for various income ranges: 0.5% for AGIs below $25k, 1.0% for AGIs $25k-50k, 2.5% for AGIs $50k-75k, 3.3% for AGIs $75k-100k, 4.6% for AGIs $100k-200k)
Earned income credit: $2,354 (reported on 38.8% of returns)
Here:
$2,354
State:
$1,971
(% of AGI for various income ranges: 10.9% for AGIs below $25k, 1.6% for AGIs $25k-50k)
Percentage of individuals using paid preparers for their 2012 taxes: 55.3%
Here:
55%
State:
56%
(% for various income ranges: 54.2% for AGIs below $25k, 55.0% for AGIs $25k-50k, 58.3% for AGIs $50k-75k, 59.0% for AGIs $75k-100k, 66.7% for AGIs $100k-200k)
Averages for the 2004 tax year for zip code 02121, filed in 2005:
Average Adjusted Gross Income (AGI) in 2004: $25,603 (Individual Income Tax Returns)
Here:
$25,603
State:
$62,877
Salary/wage: $25,759 (reported on 91.3% of returns)
Here:
$25,759
State:
$52,969
(% of AGI for various income ranges: 92.4% for AGIs below $10k, 90.1% for AGIs $10k-25k, 95.1% for AGIs $25k-50k, 93.0% for AGIs $50k-75k, 91.7% for AGIs $75k-100k, 75.6% for AGIs over 100k)
Taxable interest for individuals: $350 (reported on 18.7% of returns)
This zip code:
$350
Massachusetts:
$1,945
(% of AGI for various income ranges: 0.7% for AGIs below $10k, 0.3% for AGIs $10k-25k, 0.2% for AGIs $25k-50k, 0.2% for AGIs $50k-75k, 0.2% for AGIs $75k-100k, 0.4% for AGIs over 100k)
Taxable dividends: $425 (reported on 4.4% of returns)
Here:
$425
State:
$5,323
(% of AGI for various income ranges: 0.2% for AGIs below $10k, 0.1% for AGIs $10k-25k, 0.1% for AGIs $25k-50k, 0.1% for AGIs $50k-75k, 0.0% for AGIs $75k-100k, 0.2% for AGIs over 100k)
Net capital gain/loss: +$8,948 (reported on 2.6% of returns)
Here:
+$8,948
State:
+$20,377
(% of AGI for various income ranges: -0.1% for AGIs below $10k, 0.0% for AGIs $10k-25k, 0.0% for AGIs $25k-50k, 0.1% for AGIs $50k-75k, -0.0% for AGIs $75k-100k, 12.7% for AGIs over 100k)
Profit/loss from business: +$4,834 (reported on 8.0% of returns)
Here:
+$4,834
State:
+$17,837
(% of AGI for various income ranges: 10.0% for AGIs below $10k, 3.6% for AGIs $10k-25k, 0.5% for AGIs $25k-50k, -0.0% for AGIs $50k-75k, 0.1% for AGIs $75k-100k, 0.2% for AGIs over 100k)
IRA payment deduction: $1,540 (reported on 0.7% of returns)
02121:
$1,540
Massachusetts:
$3,100
Total itemized deductions: $14,714 (29% of AGI, reported on 15.0% of returns)
Here:
$14,714
State:
$22,573
Here:
29.1% of AGI
State:
19.5% of AGI
(% of AGI for various income ranges: 5.7% for AGIs below $10k, 4.7% for AGIs $10k-25k, 7.7% for AGIs $25k-50k, 11.8% for AGIs $50k-75k, 13.8% for AGIs $75k-100k, 14.8% for AGIs over 100k)
Charity contributions deductions: $3,177 (6% of AGI, reported on 13.0% of returns)
Here:
$3,177
State:
$3,295
Here:
6.1% of AGI
State:
2.7% of AGI
(% of AGI for various income ranges: 0.4% for AGIs below $10k, 0.7% for AGIs $10k-25k, 1.4% for AGIs $25k-50k, 2.3% for AGIs $50k-75k, 3.1% for AGIs $75k-100k, 3.1% for AGIs over 100k)
Total tax: $3,015 (reported on 58.5% of returns)
02121:
$3,015
State:
$11,494
(% of AGI for various income ranges: 2.2% for AGIs below $10k, 3.0% for AGIs $10k-25k, 6.0% for AGIs $25k-50k, 10.0% for AGIs $50k-75k, 11.5% for AGIs $75k-100k, 15.3% for AGIs over 100k)
Earned income credit: $1,845 (reported on 37.4% of returns)
Here:
$1,845
State:
$1,518
Percentage of individuals using paid preparers for their 2004 taxes: 65.3%
Here:
65%
State:
58%
(% for various income ranges: 62.1% for AGIs below $10k, 68.4% for AGIs $10k-25k, 63.3% for AGIs $25k-50k, 65.5% for AGIs $50k-75k, 72.7% for AGIs $75k-100k, 78.0% for AGIs over 100k)
Household received Food Stamps/SNAP in the past 12 months: 5,614 Household did not receive Food Stamps/SNAP in the past 12 months: 5,854
Women who had a birth in the past 12 months: 309 (206 now married, 97 unmarried) Women who did not have a birth in the past 12 months: 7,975 (1,423 now married, 6,645 unmarried)
Housing units in zip code 02121 with a mortgage: 1,911 (102 second mortgage, 11 home equity loan, 35 both second mortgage and home equity loan) Median monthly owner costs for units with a mortgage: $2,448 Median monthly owner costs for units without a mortgage: $985
Residents with income below the poverty level in 2022:
This zip code:
25.6%
Whole state:
10.4%
Residents with income below 50% of the poverty level in 2022:
This zip code:
12.1%
Whole state:
5.1%
Median number of rooms in houses and condos:
Here:
5.7
State:
6.5
Median number of rooms in apartments:
Here:
4.4
State:
4.0
Notable locations in this zip code not listed on our city pages
Churches in zip code 02121 include: First Hatian Baptist Church (A), Charles Street African Methodist Episcopal Church (B), Saint Mark Congregational Church (C), New Life Resurrection Baptist Church (D). Display/hide their locations on the map
2,143 married couples with children.
3,301 single-parent households (278 men, 3,023 women).
59.4% of residents of 02121 zip code speak English at home.
27.8% of residents speak Spanish at home (39% very well, 19% well, 26% not well, 17% not at all).
9.4% of residents speak other Indo-European language at home (57% very well, 21% well, 18% not well, 5% not at all).
0.1% of residents speak Asian or Pacific Island language at home (53% very well, 47% not well).
3.6% of residents speak other language at home (33% very well, 57% well, 9% not well, 1% not at all).
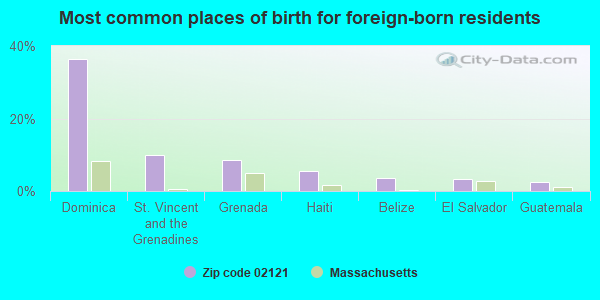
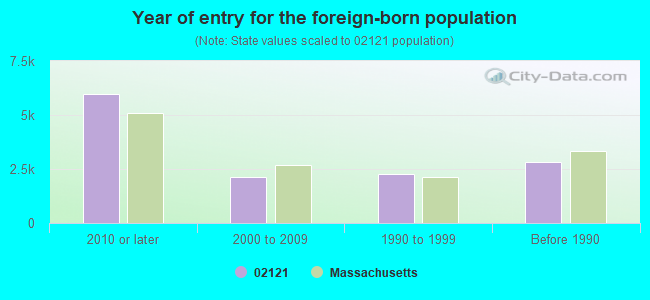
Foreign born population: 10,947 (36.7%) (49.0% of them are naturalized citizens)
Major facilities with environmental interests located in this zip code:
BOSTON LATIN ACADEMY (205 TOWNSEND STREET in DORCHESTER, MA)
(Geographic Names Information System) (National Center for Education Statistics) - STATE ID-035545
JEREMIAH E BURKE HIGH (60 WASHINGTON STREET in DORCHESTER, MA)
(National Center for Education Statistics) - STATE ID-035525 Organizations: BOSTON (SCHOOL DISTRICT)
JOHN P HOLLAND (85 OLNEY STREET in DORCHESTER, MA)
(National Center for Education Statistics) - STATE ID-035167 Organizations: BOSTON (SCHOOL DISTRICT)
MARTIN LUTHER KING JR MID (77 LAWRENCE AVENUE in DORCHESTER, MA)
(National Center for Education Statistics) - STATE ID-035410 Organizations: BOSTON (SCHOOL DISTRICT)
AB & W INCORPORATED (157 WASHINGTON ST. in BOSTON, MA)
AIR MINOR (AIRS/AFS) CRITERIA AND HAZARDOUS AIR POLLUTANT INVENTORY (Inventory of air pollution sources) Small Quantity Generators, between 100 kg and 1000 kg of hazardous waste/month (Resource Conservation and Recovery Act (tracking hazardous waste)) - notification Business SIC classification: FABRICATED METAL PRODUCTS Organizations: AB&W INC (CONTACT/OPERATOR)
Alternative names: A B & W INC
ATLAS ENGINEERING (10 CHENEY ST. in BOSTON, MA)
AIR MINOR (AIRS/AFS) (Resource Conservation and Recovery Act (tracking hazardous waste)) Business SIC classification: SHEET METALWORK
BOSTON CONVENTION & EXIBITION CENTER (348D STREET in BOSTON, MA)
AIR MINOR (AIRS/AFS) CRITERIA AND HAZARDOUS AIR POLLUTANT INVENTORY (Inventory of air pollution sources) Alternative names: BOSTON CONVENTION CENTER
ZOO NEW ENGLAND (1 FRANKLIN PARK RD in DORCHESTER, MA)
AIR MINOR (AIRS/AFS) CRITERIA AND HAZARDOUS AIR POLLUTANT INVENTORY (Inventory of air pollution sources) Business SIC classification: ANIMAL SPECIALTY SERVICES, EXCEPT VETERINARY Alternative names: COMMONWEALTH ZOOL. C, FRANKLIN PARK ZOO, FRANKLIN PARK ZOO (ZOO NEW ENGLAND)
MCCOURT JOHN CO (28 WOLCOTT ST in BOSTON, MA)
(Resource Conservation and Recovery Act (tracking hazardous waste)) Organizations: JOHN MCCOURT CO (CONTACT/OWNER)
PARKMANS ARCO SERVICE (524 WARREN ST in BOSTON, MA)
BLUE HILL CLEANERS (1110 BLUE HILL AVE in DORCHESTER, MA)
AIR MINOR (AIRS/AFS) Business SIC classification: DRYCLEANING PLANTS, EXCEPT RUG CLEANING
MOSES GARAGE & SERVICE CENTER (58 GENEVA AVE in BOSTON, MA)
Small Quantity Generators, between 100 kg and 1000 kg of hazardous waste/month (Resource Conservation and Recovery Act (tracking hazardous waste)) - notification Organizations: MOSES BORDERS (CONTACT/OWNER)
DORCHESTER (TOWN OF DORCHESTER in BOSTON, MA)
AIR MINOR (AIRS/AFS) Business SIC classification: GENERAL GOVERNMENT
Housing units lacking complete plumbing facilities: 0.7% Housing units lacking complete kitchen facilities: 0.6%
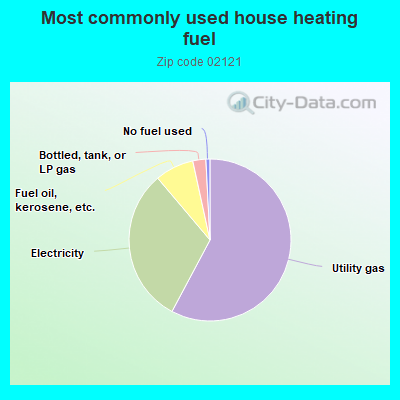
57.5%Utility gas
30.9%Electricity
7.7%Fuel oil, kerosene, etc.
2.6%Bottled, tank, or LP gas
0.8%No fuel used
Population in 1990: 25,602.
Place of birth for U.S.-born residents:
This state: 13,899
Northeast: 710
Midwest: 129
South: 2,071
West: 162
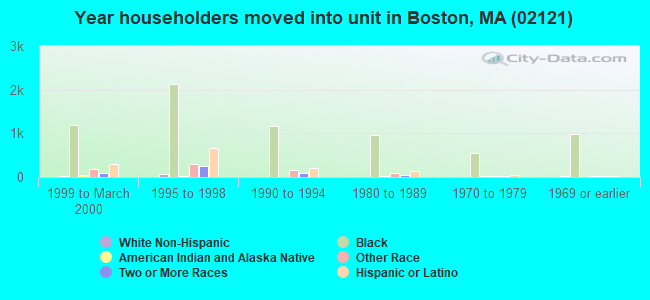
60% of the 02121 zip code residents lived in the same house 5 years ago. Out of people who lived in different houses, 84% lived in this county. Out of people who lived in different counties, 50% lived in Massachusetts.
92% of the 02121 zip code residents lived in the same house 1 year ago. Out of people who lived in different houses, 64% moved from this county. Out of people who lived in different houses, 18% moved from different county within same state. Out of people who lived in different houses, 10% moved from different state. Out of people who lived in different houses, 6% moved from abroad.
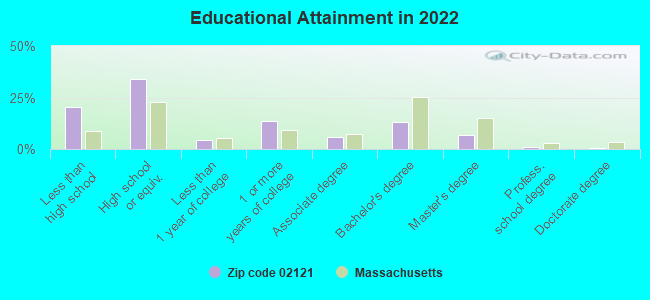
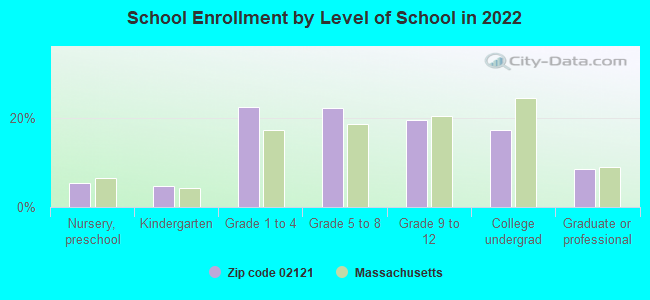
Private vs. public school enrollment:
Students in private schools in grades 1 to 8 (elementary and middle school): 101
Here:
2.8%
Massachusetts:
10.3%
Students in private schools in grades 9 to 12 (high school): 119
Here:
7.7%
Massachusetts:
12.3%
Students in private undergraduate colleges: 568
Here:
41.4%
Massachusetts:
51.2%
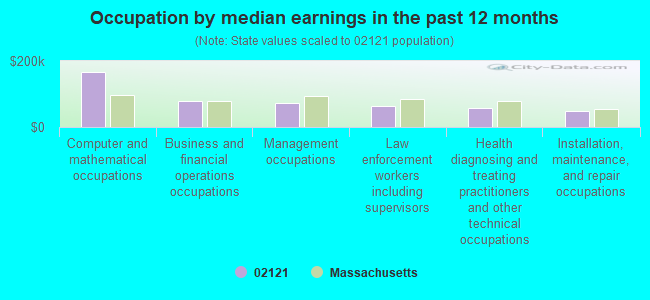
Occupation by median earnings in the past 12 months ($)
166,514Computer and mathematical occupations
78,239Business and financial operations occupations
73,163Management occupations
64,910Law enforcement workers including supervisors
58,483Health diagnosing and treating practitioners and other technical occupations
47,332Installation, maintenance, and repair occupations
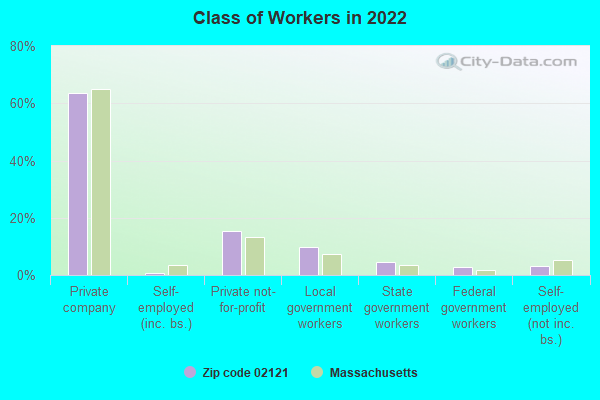
Companies with federal contracts located in this zip code:
GENERAL AIR CONDITIONING & HEA (20 SEAVER ST in BOSTON, MA; small business) : $4,722,533 in 15 contractsfrom 2000 to 2006
Contracts for Maintenance, Repair or Alteration of Real Property -- Office Buildings, Maintenance, Repair or Alteration of Real Property -- Heating and Cooling Plants, Construction of Structures and Facilities -- Government-Owned Government-Operated (GOGO) R&D Facilities, Maintenance, Repair or Alteration of Real Property -- Other Administrative Facilities and Service Buildings, and moreby Air Force, Army, EPA, Navy, and others Signed by year:2000: $197,342; 2001: $0; 2002: $2,132,437; 2003: $236,000; 2004: $1,906,230; 2005: $52,524; 2006: $198,000.
Biggest contracts:
$2,132,437 with Air Force for Maintenance, Repair or Alteration of Real Property -- Office Buildings. Signed on 2002-09-30. Completion date: 2003-05-31.
$1,894,800 with Army for Maintenance, Repair or Alteration of Real Property -- Heating and Cooling Plants. Signed on 2004-10-27. Completion date: 2005-06-30.
$236,000 with EPA for Construction of Structures and Facilities -- Government-Owned Government-Operated (GOGO) R&D Facilities. Taking place in RI. Signed on 2003-09-15. Completion date: 2004-06-15.
$198,000 with Army for Maintenance, Repair or Alteration of Real Property -- Other Administrative Facilities and Service Buildings. Signed on 2006-06-15. Completion date: 2006-08-04.
Top industries in this zip code by the number of employees in 2005:
Health Care and Social Assistance: Other Individual and Family Services (100-249 employees: 1 establishment, 20-49 employees: 2 establishments, 10-19 employees: 1 establishment, 5-9 employees: 4 establishments)
Accommodation and Food Services: Limited-Service Restaurants (100-249: 1, 1-4: 7)
Health Care and Social Assistance: Nursing Care Facilities (100-249: 1, 1-4: 1)
Administrative and Support and Waste Management and Remediation Services: Investigation Services (100-249: 1)
Arts, Entertainment, and Recreation: Zoos and Botanical Gardens (100-249: 1)
Health Care and Social Assistance: Residential Mental Health and Substance Abuse Facilities (100-249: 1)
Health Care and Social Assistance: Child Day Care Services (50-99: 1, 20-49: 1, 5-9: 1, 1-4: 4)
Health Care and Social Assistance: Home Health Care Services (50-99: 1, 20-49: 1, 10-19: 1)
Health Care and Social Assistance: All Other Outpatient Care Centers (50-99: 1, 5-9: 1)
People in group quarters in 2010:
33 people in emergency and transitional shelters (with sleeping facilities) for people experiencing homelessness
12 people in residential treatment centers for adults
11 people in group homes intended for adults
3 people in group homes for juveniles (non-correctional)
People in group quarters in 2000:
35 people in other noninstitutional group quarters
25 people in homes for the mentally retarded
14 people in halfway houses
14 people in nursing homes
Fatal accident statistics in 2014:
Fatal accident count: 1
Vehicles involved in fatal accidents: 1
Fatal accidents caused by drunken drivers: 0
Fatalities: 1
Persons involved in fatal accidents: 1
Pedestrians involved in fatal accidents: 1
Fatal accident statistics in 2013:
Fatal accident count: 3
Vehicles involved in fatal accidents: 5
Fatal accidents caused by drunken drivers: 2
Fatalities: 3
Persons involved in fatal accidents: 4
Pedestrians involved in fatal accidents: 2
Home Mortgage Disclosure Act Aggregated Statistics For Year 2009 (Based on 5 full and 10 partial tracts)
A) FHA, FSA/RHS & VA Home Purchase Loans
B) Conventional Home Purchase Loans
C) Refinancings
D) Home Improvement Loans
E) Loans on Dwellings For 5+ Families
F) Non-occupant Loans on < 5 Family Dwellings (A B C & D)
Number
Average Value
Number
Average Value
Number
Average Value
Number
Average Value
Number
Average Value
Number
Average Value
LOANS ORIGINATED
55
$271,793
117
$165,889
114
$232,368
13
$114,019
3
$729,067
47
$211,160
APPLICATIONS APPROVED, NOT ACCEPTED
4
$303,292
16
$196,543
20
$253,118
10
$57,935
0
$0
6
$219,668
APPLICATIONS DENIED
33
$294,604
81
$133,763
133
$252,094
32
$56,137
0
$0
23
$269,467
APPLICATIONS WITHDRAWN
15
$285,662
31
$151,955
57
$247,669
9
$152,784
0
$0
13
$225,845
FILES CLOSED FOR INCOMPLETENESS
8
$227,644
9
$191,954
28
$272,348
2
$43,395
0
$0
5
$196,668
Aggregated Statistics For Year 2008 (Based on 5 full and 10 partial tracts)
A) FHA, FSA/RHS & VA Home Purchase Loans
B) Conventional Home Purchase Loans
C) Refinancings
D) Home Improvement Loans
E) Loans on Dwellings For 5+ Families
F) Non-occupant Loans on < 5 Family Dwellings (A B C & D)
G) Loans On Manufactured Home Dwelling (A B C & D)
Number
Average Value
Number
Average Value
Number
Average Value
Number
Average Value
Number
Average Value
Number
Average Value
Number
Average Value
LOANS ORIGINATED
30
$274,554
181
$173,577
117
$232,452
27
$50,943
8
$577,785
71
$235,567
0
$0
APPLICATIONS APPROVED, NOT ACCEPTED
4
$325,015
28
$178,518
39
$268,387
12
$26,145
0
$0
8
$319,038
0
$0
APPLICATIONS DENIED
35
$261,740
159
$215,666
216
$304,114
66
$74,988
1
$2,220,000
52
$282,122
5
$194,958
APPLICATIONS WITHDRAWN
10
$315,589
14
$166,130
44
$268,267
8
$176,461
0
$0
8
$183,590
0
$0
FILES CLOSED FOR INCOMPLETENESS
2
$281,175
13
$223,182
25
$288,204
0
$0
1
$2,100,000
8
$228,214
0
$0
Aggregated Statistics For Year 2007 (Based on 5 full and 10 partial tracts)
A) FHA, FSA/RHS & VA Home Purchase Loans
B) Conventional Home Purchase Loans
C) Refinancings
D) Home Improvement Loans
E) Loans on Dwellings For 5+ Families
F) Non-occupant Loans on < 5 Family Dwellings (A B C & D)
G) Loans On Manufactured Home Dwelling (A B C & D)
Number
Average Value
Number
Average Value
Number
Average Value
Number
Average Value
Number
Average Value
Number
Average Value
Number
Average Value
LOANS ORIGINATED
5
$337,646
250
$206,985
383
$283,125
95
$120,871
9
$384,511
95
$310,397
0
$0
APPLICATIONS APPROVED, NOT ACCEPTED
0
$0
61
$266,630
103
$316,910
20
$142,288
0
$0
34
$319,695
2
$17,910
APPLICATIONS DENIED
3
$305,153
215
$282,415
656
$333,013
143
$133,541
1
$50,830
140
$364,507
2
$114,330
APPLICATIONS WITHDRAWN
5
$415,468
53
$243,264
208
$311,623
12
$242,079
5
$329,996
33
$322,740
0
$0
FILES CLOSED FOR INCOMPLETENESS
0
$0
18
$242,127
74
$363,741
0
$0
0
$0
14
$297,783
0
$0
Aggregated Statistics For Year 2006 (Based on 5 full and 10 partial tracts)
A) FHA, FSA/RHS & VA Home Purchase Loans
B) Conventional Home Purchase Loans
C) Refinancings
D) Home Improvement Loans
E) Loans on Dwellings For 5+ Families
F) Non-occupant Loans on < 5 Family Dwellings (A B C & D)
G) Loans On Manufactured Home Dwelling (A B C & D)
Number
Average Value
Number
Average Value
Number
Average Value
Number
Average Value
Number
Average Value
Number
Average Value
Number
Average Value
LOANS ORIGINATED
2
$260,260
584
$230,739
715
$303,582
127
$122,328
15
$517,725
216
$288,304
0
$0
APPLICATIONS APPROVED, NOT ACCEPTED
2
$367,150
93
$236,867
140
$288,867
15
$143,949
2
$256,585
33
$302,078
0
$0
APPLICATIONS DENIED
1
$454,000
405
$258,258
733
$345,657
115
$163,652
5
$280,382
151
$328,047
7
$104,077
APPLICATIONS WITHDRAWN
0
$0
108
$270,134
327
$322,489
22
$203,835
3
$295,540
42
$316,623
2
$322,705
FILES CLOSED FOR INCOMPLETENESS
0
$0
33
$311,974
120
$296,636
0
$0
0
$0
8
$389,316
0
$0
Aggregated Statistics For Year 2005 (Based on 5 full and 10 partial tracts)
A) FHA, FSA/RHS & VA Home Purchase Loans
B) Conventional Home Purchase Loans
C) Refinancings
D) Home Improvement Loans
E) Loans on Dwellings For 5+ Families
F) Non-occupant Loans on < 5 Family Dwellings (A B C & D)
G) Loans On Manufactured Home Dwelling (A B C & D)
Number
Average Value
Number
Average Value
Number
Average Value
Number
Average Value
Number
Average Value
Number
Average Value
Number
Average Value
LOANS ORIGINATED
6
$320,655
570
$238,609
848
$290,768
98
$243,399
24
$728,060
266
$308,903
0
$0
APPLICATIONS APPROVED, NOT ACCEPTED
0
$0
79
$269,178
139
$294,000
7
$132,506
7
$218,279
22
$242,168
0
$0
APPLICATIONS DENIED
5
$341,482
302
$269,700
788
$309,975
184
$116,566
6
$673,095
150
$330,540
0
$0
APPLICATIONS WITHDRAWN
0
$0
178
$245,589
567
$280,146
38
$234,887
8
$258,630
110
$324,108
2
$155,225
FILES CLOSED FOR INCOMPLETENESS
0
$0
51
$251,813
141
$335,860
3
$293,993
0
$0
22
$369,007
0
$0
Aggregated Statistics For Year 2004 (Based on 5 full and 10 partial tracts)
A) FHA, FSA/RHS & VA Home Purchase Loans
B) Conventional Home Purchase Loans
C) Refinancings
D) Home Improvement Loans
E) Loans on Dwellings For 5+ Families
F) Non-occupant Loans on < 5 Family Dwellings (A B C & D)
G) Loans On Manufactured Home Dwelling (A B C & D)
Number
Average Value
Number
Average Value
Number
Average Value
Number
Average Value
Number
Average Value
Number
Average Value
Number
Average Value
LOANS ORIGINATED
7
$361,799
501
$251,725
925
$264,801
150
$162,770
18
$815,351
303
$309,717
5
$46,498
APPLICATIONS APPROVED, NOT ACCEPTED
0
$0
86
$300,089
200
$253,177
43
$96,812
4
$537,402
61
$314,721
0
$0
APPLICATIONS DENIED
4
$255,330
232
$269,390
488
$272,215
166
$105,701
5
$503,848
113
$282,842
0
$0
APPLICATIONS WITHDRAWN
0
$0
88
$239,675
461
$254,482
37
$133,082
7
$388,214
54
$316,367
0
$0
FILES CLOSED FOR INCOMPLETENESS
2
$450,690
26
$257,162
144
$279,611
10
$241,556
2
$355,840
17
$308,304
0
$0
Aggregated Statistics For Year 2003 (Based on 5 full and 10 partial tracts)
A) FHA, FSA/RHS & VA Home Purchase Loans
B) Conventional Home Purchase Loans
C) Refinancings
D) Home Improvement Loans
E) Loans on Dwellings For 5+ Families
F) Non-occupant Loans on < 5 Family Dwellings (A B C & D)
Number
Average Value
Number
Average Value
Number
Average Value
Number
Average Value
Number
Average Value
Number
Average Value
LOANS ORIGINATED
8
$380,662
271
$248,329
1,268
$219,529
71
$75,801
16
$880,628
299
$260,091
APPLICATIONS APPROVED, NOT ACCEPTED
4
$269,500
52
$223,329
265
$229,697
42
$71,895
0
$0
55
$249,140
APPLICATIONS DENIED
11
$325,277
117
$257,891
729
$227,730
117
$62,722
4
$375,705
108
$265,530
APPLICATIONS WITHDRAWN
2
$287,525
56
$241,041
330
$217,512
26
$76,909
3
$602,070
61
$241,031
FILES CLOSED FOR INCOMPLETENESS
0
$0
13
$263,022
46
$245,649
0
$0
0
$0
12
$250,418
Aggregated Statistics For Year 2002 (Based on 5 full and 10 partial tracts)
A) FHA, FSA/RHS & VA Home Purchase Loans
B) Conventional Home Purchase Loans
C) Refinancings
D) Home Improvement Loans
E) Loans on Dwellings For 5+ Families
F) Non-occupant Loans on < 5 Family Dwellings (A B C & D)
Number
Average Value
Number
Average Value
Number
Average Value
Number
Average Value
Number
Average Value
Number
Average Value
LOANS ORIGINATED
28
$323,901
249
$212,377
833
$195,760
107
$52,331
14
$742,944
238
$219,661
APPLICATIONS APPROVED, NOT ACCEPTED
15
$301,264
59
$231,759
188
$182,395
37
$44,062
2
$303,765
53
$195,594
APPLICATIONS DENIED
9
$323,304
64
$251,892
450
$196,261
158
$53,908
4
$418,302
99
$235,782
APPLICATIONS WITHDRAWN
7
$260,930
36
$247,251
267
$174,436
26
$55,157
4
$540,892
35
$219,522
FILES CLOSED FOR INCOMPLETENESS
0
$0
5
$220,210
118
$186,644
4
$52,750
0
$0
9
$239,022
Aggregated Statistics For Year 2001 (Based on 5 full and 10 partial tracts)
A) FHA, FSA/RHS & VA Home Purchase Loans
B) Conventional Home Purchase Loans
C) Refinancings
D) Home Improvement Loans
E) Loans on Dwellings For 5+ Families
F) Non-occupant Loans on < 5 Family Dwellings (A B C & D)
Number
Average Value
Number
Average Value
Number
Average Value
Number
Average Value
Number
Average Value
Number
Average Value
LOANS ORIGINATED
48
$240,361
231
$188,008
638
$168,911
91
$51,727
14
$560,879
182
$189,382
APPLICATIONS APPROVED, NOT ACCEPTED
4
$276,045
40
$176,660
133
$162,617
16
$42,314
2
$155,225
36
$194,768
APPLICATIONS DENIED
8
$264,061
70
$208,435
441
$142,471
142
$35,575
3
$249,840
71
$200,680
APPLICATIONS WITHDRAWN
5
$344,868
38
$174,905
200
$144,361
19
$39,511
1
$1,608,000
27
$163,499
FILES CLOSED FOR INCOMPLETENESS
1
$304,430
19
$140,569
75
$172,450
1
$146,630
0
$0
8
$218,919
Aggregated Statistics For Year 2000 (Based on 5 full and 10 partial tracts)
A) FHA, FSA/RHS & VA Home Purchase Loans
B) Conventional Home Purchase Loans
C) Refinancings
D) Home Improvement Loans
E) Loans on Dwellings For 5+ Families
F) Non-occupant Loans on < 5 Family Dwellings (A B C & D)
Number
Average Value
Number
Average Value
Number
Average Value
Number
Average Value
Number
Average Value
Number
Average Value
LOANS ORIGINATED
47
$223,771
166
$150,429
286
$137,383
67
$33,122
11
$352,371
102
$149,247
APPLICATIONS APPROVED, NOT ACCEPTED
8
$161,306
39
$147,678
93
$156,626
43
$33,301
0
$0
47
$156,955
APPLICATIONS DENIED
23
$195,133
100
$142,914
309
$112,648
192
$32,014
6
$393,980
64
$133,948
APPLICATIONS WITHDRAWN
4
$175,245
50
$125,644
169
$100,734
15
$71,284
5
$100,472
18
$159,101
FILES CLOSED FOR INCOMPLETENESS
3
$183,630
16
$133,066
58
$140,342
8
$19,132
0
$0
6
$161,770
Aggregated Statistics For Year 1999 (Based on 5 full and 5 partial tracts)
A) FHA, FSA/RHS & VA Home Purchase Loans
B) Conventional Home Purchase Loans
C) Refinancings
D) Home Improvement Loans
E) Loans on Dwellings For 5+ Families
F) Non-occupant Loans on < 5 Family Dwellings (A B C & D)
2002 - 2018 National Fire Incident Reporting System (NFIRS) incidents
Based on the data from the years 2002 - 2018 the average number of fires per year is 276. The highest number of fire incidents - 368 took place in 2014, and the least - 142 in 2002. The data has a growing trend.
When looking into fire subcategories, the most incidents belonged to: Structure Fires (74.9%), and Outside Fires (13.8%).
Fire incident types reported to NFIRS in Zip Code 02121


 Nearest zip codes: 02119, 02124, 02120, 02130, 02125, 02126.


 Based on the data from the years 2002 - 2018 the average number of fires per year is 276. The highest number of fire incidents - 368 took place in 2014, and the least - 142 in 2002. The data has a growing trend.
 When looking into fire subcategories, the most incidents belonged to: Structure Fires (74.9%), and Outside Fires (13.8%).