Estimated zip code population in 2022: 55,318 Zip code population in 2010: 47,783 Zip code population in 2000: 50,781
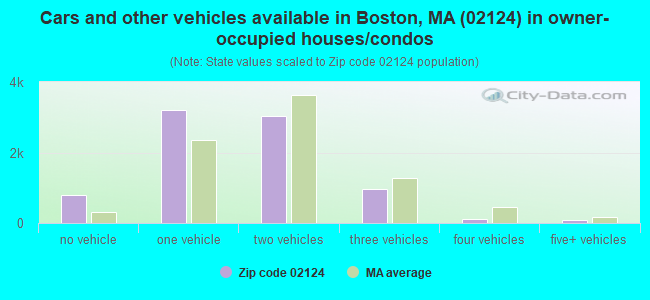
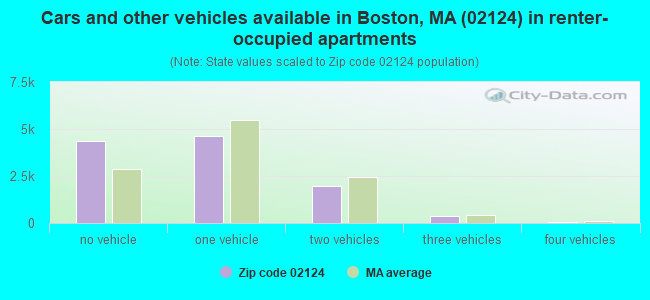
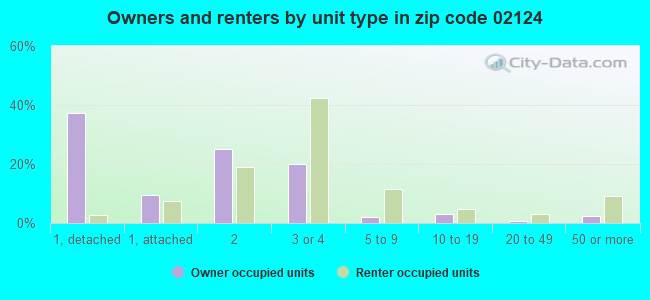
Houses and condos: 20,892 Renter-occupied apartments: 11,427
% of renters here:
58%
State:
38%
March 2022 cost of living index in zip code 02124: 138.2 (high, U.S. average is 100)
Land area: 3.0 sq. mi. Water area: 0.1 sq. mi.
Population density: 18,423 people per square mile
(very high).
OSM Map
Google Map
MSN Map
OSM Map
General Map
Google Map
MSN Map
OSM Map
Google Map
MSN Map
OSM Map
Google Map
MSN Map
Please wait while loading the map...
Real estate property taxes paid for housing units in 2022:
This zip code:
0.5% ($3,095)
Massachusetts:
1.0% ($5,536)
Median real estate property taxes paid for housing units with mortgages in 2022: $3,263 (0.5%) Median real estate property taxes paid for housing units with no mortgage in 2022: $2,700 (0.4%)
Averages for the 2020 tax year for zip code 02124, filed in 2021:
Average Adjusted Gross Income (AGI) in 2020: $53,767 (Individual Income Tax Returns)
Here:
$53,767
State:
$105,130
Salary/wage: $48,997 (reported on 86.0% of returns)
Here:
$48,997
State:
$82,951
(% of AGI for various income ranges: 1080.0% for AGIs below $25k, 3580.6% for AGIs $25k-50k, 6805.4% for AGIs $50k-75k, 10719.3% for AGIs $75k-100k, 19071.9% for AGIs $100k-200k, 64809.2% for AGIs over 200k)
Taxable interest for individuals: $594 (reported on 20.1% of returns)
This zip code:
$594
Massachusetts:
$2,361
(% of AGI for various income ranges: 4.7% for AGIs below $25k, 5.3% for AGIs $25k-50k, 13.6% for AGIs $50k-75k, 32.3% for AGIs $75k-100k, 45.8% for AGIs $100k-200k, 370.0% for AGIs over 200k)
Ordinary dividends: $2,619 (reported on 9.0% of returns)
Here:
$2,619
State:
$10,365
(% of AGI for various income ranges: 4.8% for AGIs below $25k, 5.3% for AGIs $25k-50k, 21.6% for AGIs $50k-75k, 54.2% for AGIs $75k-100k, 114.0% for AGIs $100k-200k, 958.1% for AGIs over 200k)
Net capital gain/loss in AGI: +$13,605 (reported on 8.5% of returns)
Here:
+$13,605
State:
+$48,178
(% of AGI for various income ranges: 3.4% for AGIs below $25k, 9.8% for AGIs $25k-50k, 30.7% for AGIs $50k-75k, 98.8% for AGIs $75k-100k, 317.6% for AGIs $100k-200k, 8715.8% for AGIs over 200k)
Profit/loss from business: +$7,637 (reported on 14.9% of returns)
Here:
+$7,637
State:
+$20,792
(% of AGI for various income ranges: 79.3% for AGIs below $25k, 82.9% for AGIs $25k-50k, 101.8% for AGIs $50k-75k, 204.0% for AGIs $75k-100k, 449.7% for AGIs $100k-200k, 2733.1% for AGIs over 200k)
Taxable individual retirement arrangement distribution: $17,007 (reported on 3.1% of returns)
02124:
$17,007
Massachusetts:
$22,790
(% of AGI for various income ranges: 20.1% for AGIs below $25k, 23.0% for AGIs $25k-50k, 54.8% for AGIs $50k-75k, 135.9% for AGIs $75k-100k, 318.8% for AGIs $100k-200k, 1058.1% for AGIs over 200k)
Self-employed (Keogh) retirement plans: $19,450 (reported on 0.2% of returns)
02124:
$19,450
Massachusetts:
$26,868
(% of AGI for various income ranges: 7.2% for AGIs $50k-75k, 360.0% for AGIs over 200k)
Total itemized deductions: $25,938 (reported on 7.9% of returns)
Here:
$25,938
State:
$36,722
(% of AGI for various income ranges: 34.2% for AGIs below $25k, 67.2% for AGIs $25k-50k, 241.1% for AGIs $50k-75k, 521.3% for AGIs $75k-100k, 1363.8% for AGIs $100k-200k, 4974.6% for AGIs over 200k)
Charity contributions: $5,476 (reported on 6.2% of returns)
Here:
$5,476
State:
$12,529
(% of AGI for various income ranges: 2.9% for AGIs below $25k, 12.3% for AGIs $25k-50k, 36.6% for AGIs $50k-75k, 81.4% for AGIs $75k-100k, 218.2% for AGIs $100k-200k, 973.8% for AGIs over 200k)
Taxes paid: $7,363 (reported on 7.9% of returns)
02124:
$7,363
State:
$8,782
(% of AGI for various income ranges: 5.6% for AGIs below $25k, 13.2% for AGIs $25k-50k, 57.1% for AGIs $50k-75k, 156.6% for AGIs $75k-100k, 437.0% for AGIs $100k-200k, 1445.0% for AGIs over 200k)
Earned income credit: $2,138 (reported on 20.1% of returns)
Here:
$2,138
State:
$1,909
(% of AGI for various income ranges: 103.2% for AGIs below $25k, 73.9% for AGIs $25k-50k, 0.4% for AGIs $50k-75k)
Percentage of individuals using paid preparers for their 2020 taxes: 91.7%
Here:
92%
State:
92%
(% for various income ranges: 90.4% for AGIs below $25k, 92.8% for AGIs $25k-50k, 92.2% for AGIs $50k-75k, 90.7% for AGIs $75k-100k, 92.0% for AGIs $100k-200k, 94.4% for AGIs over 200k)
Averages for the 2012 tax year for zip code 02124, filed in 2013:
Average Adjusted Gross Income (AGI) in 2012: $39,007 (Individual Income Tax Returns)
Here:
$39,007
State:
$81,425
Salary/wage: $37,513 (reported on 89.2% of returns)
Here:
$37,513
State:
$64,752
(% of AGI for various income ranges: 79.4% for AGIs below $25k, 90.6% for AGIs $25k-50k, 88.2% for AGIs $50k-75k, 86.1% for AGIs $75k-100k, 85.6% for AGIs $100k-200k, 69.5% for AGIs over 200k)
Taxable interest for individuals: $485 (reported on 20.2% of returns)
This zip code:
$485
Massachusetts:
$2,136
(% of AGI for various income ranges: 0.3% for AGIs below $25k, 0.2% for AGIs $25k-50k, 0.2% for AGIs $50k-75k, 0.2% for AGIs $75k-100k, 0.3% for AGIs $100k-200k, 0.7% for AGIs over 200k)
Ordinary dividends: $2,421 (reported on 7.5% of returns)
Here:
$2,421
State:
$9,473
(% of AGI for various income ranges: 0.5% for AGIs below $25k, 0.3% for AGIs $25k-50k, 0.3% for AGIs $50k-75k, 0.3% for AGIs $75k-100k, 0.7% for AGIs $100k-200k, 1.1% for AGIs over 200k)
Net capital gain/loss in AGI: +$3,851 (reported on 5.0% of returns)
Here:
+$3,851
State:
+$31,437
(% of AGI for various income ranges: 0.2% for AGIs $50k-75k, 0.2% for AGIs $75k-100k, 0.6% for AGIs $100k-200k, 5.2% for AGIs over 200k)
Profit/loss from business: +$9,881 (reported on 11.2% of returns)
Here:
+$9,881
State:
+$20,662
(% of AGI for various income ranges: 8.5% for AGIs below $25k, 2.0% for AGIs $25k-50k, 1.7% for AGIs $50k-75k, 1.7% for AGIs $75k-100k, 2.0% for AGIs $100k-200k, 2.5% for AGIs over 200k)
Taxable individual retirement arrangement distribution: $14,153 (reported on 3.9% of returns)
02124:
$14,153
Massachusetts:
$18,892
(% of AGI for various income ranges: 1.1% for AGIs below $25k, 0.7% for AGIs $25k-50k, 1.3% for AGIs $50k-75k, 1.6% for AGIs $75k-100k, 1.6% for AGIs $100k-200k, 5.3% for AGIs over 200k)
Self-employment retirement plans: $13,000 (reported on 0.1% of returns)
02124:
$13,000
Massachusetts:
$20,669
Total itemized deductions: $18,229 (23% of AGI, reported on 21.3% of returns)
Here:
$18,229
State:
$28,907
Here:
23.1% of AGI
State:
18.2% of AGI
(% of AGI for various income ranges: 5.4% for AGIs below $25k, 6.4% for AGIs $25k-50k, 10.7% for AGIs $50k-75k, 12.8% for AGIs $75k-100k, 15.0% for AGIs $100k-200k, 12.7% for AGIs over 200k)
Charity contributions: $2,818 (reported on 17.3% of returns)
Here:
$2,818
State:
$4,208
(% of AGI for various income ranges: 0.5% for AGIs below $25k, 0.9% for AGIs $25k-50k, 1.4% for AGIs $50k-75k, 1.7% for AGIs $75k-100k, 1.8% for AGIs $100k-200k, 1.6% for AGIs over 200k)
Taxes paid: $5,732 (reported on 21.3% of returns)
02124:
$5,732
State:
$13,303
(% of AGI for various income ranges: 0.9% for AGIs below $25k, 1.4% for AGIs $25k-50k, 3.1% for AGIs $50k-75k, 4.2% for AGIs $75k-100k, 5.7% for AGIs $100k-200k, 6.0% for AGIs over 200k)
Earned income credit: $2,214 (reported on 27.7% of returns)
Here:
$2,214
State:
$1,971
(% of AGI for various income ranges: 8.8% for AGIs below $25k, 1.2% for AGIs $25k-50k)
Percentage of individuals using paid preparers for their 2012 taxes: 56.0%
Here:
56%
State:
56%
(% for various income ranges: 54.0% for AGIs below $25k, 54.1% for AGIs $25k-50k, 58.6% for AGIs $50k-75k, 62.2% for AGIs $75k-100k, 65.9% for AGIs $100k-200k, 78.9% for AGIs over 200k)
Averages for the 2004 tax year for zip code 02124, filed in 2005:
Average Adjusted Gross Income (AGI) in 2004: $33,684 (Individual Income Tax Returns)
Here:
$33,684
State:
$62,877
Salary/wage: $33,296 (reported on 89.9% of returns)
Here:
$33,296
State:
$52,969
(% of AGI for various income ranges: 110.3% for AGIs below $10k, 86.9% for AGIs $10k-25k, 93.4% for AGIs $25k-50k, 90.7% for AGIs $50k-75k, 90.1% for AGIs $75k-100k, 75.3% for AGIs over 100k)
Taxable interest for individuals: $628 (reported on 31.3% of returns)
This zip code:
$628
Massachusetts:
$1,945
(% of AGI for various income ranges: 1.8% for AGIs below $10k, 0.6% for AGIs $10k-25k, 0.5% for AGIs $25k-50k, 0.6% for AGIs $50k-75k, 0.6% for AGIs $75k-100k, 0.6% for AGIs over 100k)
Taxable dividends: $1,415 (reported on 10.1% of returns)
Here:
$1,415
State:
$5,323
(% of AGI for various income ranges: 1.0% for AGIs below $10k, 0.3% for AGIs $10k-25k, 0.2% for AGIs $25k-50k, 0.4% for AGIs $50k-75k, 0.4% for AGIs $75k-100k, 1.0% for AGIs over 100k)
Net capital gain/loss: +$9,697 (reported on 7.1% of returns)
Here:
+$9,697
State:
+$20,377
(% of AGI for various income ranges: -0.6% for AGIs below $10k, 0.1% for AGIs $10k-25k, 0.2% for AGIs $25k-50k, 0.5% for AGIs $50k-75k, 0.8% for AGIs $75k-100k, 10.5% for AGIs over 100k)
Profit/loss from business: +$8,104 (reported on 10.5% of returns)
Here:
+$8,104
State:
+$17,837
(% of AGI for various income ranges: 12.7% for AGIs below $10k, 4.5% for AGIs $10k-25k, 1.5% for AGIs $25k-50k, 1.5% for AGIs $50k-75k, 2.0% for AGIs $75k-100k, 3.1% for AGIs over 100k)
IRA payment deduction: $2,423 (reported on 1.3% of returns)
02124:
$2,423
Massachusetts:
$3,100
(% of AGI for various income ranges: 0.1% for AGIs below $10k, 0.1% for AGIs $10k-25k, 0.1% for AGIs $25k-50k, 0.1% for AGIs $50k-75k, 0.1% for AGIs $75k-100k, 0.0% for AGIs over 100k)
Self-employed pension: $9,455 (reported on 0.3% of returns)
Here:
$9,455
Massachusetts:
$14,516
Total itemized deductions: $16,202 (26% of AGI, reported on 25.6% of returns)
Here:
$16,202
State:
$22,573
Here:
26.2% of AGI
State:
19.5% of AGI
(% of AGI for various income ranges: 10.8% for AGIs below $10k, 7.5% for AGIs $10k-25k, 10.1% for AGIs $25k-50k, 14.2% for AGIs $50k-75k, 16.9% for AGIs $75k-100k, 15.5% for AGIs over 100k)
Charity contributions deductions: $2,834 (4% of AGI, reported on 22.4% of returns)
Here:
$2,834
State:
$3,295
Here:
4.4% of AGI
State:
2.7% of AGI
(% of AGI for various income ranges: 0.6% for AGIs below $10k, 1.0% for AGIs $10k-25k, 1.6% for AGIs $25k-50k, 2.3% for AGIs $50k-75k, 2.5% for AGIs $75k-100k, 2.5% for AGIs over 100k)
Total tax: $4,423 (reported on 69.0% of returns)
02124:
$4,423
State:
$11,494
(% of AGI for various income ranges: 3.1% for AGIs below $10k, 3.6% for AGIs $10k-25k, 6.9% for AGIs $25k-50k, 10.1% for AGIs $50k-75k, 11.3% for AGIs $75k-100k, 15.9% for AGIs over 100k)
Earned income credit: $1,702 (reported on 24.7% of returns)
Here:
$1,702
State:
$1,518
Percentage of individuals using paid preparers for their 2004 taxes: 63.9%
Here:
64%
State:
58%
(% for various income ranges: 60.6% for AGIs below $10k, 65.5% for AGIs $10k-25k, 62.6% for AGIs $25k-50k, 64.8% for AGIs $50k-75k, 67.3% for AGIs $75k-100k, 72.8% for AGIs over 100k)
Likely homosexual households (counted as self-reported same-sex unmarried-partner households)
Lesbian couples: 0.3% of all households
Gay men: 0.4% of all households
Household received Food Stamps/SNAP in the past 12 months: 7,422 Household did not receive Food Stamps/SNAP in the past 12 months: 12,962
Women who had a birth in the past 12 months: 511 (220 now married, 260 unmarried) Women who did not have a birth in the past 12 months: 14,400 (3,974 now married, 10,507 unmarried)
Housing units in zip code 02124 with a mortgage: 5,823 (971 second mortgage, 43 home equity loan, 704 both second mortgage and home equity loan) Houses without a mortgage: 28
Median monthly owner costs for units with a mortgage: $2,605 Median monthly owner costs for units without a mortgage: $885
Residents with income below the poverty level in 2022:
This zip code:
18.4%
Whole state:
10.4%
Residents with income below 50% of the poverty level in 2022:
This zip code:
8.8%
Whole state:
5.1%
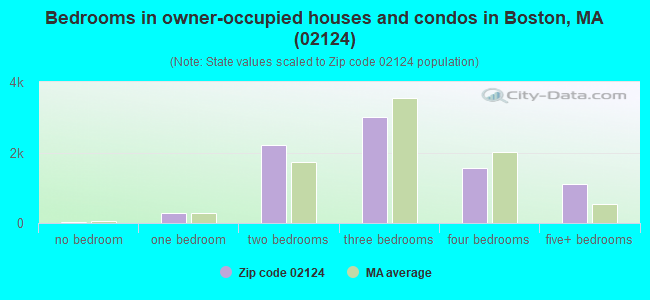
Median number of rooms in houses and condos:
Here:
6.2
State:
6.5
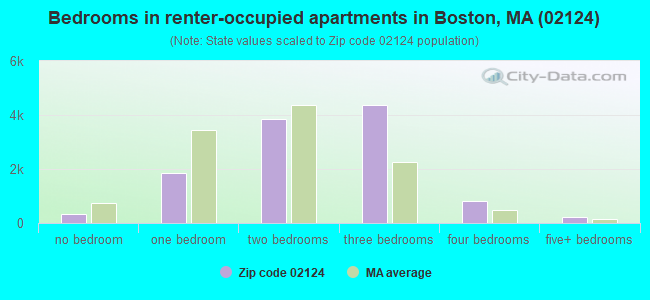
Median number of rooms in apartments:
Here:
4.7
State:
4.0
Notable locations in this zip code not listed on our city pages
Notable locations in zip code 02124: Morton Street Station (A), Ashmont Station (B), Boston Fire Department Station 16 Mattapan (C), Boston Fire Department Station 52 Mattapan (D), Boston Fire Department Station 18 Ashmont - Dorchester (E), Helen Stubblefield Law Library (F), Colpoys Library (G), Monsignor Ryan Memorial High School Library (H). Display/hide their locations on the map
Churches in zip code 02124 include: Vietnamese Alliance Church of Boston (A), Greenwood Memorial United Methodist Church (B), First Baptist Church in Dorchester (C), New Jerusalem Evangelical Baptist Church (D). Display/hide their locations on the map
4,080 married couples with children.
5,763 single-parent households (780 men, 4,983 women).
62.9% of residents of 02124 zip code speak English at home.
15.2% of residents speak Spanish at home (53% very well, 17% well, 19% not well, 12% not at all).
13.3% of residents speak other Indo-European language at home (52% very well, 23% well, 19% not well, 6% not at all).
5.6% of residents speak Asian or Pacific Island language at home (30% very well, 27% well, 29% not well, 14% not at all).
3.0% of residents speak other language at home (85% very well, 5% well, 11% not well).
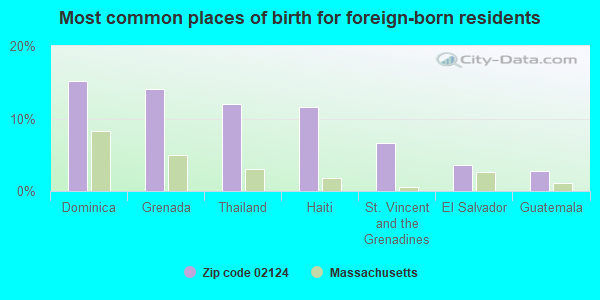
Foreign born population: 18,059 (32.6%) (64.3% of them are naturalized citizens)
This zip code:
32.6%
Whole state:
18.0%
15%Dominica
14%Grenada
12%Thailand
12%Haiti
7%St. Vincent and the Grenadines
4%El Salvador
3%Guatemala
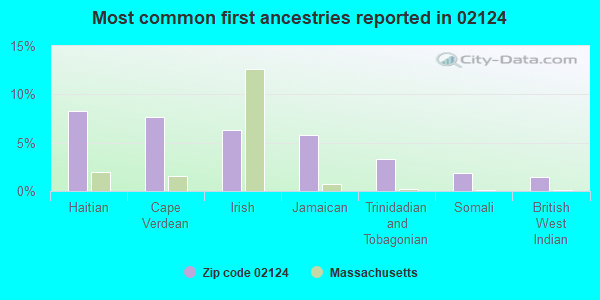
8%Haitian
8%Cape Verdean
6%Irish
6%Jamaican
3%Trinidadian and Tobagonian
2%Somali
1%British West Indian
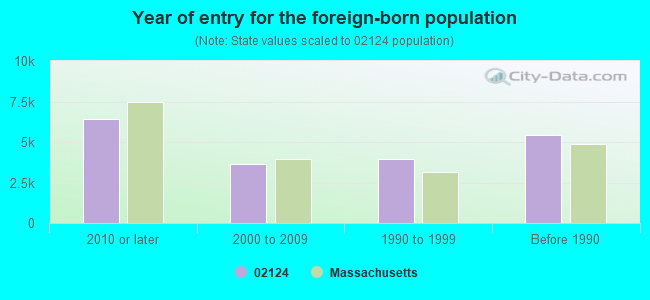
Year of entry for the foreign-born population
6,4142010 or later
3,6172000 to 2009
3,9771990 to 1999
5,459Before 1990
Private high school in in this zip code not listed on the city page:
ELIZABETH SETON ACADEMY (Students: 95, Location: 2220 DORCHESTER AVE, Grades: 9-12, Girls only)
Private elementary/middle schools in in this zip code not listed on the city page:
ST BRENDAN SCHOOL (Students: 217, Location: 29 RITA RD, Grades: PK-6)
EPIPHANY SCHOOL (Students: 84, Location: 154 CENTRE ST, Grades: 5-8)
WESLEY CHILD CARE CENTER (Students: 57, Location: 29 STANTON ST, Grades: PK-5)
Major facilities with environmental interests located in this zip code:
NEIGHBORHOOD HOUSE CHARTER SCH (197A CENTRE STREET in DORCHESTER, MA)
(National Center for Education Statistics) - STATE ID-444205
DORCHESTER HIGH (9 PEACEVALE ROAD in DORCHESTER, MA)
(National Center for Education Statistics) - STATE ID-035520 Organizations: BOSTON (SCHOOL DISTRICT)
CODMAN ACADEMY CHARTER SCHOOL (637 WASHINGTON STREET in DORCHESTER, MA)
(National Center for Education Statistics) - STATE ID-438505
O W HOLMES (40 SCHOOL STREET in DORCHESTER, MA)
(National Center for Education Statistics) - STATE ID-035138 Organizations: BOSTON (SCHOOL DISTRICT)
BOSTON MIDDLE SCHOOL ACADEMY (150 AMERICAN LEGION HWY in DORCHESTER, MA)
(National Center for Education Statistics) - STATE ID-035413
PAULINE AGASSIZ SHAW (429 NORFOLK STREET in DORCHESTER, MA)
(National Center for Education Statistics) - STATE ID-035270 Organizations: BOSTON (SCHOOL DISTRICT)
EMILY A FIFIELD (25 DUNBAR AVENUE in DORCHESTER, MA)
(National Center for Education Statistics) - STATE ID-035102 Organizations: BOSTON (SCHOOL DISTRICT)
JOHN MARSHALL (35 WESTVILLE STREET in DORCHESTER, MA)
(National Center for Education Statistics) - STATE ID-035178 Organizations: BOSTON (SCHOOL DISTRICT)
JOSEPH LEE (155 TALBOT AVENUE in DORCHESTER, MA)
(National Center for Education Statistics) - STATE ID-035183 Organizations: BOSTON (SCHOOL DISTRICT)
LUCY STONE (22 REGINA ROAD in DORCHESTER, MA)
(National Center for Education Statistics) - STATE ID-035211 Organizations: BOSTON (SCHOOL DISTRICT)
CITY CLEANERS INCORPORATED (1158 BLUE HILL AVENUE in BOSTON, MA)
AIR MINOR (AIRS/AFS) CRITERIA AND HAZARDOUS AIR POLLUTANT INVENTORY (Inventory of air pollution sources) Conditionally Exempt Small Quantity Generators, less than 100 kg/month of hazardous waste (Resource Conservation and Recovery Act (tracking hazardous waste)) - notification Business SIC classification: GARMENT PRESSING, AND AGENTS FOR LAUNDRIES AND DRYCLEANERS Alternative names: CITY CLEANSERS
EASTOVER TRANSPORTATION CO (919 WASHINGTON ST in BOSTON, MA)
(Resource Conservation and Recovery Act (tracking hazardous waste)) Organizations: CLARA M SCOTT (CONTACT/OWNER)
MOBIL OIL CORP 01-083 (10 GRANITE AVE in BOSTON, MA)
(Resource Conservation and Recovery Act (tracking hazardous waste)) Organizations: MOBIL OIL CORPORATION (CONTACT/OWNER)
Alternative names: MOBIL OIL CORP SS 083
Housing units lacking complete plumbing facilities: 0.5% Housing units lacking complete kitchen facilities: 1.7%
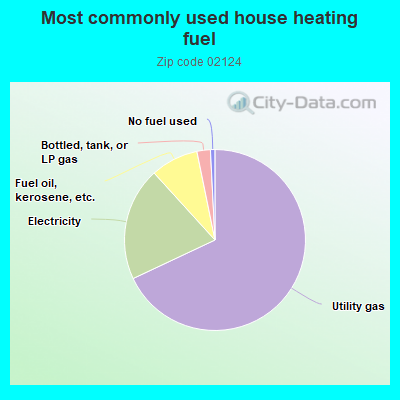
67.8%Utility gas
20.2%Electricity
8.5%Fuel oil, kerosene, etc.
2.4%Bottled, tank, or LP gas
0.8%No fuel used
Population in 1990: 48,560. Population change in the 1990s: +2,221 (+4.6%).
Place of birth for U.S.-born residents:
This state: 28,241
Northeast: 2,531
Midwest: 601
South: 4,003
West: 576
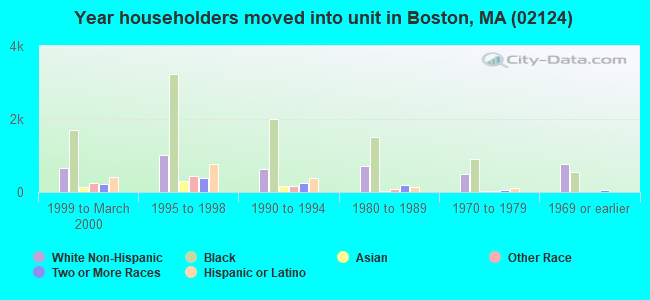
61% of the 02124 zip code residents lived in the same house 5 years ago. Out of people who lived in different houses, 76% lived in this county. Out of people who lived in different counties, 50% lived in Massachusetts.
87% of the 02124 zip code residents lived in the same house 1 year ago. Out of people who lived in different houses, 53% moved from this county. Out of people who lived in different houses, 23% moved from different county within same state. Out of people who lived in different houses, 15% moved from different state. Out of people who lived in different houses, 6% moved from abroad.
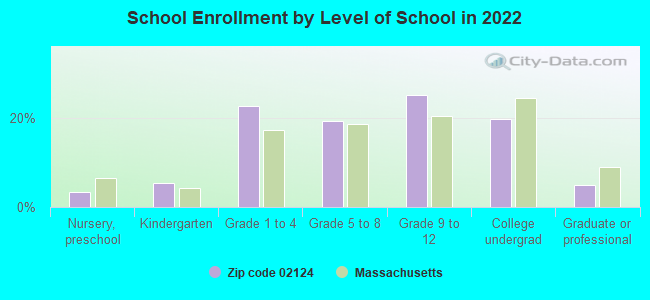
Private vs. public school enrollment:
Students in private schools in grades 1 to 8 (elementary and middle school): 458
Here:
7.8%
Massachusetts:
10.3%
Students in private schools in grades 9 to 12 (high school): 353
Here:
9.9%
Massachusetts:
12.3%
Students in private undergraduate colleges: 1,143
Here:
41.2%
Massachusetts:
51.2%
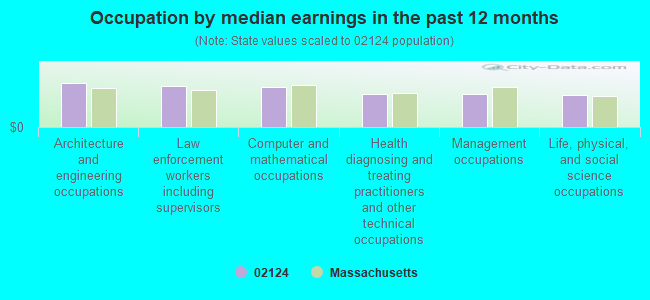
Occupation by median earnings in the past 12 months ($)
113,858Architecture and engineering occupations
107,231Law enforcement workers including supervisors
102,541Computer and mathematical occupations
84,653Health diagnosing and treating practitioners and other technical occupations
84,624Management occupations
83,169Life, physical, and social science occupations
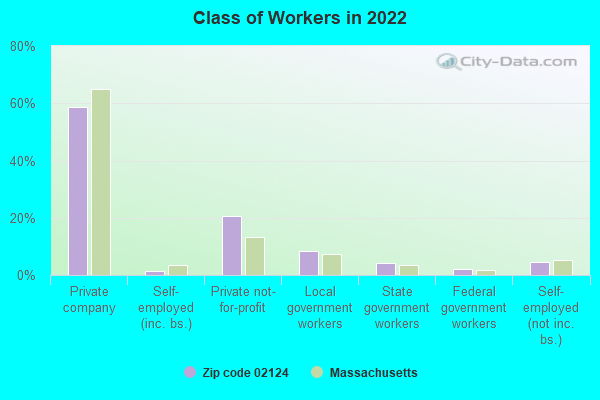
Companies with federal contracts located in this zip code:
GOOD FAITH OFFICE CLEANING (11 in BOSTON, MA; small business) : $38,832 in 13 contractsfrom 2002 to 2006
Contracts for Custodial Janitorial Services by Army, Air Force Signed by year:2000: $0; 2001: $0; 2002: $12,198; 2003: $6,584; 2004: $8,010; 2005: $6,468; 2006: $5,572.
Biggest contracts:
$6,480 with Army for Custodial Janitorial Services. Signed on 2002-07-16. Completion date: 2003-08-31.
$6,468 with Air Force for Custodial Janitorial Services. Signed on 2005-05-01. Completion date: 2006-04-30.
$6,336 with Army for Custodial Janitorial Services. Signed on 2003-07-08. Completion date: 2004-08-31.
$4,620, same as above.Signed on 2004-11-23. Completion date: 2006-01-15.
BOSTON ELECTRIC AND TELEPHONE (1854 DORCHESTER AVE in BOSTON, MA; small business)
$14,250 with U.S. Army Corps of Engineers - civil program financing only for Maintenance, Repair or Alteration of Real Property -- Other Administrative Facilities and Service Buildings. Signed on 2002-09-17. Completion date: 2002-10-04.
ASEC CORPORATION (100 HALLET STREET in BOSTON, MA; small business)
$2,316 with U.S. Army Corps of Engineers - civil program financing only for Land Surveys, Cadastral Services (non-construction). Signed on 2002-04-18. Completion date: 2002-05-03.
Top industries in this zip code by the number of employees in 2005:
Health Care and Social Assistance: General Medical and Surgical Hospitals (over 1000 employees: 1 establishment)
Health Care and Social Assistance: Child Day Care Services (50-99: 1, 20-49: 4, 10-19: 6, 5-9: 2, 1-4: 7)
Health Care and Social Assistance: All Other Outpatient Care Centers (100-249: 1, 50-99: 1)
Health Care and Social Assistance: Offices of Physicians (except Mental Health Specialists) (100-249: 1, 10-19: 2, 5-9: 2, 1-4: 14)
2002 - 2018 National Fire Incident Reporting System (NFIRS) incidents
Based on the data from the years 2002 - 2018 the average number of fire incidents per year is 348. The highest number of fire incidents - 468 took place in 2010, and the least - 237 in 2006. The data has a rising trend.
When looking into fire subcategories, the most incidents belonged to: Structure Fires (65.0%), and Outside Fires (19.6%).
Fire incident types reported to NFIRS in Zip Code 02124


 Nearest zip codes: 02121, 02126, 02122, 02125, 02119, 02186.
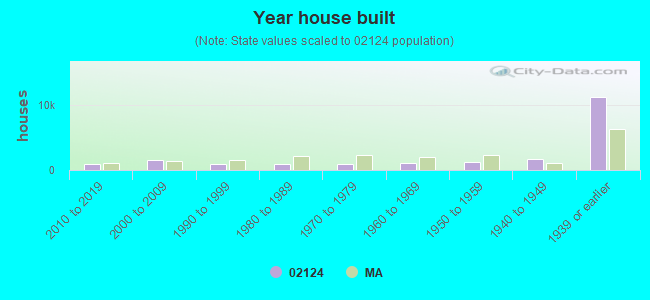


 (Students: 95, Location: 2220 DORCHESTER AVE, Grades: 9-12, Girls only)

 Based on the data from the years 2002 - 2018 the average number of fire incidents per year is 348. The highest number of fire incidents - 468 took place in 2010, and the least - 237 in 2006. The data has a rising trend.
 When looking into fire subcategories, the most incidents belonged to: Structure Fires (65.0%), and Outside Fires (19.6%).