Estimated zip code population in 2022: 31,892 Zip code population in 2010: 33,295 Zip code population in 2000: 33,618
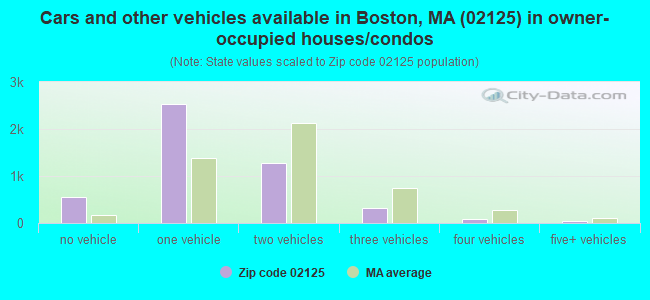
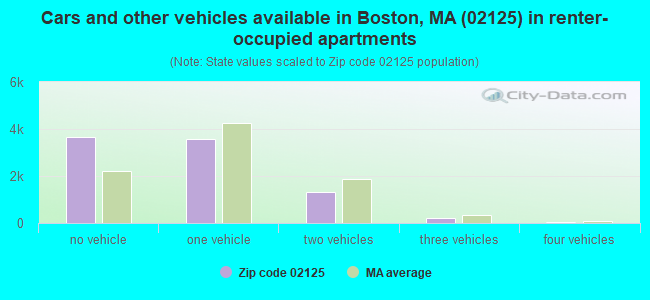
Houses and condos: 15,003 Renter-occupied apartments: 8,842
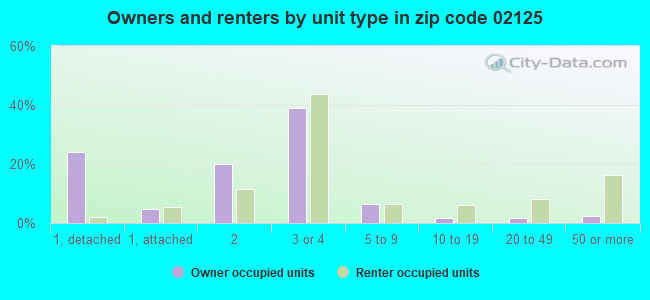
% of renters here:
65%
State:
38%
March 2022 cost of living index in zip code 02125: 141.4 (very high, U.S. average is 100)
Land area: 2.1 sq. mi. Water area: 0.3 sq. mi.
Population density: 14,953 people per square mile
(very high).
OSM Map
Google Map
MSN Map
OSM Map
General Map
Google Map
MSN Map
OSM Map
Google Map
MSN Map
OSM Map
Google Map
MSN Map
Please wait while loading the map...
Real estate property taxes paid for housing units in 2022:
This zip code:
0.5% ($3,183)
Massachusetts:
1.0% ($5,536)
Median real estate property taxes paid for housing units with mortgages in 2022: $2,963 (0.4%) Median real estate property taxes paid for housing units with no mortgage in 2022: $3,494 (0.5%)
Averages for the 2020 tax year for zip code 02125, filed in 2021:
Average Adjusted Gross Income (AGI) in 2020: $58,295 (Individual Income Tax Returns)
Here:
$58,295
State:
$105,130
Salary/wage: $54,060 (reported on 88.7% of returns)
Here:
$54,060
State:
$82,951
(% of AGI for various income ranges: 1156.2% for AGIs below $25k, 3635.4% for AGIs $25k-50k, 6990.9% for AGIs $50k-75k, 10954.3% for AGIs $75k-100k, 19152.6% for AGIs $100k-200k, 83182.2% for AGIs over 200k)
Taxable interest for individuals: $555 (reported on 21.0% of returns)
This zip code:
$555
Massachusetts:
$2,361
(% of AGI for various income ranges: 4.9% for AGIs below $25k, 4.7% for AGIs $25k-50k, 14.3% for AGIs $50k-75k, 16.4% for AGIs $75k-100k, 47.0% for AGIs $100k-200k, 353.9% for AGIs over 200k)
Ordinary dividends: $2,203 (reported on 12.6% of returns)
Here:
$2,203
State:
$10,365
(% of AGI for various income ranges: 5.2% for AGIs below $25k, 6.2% for AGIs $25k-50k, 13.7% for AGIs $50k-75k, 37.7% for AGIs $75k-100k, 152.9% for AGIs $100k-200k, 1150.6% for AGIs over 200k)
Net capital gain/loss in AGI: +$12,805 (reported on 13.1% of returns)
Here:
+$12,805
State:
+$48,178
(% of AGI for various income ranges: 5.2% for AGIs below $25k, 19.0% for AGIs $25k-50k, 32.4% for AGIs $50k-75k, 85.5% for AGIs $75k-100k, 399.8% for AGIs $100k-200k, 12788.9% for AGIs over 200k)
Profit/loss from business: +$10,464 (reported on 13.3% of returns)
Here:
+$10,464
State:
+$20,792
(% of AGI for various income ranges: 92.5% for AGIs below $25k, 99.0% for AGIs $25k-50k, 120.2% for AGIs $50k-75k, 275.0% for AGIs $75k-100k, 452.5% for AGIs $100k-200k, 3344.4% for AGIs over 200k)
Taxable individual retirement arrangement distribution: $14,855 (reported on 2.2% of returns)
02125:
$14,855
Massachusetts:
$22,790
(% of AGI for various income ranges: 14.2% for AGIs below $25k, 15.1% for AGIs $25k-50k, 28.3% for AGIs $50k-75k, 67.0% for AGIs $75k-100k, 136.9% for AGIs $100k-200k, 950.0% for AGIs over 200k)
Self-employed (Keogh) retirement plans: $19,840 (reported on 0.3% of returns)
02125:
$19,840
Massachusetts:
$26,868
(% of AGI for various income ranges: 36.5% for AGIs $75k-100k, 320.0% for AGIs over 200k)
Total itemized deductions: $25,369 (reported on 6.7% of returns)
Here:
$25,369
State:
$36,722
(% of AGI for various income ranges: 19.0% for AGIs below $25k, 38.7% for AGIs $25k-50k, 140.7% for AGIs $50k-75k, 336.8% for AGIs $75k-100k, 1001.9% for AGIs $100k-200k, 5484.4% for AGIs over 200k)
Charity contributions: $4,537 (reported on 5.0% of returns)
Here:
$4,537
State:
$12,529
(% of AGI for various income ranges: 1.0% for AGIs below $25k, 5.2% for AGIs $25k-50k, 18.9% for AGIs $50k-75k, 46.6% for AGIs $75k-100k, 132.2% for AGIs $100k-200k, 733.9% for AGIs over 200k)
Taxes paid: $8,018 (reported on 6.7% of returns)
02125:
$8,018
State:
$8,782
(% of AGI for various income ranges: 4.4% for AGIs below $25k, 8.3% for AGIs $25k-50k, 35.7% for AGIs $50k-75k, 105.4% for AGIs $75k-100k, 378.1% for AGIs $100k-200k, 1606.7% for AGIs over 200k)
Earned income credit: $2,069 (reported on 16.6% of returns)
Here:
$2,069
State:
$1,909
(% of AGI for various income ranges: 87.6% for AGIs below $25k, 63.4% for AGIs $25k-50k)
Percentage of individuals using paid preparers for their 2020 taxes: 93.2%
Here:
93%
State:
92%
(% for various income ranges: 91.4% for AGIs below $25k, 93.3% for AGIs $25k-50k, 94.1% for AGIs $50k-75k, 93.9% for AGIs $75k-100k, 94.6% for AGIs $100k-200k, 96.5% for AGIs over 200k)
Averages for the 2012 tax year for zip code 02125, filed in 2013:
Average Adjusted Gross Income (AGI) in 2012: $39,887 (Individual Income Tax Returns)
Here:
$39,887
State:
$81,425
Salary/wage: $37,558 (reported on 89.9% of returns)
Here:
$37,558
State:
$64,752
(% of AGI for various income ranges: 81.6% for AGIs below $25k, 91.9% for AGIs $25k-50k, 91.4% for AGIs $50k-75k, 89.1% for AGIs $75k-100k, 86.8% for AGIs $100k-200k, 45.3% for AGIs over 200k)
Taxable interest for individuals: $559 (reported on 20.0% of returns)
This zip code:
$559
Massachusetts:
$2,136
(% of AGI for various income ranges: 0.2% for AGIs below $25k, 0.1% for AGIs $25k-50k, 0.2% for AGIs $50k-75k, 0.3% for AGIs $75k-100k, 0.4% for AGIs $100k-200k, 0.8% for AGIs over 200k)
Ordinary dividends: $3,133 (reported on 7.9% of returns)
Here:
$3,133
State:
$9,473
(% of AGI for various income ranges: 0.6% for AGIs below $25k, 0.3% for AGIs $25k-50k, 0.3% for AGIs $50k-75k, 0.5% for AGIs $75k-100k, 0.6% for AGIs $100k-200k, 2.4% for AGIs over 200k)
Net capital gain/loss in AGI: +$16,451 (reported on 5.7% of returns)
Here:
+$16,451
State:
+$31,437
(% of AGI for various income ranges: 0.5% for AGIs $75k-100k, 1.1% for AGIs $100k-200k, 21.7% for AGIs over 200k)
Profit/loss from business: +$10,810 (reported on 11.4% of returns)
Here:
+$10,810
State:
+$20,662
(% of AGI for various income ranges: 9.3% for AGIs below $25k, 2.3% for AGIs $25k-50k, 1.5% for AGIs $50k-75k, 2.2% for AGIs $75k-100k, 3.1% for AGIs $100k-200k, 0.7% for AGIs over 200k)
Taxable individual retirement arrangement distribution: $11,692 (reported on 3.1% of returns)
02125:
$11,692
Massachusetts:
$18,892
(% of AGI for various income ranges: 0.8% for AGIs below $25k, 0.5% for AGIs $25k-50k, 0.7% for AGIs $50k-75k, 1.1% for AGIs $75k-100k, 1.4% for AGIs $100k-200k, 1.7% for AGIs over 200k)
Self-employment retirement plans: $9,900 (reported on 0.2% of returns)
02125:
$9,900
Massachusetts:
$20,669
Total itemized deductions: $18,130 (20% of AGI, reported on 17.7% of returns)
Here:
$18,130
State:
$28,907
Here:
20.1% of AGI
State:
18.2% of AGI
(% of AGI for various income ranges: 3.9% for AGIs below $25k, 5.1% for AGIs $25k-50k, 8.4% for AGIs $50k-75k, 11.0% for AGIs $75k-100k, 12.6% for AGIs $100k-200k, 10.2% for AGIs over 200k)
Charity contributions: $2,805 (reported on 13.2% of returns)
Here:
$2,805
State:
$4,208
(% of AGI for various income ranges: 0.2% for AGIs below $25k, 0.5% for AGIs $25k-50k, 0.8% for AGIs $50k-75k, 1.3% for AGIs $75k-100k, 1.2% for AGIs $100k-200k, 2.4% for AGIs over 200k)
Taxes paid: $6,229 (reported on 17.6% of returns)
02125:
$6,229
State:
$13,303
(% of AGI for various income ranges: 0.8% for AGIs below $25k, 1.2% for AGIs $25k-50k, 2.5% for AGIs $50k-75k, 4.0% for AGIs $75k-100k, 5.1% for AGIs $100k-200k, 5.0% for AGIs over 200k)
Earned income credit: $2,176 (reported on 26.2% of returns)
Here:
$2,176
State:
$1,971
(% of AGI for various income ranges: 8.0% for AGIs below $25k, 1.1% for AGIs $25k-50k)
Percentage of individuals using paid preparers for their 2012 taxes: 54.1%
Here:
54%
State:
56%
(% for various income ranges: 55.0% for AGIs below $25k, 52.7% for AGIs $25k-50k, 51.9% for AGIs $50k-75k, 54.3% for AGIs $75k-100k, 57.7% for AGIs $100k-200k, 69.2% for AGIs over 200k)
Averages for the 2004 tax year for zip code 02125, filed in 2005:
Average Adjusted Gross Income (AGI) in 2004: $31,873 (Individual Income Tax Returns)
Here:
$31,873
State:
$62,877
Salary/wage: $31,396 (reported on 89.7% of returns)
Here:
$31,396
State:
$52,969
(% of AGI for various income ranges: 102.3% for AGIs below $10k, 88.1% for AGIs $10k-25k, 94.3% for AGIs $25k-50k, 91.8% for AGIs $50k-75k, 90.0% for AGIs $75k-100k, 66.1% for AGIs over 100k)
Taxable interest for individuals: $851 (reported on 31.0% of returns)
This zip code:
$851
Massachusetts:
$1,945
(% of AGI for various income ranges: 2.1% for AGIs below $10k, 0.7% for AGIs $10k-25k, 0.4% for AGIs $25k-50k, 0.8% for AGIs $50k-75k, 0.6% for AGIs $75k-100k, 1.8% for AGIs over 100k)
Taxable dividends: $1,625 (reported on 8.9% of returns)
Here:
$1,625
State:
$5,323
(% of AGI for various income ranges: 0.7% for AGIs below $10k, 0.2% for AGIs $10k-25k, 0.2% for AGIs $25k-50k, 0.3% for AGIs $50k-75k, 0.5% for AGIs $75k-100k, 1.4% for AGIs over 100k)
Net capital gain/loss: +$16,799 (reported on 6.8% of returns)
Here:
+$16,799
State:
+$20,377
(% of AGI for various income ranges: -0.0% for AGIs below $10k, 0.3% for AGIs $10k-25k, 0.1% for AGIs $25k-50k, 0.5% for AGIs $50k-75k, 0.7% for AGIs $75k-100k, 22.3% for AGIs over 100k)
Profit/loss from business: +$8,588 (reported on 10.5% of returns)
Here:
+$8,588
State:
+$17,837
(% of AGI for various income ranges: 11.5% for AGIs below $10k, 5.3% for AGIs $10k-25k, 1.6% for AGIs $25k-50k, 1.6% for AGIs $50k-75k, 2.0% for AGIs $75k-100k, 3.9% for AGIs over 100k)
IRA payment deduction: $2,409 (reported on 1.3% of returns)
02125:
$2,409
Massachusetts:
$3,100
(% of AGI for various income ranges: 0.1% for AGIs $10k-25k, 0.1% for AGIs $25k-50k, 0.1% for AGIs $50k-75k, 0.1% for AGIs $75k-100k, 0.1% for AGIs over 100k)
Self-employed pension: $8,375 (reported on 0.3% of returns)
Here:
$8,375
Massachusetts:
$14,516
(% of AGI for various income ranges: 0.1% for AGIs $10k-25k, 0.1% for AGIs $50k-75k, 0.3% for AGIs over 100k)
Total itemized deductions: $17,070 (28% of AGI, reported on 19.6% of returns)
Here:
$17,070
State:
$22,573
Here:
28.1% of AGI
State:
19.5% of AGI
(% of AGI for various income ranges: 8.1% for AGIs below $10k, 6.1% for AGIs $10k-25k, 8.8% for AGIs $25k-50k, 10.4% for AGIs $50k-75k, 13.1% for AGIs $75k-100k, 18.1% for AGIs over 100k)
Charity contributions deductions: $2,641 (4% of AGI, reported on 16.0% of returns)
Here:
$2,641
State:
$3,295
Here:
4.2% of AGI
State:
2.7% of AGI
(% of AGI for various income ranges: 0.4% for AGIs below $10k, 0.6% for AGIs $10k-25k, 0.9% for AGIs $25k-50k, 1.4% for AGIs $50k-75k, 1.4% for AGIs $75k-100k, 3.0% for AGIs over 100k)
Total tax: $4,169 (reported on 69.0% of returns)
02125:
$4,169
State:
$11,494
(% of AGI for various income ranges: 3.1% for AGIs below $10k, 3.9% for AGIs $10k-25k, 7.2% for AGIs $25k-50k, 10.6% for AGIs $50k-75k, 12.2% for AGIs $75k-100k, 15.6% for AGIs over 100k)
Earned income credit: $1,678 (reported on 25.0% of returns)
Here:
$1,678
State:
$1,518
Percentage of individuals using paid preparers for their 2004 taxes: 60.1%
Here:
60%
State:
58%
(% for various income ranges: 58.9% for AGIs below $10k, 64.3% for AGIs $10k-25k, 57.3% for AGIs $25k-50k, 55.9% for AGIs $50k-75k, 65.1% for AGIs $75k-100k, 69.0% for AGIs over 100k)
Likely homosexual households (counted as self-reported same-sex unmarried-partner households)
Lesbian couples: 0.2% of all households
Gay men: 0.7% of all households
Household received Food Stamps/SNAP in the past 12 months: 4,284 Household did not receive Food Stamps/SNAP in the past 12 months: 9,683
Women who had a birth in the past 12 months: 354 (135 now married, 195 unmarried) Women who did not have a birth in the past 12 months: 9,504 (1,995 now married, 7,601 unmarried)
Housing units in zip code 02125 with a mortgage: 3,390 (355 second mortgage, 7 home equity loan, 333 both second mortgage and home equity loan) Houses without a mortgage: 71
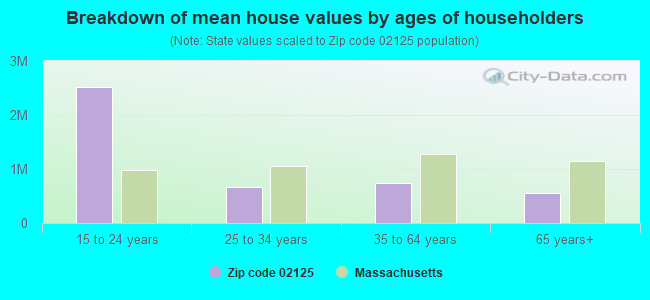
Median monthly owner costs for units with a mortgage: $2,509 Median monthly owner costs for units without a mortgage: $842
Residents with income below the poverty level in 2022:
This zip code:
24.8%
Whole state:
10.4%
Residents with income below 50% of the poverty level in 2022:
This zip code:
10.3%
Whole state:
5.1%
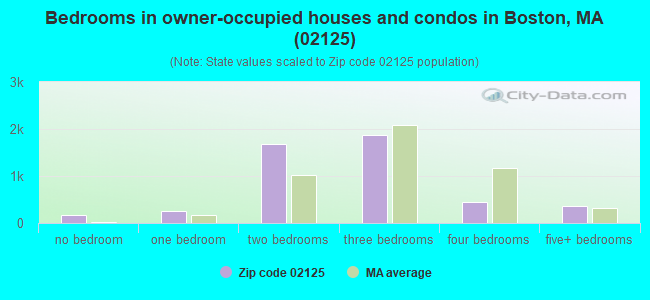
Median number of rooms in houses and condos:
Here:
5.3
State:
6.5
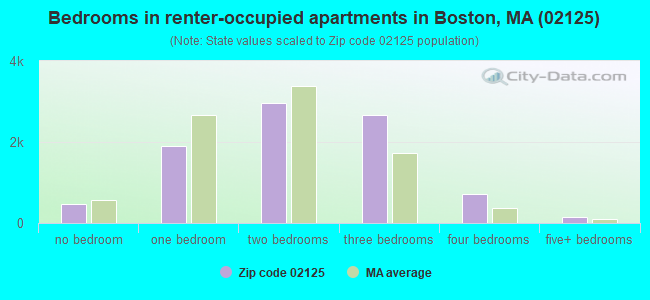
Median number of rooms in apartments:
Here:
4.3
State:
4.0
Notable locations in this zip code not listed on our city pages
Notable locations in zip code 02125: John F Kennedy-University of Massachusetts Station (A), Uphams Corner Station (B), Savin Hill Station (C), Crescent Avenue Station (D), Dorchester Yacht Club (E), Savin Hill Yacht Club (F), Boston Fire Department Station 21 Uphams Corner - Dorchester (G), John Fitzgerald Kennedy Library (H), John Fitzgerald Kennedy Center (I), Bayside Exposition Center (J), Edward Everett Elementary School Library (K), Commonwealth of Massachusetts State Archives (L), Massachusetts Port Authority-Logan Airport (M), Joseph P Healey Library (N). Display/hide their locations on the map
1,969 married couples with children.
2,552 single-parent households (238 men, 2,314 women).
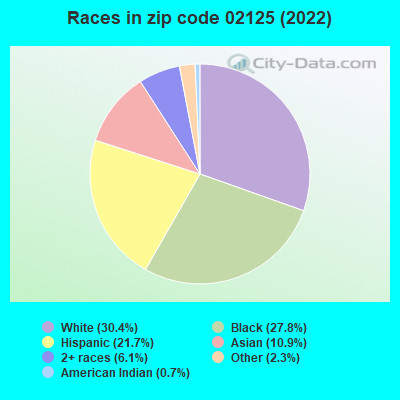
56.8% of residents of 02125 zip code speak English at home.
17.1% of residents speak Spanish at home (55% very well, 22% well, 14% not well, 9% not at all).
15.2% of residents speak other Indo-European language at home (52% very well, 32% well, 14% not well, 1% not at all).
7.5% of residents speak Asian or Pacific Island language at home (39% very well, 29% well, 27% not well, 5% not at all).
3.5% of residents speak other language at home (62% very well, 31% well, 8% not well).
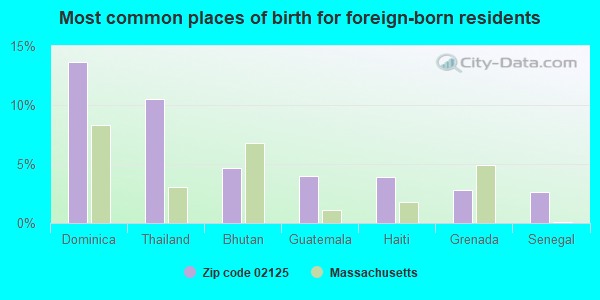
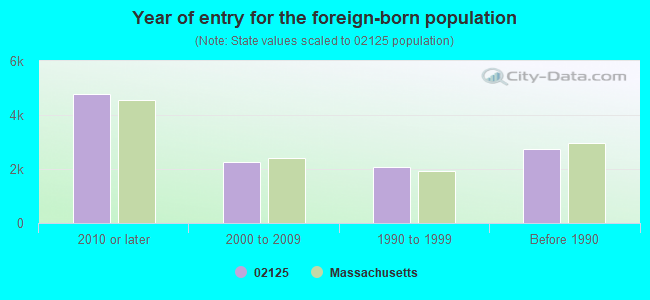
Foreign born population: 10,451 (32.8%) (60.4% of them are naturalized citizens)
Major facilities with environmental interests located in this zip code:
PAUL A DEVER (325 MT VERNON STREET in DORCHESTER, MA)
(National Center for Education Statistics) - STATE ID-035268 Organizations: BOSTON (SCHOOL DISTRICT)
EDWARD EVERETT (71 PLEASANT STREET in DORCHESTER, MA)
(National Center for Education Statistics) - STATE ID-035088 Organizations: BOSTON (SCHOOL DISTRICT)
ELC - EAST ZONE (370 COLUMBIA ROAD in DORCHESTER, MA)
(National Center for Education Statistics) - STATE ID-035005 Organizations: BOSTON (SCHOOL DISTRICT)
JOHN W MCCORMACK (315 MT VERNON STREET in DORCHESTER, MA)
(National Center for Education Statistics) - STATE ID-035179 Organizations: BOSTON (SCHOOL DISTRICT)
JOHN WINTHROP (35 BROOKFORD STREET in DORCHESTER, MA)
(National Center for Education Statistics) - STATE ID-035180 Organizations: BOSTON (SCHOOL DISTRICT)
DYNAGRAF INC (55 MORRISSEY BOULEVARD in BOSTON (DORCHESTER), MA)
AIR MINOR (AIRS/AFS) (Resource Conservation and Recovery Act (tracking hazardous waste)) Business NAICS classification: COMMERCIAL LITHOGRAPHIC PRINTING.
NSTAR ELECTRIC & GAS (1165 MASSACHUSETTS AVE in BOSTON, MA)
HAZARDOUS WASTE BIENNIAL REPORTER (Resource Conservation and Recovery Act (tracking hazardous waste)) Large Quantity Generators, more that 1000 kg of hazardous waste/month (Resource Conservation and Recovery Act (tracking hazardous waste)) - notification Business NAICS classification: ELECTRIC POWER DISTRIBUTION. Organizations: BOSTON EDISON, DBA NSTAR (CONTACT/OPERATOR)
Alternative names: BOSTON EDISON D/B/A NSTAR, BOSTON OPERATIONS CENTER BOSTON EDISON, NSTAR SERVICES
AGGREGATE INDS. NORTHEAST REGION INC. (55 ENTERPRISE ST. in BOSTON, MA)
AIR MINOR (AIRS/AFS) CRITERIA AND HAZARDOUS AIR POLLUTANT INVENTORY (Inventory of air pollution sources) TRI REPORTER (Tracking of toxic chemicals releasing facilities) Business SIC classification: READY-MIXED CONCRETE Alternative names: BARDON TRIMOUNT INCORPORATED
AGAR SUPPLY CO (1100 MASSACHUSETTS AVE in BOSTON, MA)
(Resource Conservation and Recovery Act (tracking hazardous waste)) Organizations: LAWRENCE SMITH (CONTACT/OWNER)
ANGELICA TEXTILE SERVICES (1 HOYT ST in BOSTON, MA)
AIR MINOR (AIRS/AFS) CRITERIA AND HAZARDOUS AIR POLLUTANT INVENTORY (Inventory of air pollution sources) Business SIC classification: POWER LAUNDRIES, FAMILY AND COMMERCIAL
WORLD WIDE MOTORS (WORLD WIDE MOTORS in BOSTON, MA)
(Resource Conservation and Recovery Act (tracking hazardous waste)) Organizations: EDWARD WEBB (CONTACT/OWNER)
NEW ENGLAND TELE GARAGE (173 BOSTON ST in BOSTON, MA)
(Resource Conservation and Recovery Act (tracking hazardous waste))
EASTERN STEEL RACK CO (166 PLEASANT STREET in BOSTON, MA)
(Resource Conservation and Recovery Act (tracking hazardous waste))
Housing units lacking complete plumbing facilities: 0.4% Housing units lacking complete kitchen facilities: 0.6%
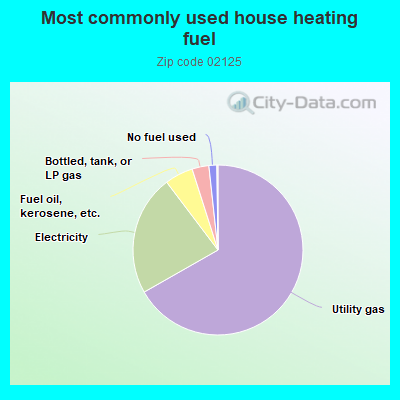
66.7%Utility gas
22.9%Electricity
5.4%Fuel oil, kerosene, etc.
3.2%Bottled, tank, or LP gas
1.5%No fuel used
Population in 1990: 31,393. Population change in the 1990s: +2,225 (+7.1%).
Place of birth for U.S.-born residents:
This state: 15,076
Northeast: 2,550
Midwest: 701
South: 1,258
West: 657
60% of the 02125 zip code residents lived in the same house 5 years ago. Out of people who lived in different houses, 68% lived in this county. Out of people who lived in different counties, 50% lived in Massachusetts.
88% of the 02125 zip code residents lived in the same house 1 year ago. Out of people who lived in different houses, 50% moved from this county. Out of people who lived in different houses, 24% moved from different county within same state. Out of people who lived in different houses, 16% moved from different state. Out of people who lived in different houses, 8% moved from abroad.
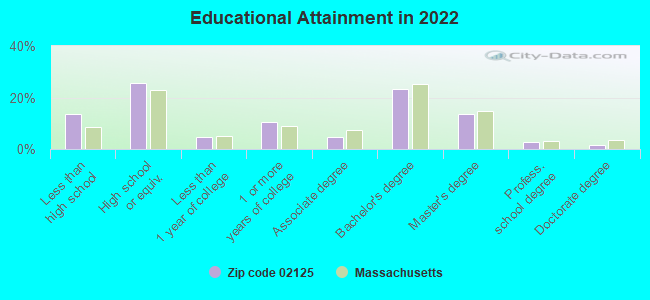
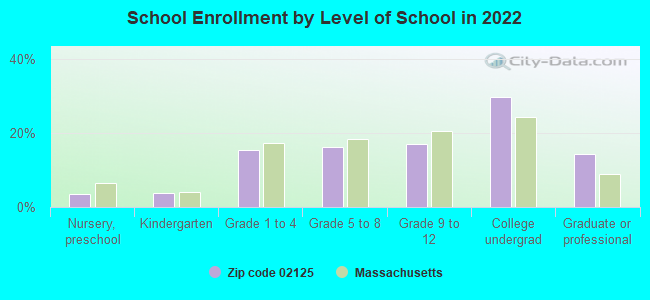
Private vs. public school enrollment:
Students in private schools in grades 1 to 8 (elementary and middle school): 266
Here:
10.2%
Massachusetts:
10.3%
Students in private schools in grades 9 to 12 (high school): 84
Here:
6.1%
Massachusetts:
12.3%
Students in private undergraduate colleges: 998
Here:
40.8%
Massachusetts:
51.2%
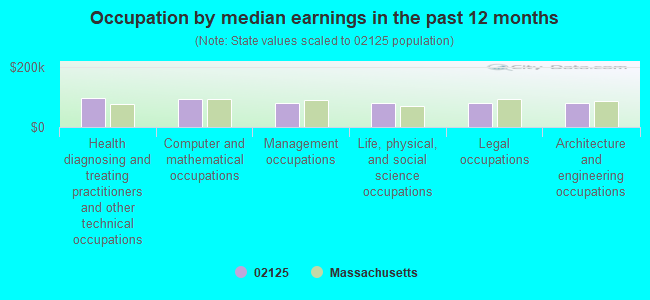
Occupation by median earnings in the past 12 months ($)
98,309Health diagnosing and treating practitioners and other technical occupations
93,153Computer and mathematical occupations
81,237Management occupations
80,989Life, physical, and social science occupations
80,888Legal occupations
80,858Architecture and engineering occupations
Companies with federal contracts located in this zip code:
THE FIRST ELECTRONIC CORP (71 VON HILLERN ST in BOSTON, MA; small business) : $2,579,603 in 40 contractsfrom 1999 to 2006
Contracts for Miscellaneous Electric Power and Distribution Equipment, Guns, through 30 mm, Cable, Cord, and Wire Assemblies: Communications Equipment, Aircraft Maintenance and Repair Shop Specialized Equipment, and moreby Army, Navy, Defense Logistics Agency, Bureau of Prisoners/Federal Prison System, and others Signed by year:2000: $73,485; 2001: $112,021; 2002: $128,718; 2003: $216,726; 2004: $709,058; 2005: $1,150,552; 2006: $162,217.
Biggest contracts:
$645,048 with Army for Miscellaneous Electric Power and Distribution Equipment. Signed on 2005-03-03. Completion date: 2010-11-05.
$324,632 with Army for Guns, through 30 mm. Signed on 2004-05-05. Completion date: 2005-02-08.
$202,300 with Army for Miscellaneous Electric Power and Distribution Equipment. Signed on 2005-05-25. Completion date: 2010-11-05.
$168,330 with Navy for Cable, Cord, and Wire Assemblies: Communications Equipment. Signed on 2003-06-17. Completion date: 2004-01-23.
ANA MONTEIRO (9 HAMLET ST in DORCHESTER, MA; small business)
$36,888 with Army for Contract, Procurement, and Acquisition Support Services. Signed on 2003-10-01. Completion date: 2004-09-30.
CHAPMAN WATERPROOFING COMPANY (395 COLUMBIA ROAD in BOSTON, MA; small business)
$14,450 with Navy for Maintenance, Repair or Alteration of Real Property -- Recreational Buildings. Taking place in RI. Signed on 2000-05-04. Completion date: 2000-05-21.
GREATER MEDIA, INC (55 WILLIAM T MORRISSEY BLV in BOSTON, MA)
$6,000 with Army for Signs, Advertising Displays, and Identification Plates. Signed on 2005-08-19. Completion date: 2005-09-19.
Top industries in this zip code by the number of employees in 2005:
2002 - 2018 National Fire Incident Reporting System (NFIRS) incidents
Based on the data from the years 2002 - 2018 the average number of fires per year is 259. The highest number of fire incidents - 383 took place in 2015, and the least - 142 in 2002. The data has a growing trend.
When looking into fire subcategories, the most incidents belonged to: Structure Fires (69.0%), and Outside Fires (18.4%).
Fire incident types reported to NFIRS in Zip Code 02125


 Nearest zip codes: 02127, 02118, 02122, 02119, 02121, 02124.
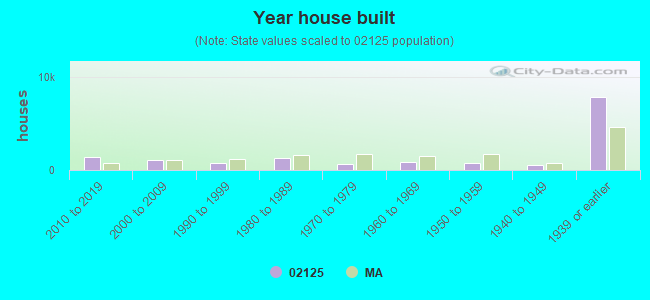


 Based on the data from the years 2002 - 2018 the average number of fires per year is 259. The highest number of fire incidents - 383 took place in 2015, and the least - 142 in 2002. The data has a growing trend.
 When looking into fire subcategories, the most incidents belonged to: Structure Fires (69.0%), and Outside Fires (18.4%).