Estimated zip code population in 2022: 36,163 Zip code population in 2010: 31,799 Zip code population in 2000: 29,456
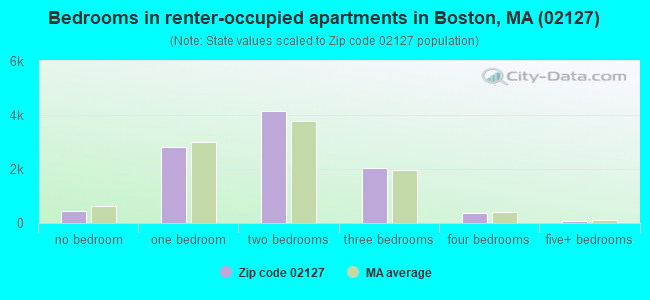
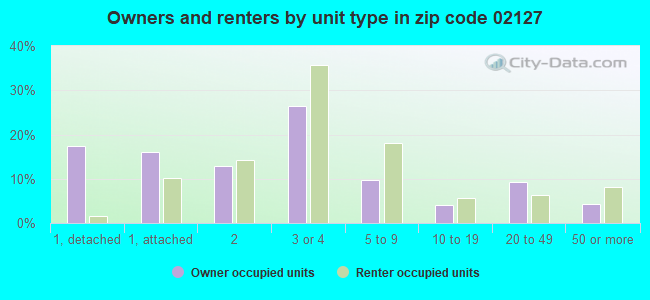
Houses and condos: 19,438 Renter-occupied apartments: 9,916
% of renters here:
56%
State:
38%
March 2022 cost of living index in zip code 02127: 136.7 (high, U.S. average is 100)
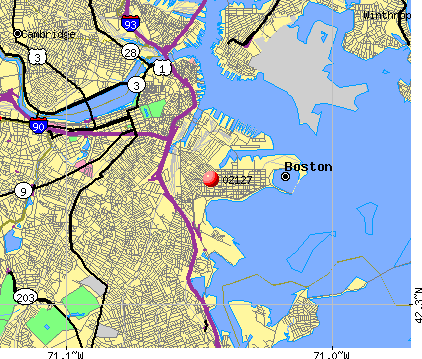
Land area: 2.0 sq. mi. Water area: 0.6 sq. mi.
Population density: 17,888 people per square mile
(very high).
OSM Map
Google Map
MSN Map
OSM Map
General Map
Google Map
MSN Map
OSM Map
Google Map
MSN Map
OSM Map
Google Map
MSN Map
Please wait while loading the map...
Real estate property taxes paid for housing units in 2022:
This zip code:
0.6% ($5,745)
Massachusetts:
1.0% ($5,536)
Median real estate property taxes paid for housing units with mortgages in 2022: $5,539 (0.6%) Median real estate property taxes paid for housing units with no mortgage in 2022: $6,637 (0.7%)
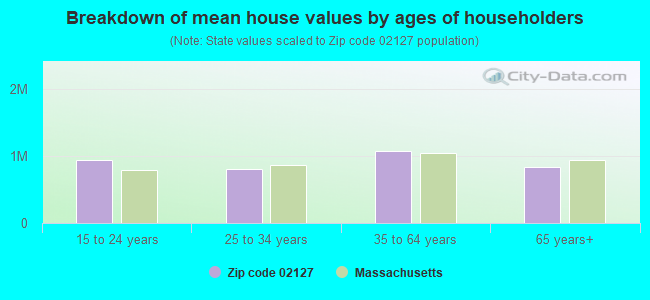
Estimated median house/condo value in 2022: $904,095
02127:
$904,095
Massachusetts:
$534,700
According to our research of Massachusetts and other state lists, there were 5 registered sex offenders living in 02127 zip code as of April 27, 2024. The ratio of all residents to sex offenders in zip code 02127 is 7,366 to 1. The ratio of registered sex offenders to all residents in this zip code is much lower than the state average.
Median resident age:
This zip code:
32.8 years
Massachusetts median age:
40.3 years
Average household size:
This zip code:
2.0 people
Massachusetts:
2.4 people
Averages for the 2020 tax year for zip code 02127, filed in 2021:
Average Adjusted Gross Income (AGI) in 2020: $116,146 (Individual Income Tax Returns)
Here:
$116,146
State:
$105,130
Salary/wage: $104,035 (reported on 90.9% of returns)
Here:
$104,035
State:
$82,951
(% of AGI for various income ranges: 1135.4% for AGIs below $25k, 3668.9% for AGIs $25k-50k, 6931.4% for AGIs $50k-75k, 10683.5% for AGIs $75k-100k, 19928.8% for AGIs $100k-200k, 109024.4% for AGIs over 200k)
Taxable interest for individuals: $1,791 (reported on 36.2% of returns)
This zip code:
$1,791
Massachusetts:
$2,361
(% of AGI for various income ranges: 16.8% for AGIs below $25k, 13.2% for AGIs $25k-50k, 14.8% for AGIs $50k-75k, 17.1% for AGIs $75k-100k, 68.9% for AGIs $100k-200k, 1284.6% for AGIs over 200k)
Ordinary dividends: $3,754 (reported on 34.1% of returns)
Here:
$3,754
State:
$10,365
(% of AGI for various income ranges: 21.1% for AGIs below $25k, 22.1% for AGIs $25k-50k, 40.9% for AGIs $50k-75k, 75.0% for AGIs $75k-100k, 172.1% for AGIs $100k-200k, 2294.9% for AGIs over 200k)
Net capital gain/loss in AGI: +$21,539 (reported on 32.2% of returns)
Here:
+$21,539
State:
+$48,178
(% of AGI for various income ranges: 19.2% for AGIs below $25k, 30.0% for AGIs $25k-50k, 51.6% for AGIs $50k-75k, 119.8% for AGIs $75k-100k, 481.0% for AGIs $100k-200k, 16046.6% for AGIs over 200k)
Profit/loss from business: +$23,303 (reported on 9.9% of returns)
Here:
+$23,303
State:
+$20,792
(% of AGI for various income ranges: 78.1% for AGIs below $25k, 140.1% for AGIs $25k-50k, 96.1% for AGIs $50k-75k, 149.4% for AGIs $75k-100k, 507.1% for AGIs $100k-200k, 2959.0% for AGIs over 200k)
Taxable individual retirement arrangement distribution: $18,831 (reported on 3.9% of returns)
02127:
$18,831
Massachusetts:
$22,790
(% of AGI for various income ranges: 32.6% for AGIs below $25k, 37.9% for AGIs $25k-50k, 33.0% for AGIs $50k-75k, 84.5% for AGIs $75k-100k, 217.3% for AGIs $100k-200k, 657.9% for AGIs over 200k)
Self-employed (Keogh) retirement plans: $28,852 (reported on 1.0% of returns)
02127:
$28,852
Massachusetts:
$26,868
(% of AGI for various income ranges: 7.8% for AGIs $50k-75k, 34.2% for AGIs $100k-200k, 601.0% for AGIs over 200k)
Total itemized deductions: $29,449 (reported on 15.9% of returns)
Here:
$29,449
State:
$36,722
(% of AGI for various income ranges: 61.7% for AGIs below $25k, 88.0% for AGIs $25k-50k, 118.5% for AGIs $50k-75k, 337.5% for AGIs $75k-100k, 1126.2% for AGIs $100k-200k, 6942.9% for AGIs over 200k)
Charity contributions: $5,597 (reported on 12.4% of returns)
Here:
$5,597
State:
$12,529
(% of AGI for various income ranges: 3.8% for AGIs below $25k, 8.0% for AGIs $25k-50k, 9.0% for AGIs $50k-75k, 26.7% for AGIs $75k-100k, 86.0% for AGIs $100k-200k, 1407.1% for AGIs over 200k)
Taxes paid: $9,010 (reported on 15.9% of returns)
02127:
$9,010
State:
$8,782
(% of AGI for various income ranges: 15.6% for AGIs below $25k, 20.6% for AGIs $25k-50k, 37.9% for AGIs $50k-75k, 117.2% for AGIs $75k-100k, 419.6% for AGIs $100k-200k, 1882.4% for AGIs over 200k)
Earned income credit: $1,936 (reported on 6.2% of returns)
Here:
$1,936
State:
$1,909
(% of AGI for various income ranges: 69.6% for AGIs below $25k, 35.9% for AGIs $25k-50k)
Percentage of individuals using paid preparers for their 2020 taxes: 94.4%
Here:
94%
State:
92%
(% for various income ranges: 89.8% for AGIs below $25k, 93.1% for AGIs $25k-50k, 95.2% for AGIs $50k-75k, 95.5% for AGIs $75k-100k, 95.8% for AGIs $100k-200k, 97.0% for AGIs over 200k)
Averages for the 2012 tax year for zip code 02127, filed in 2013:
Average Adjusted Gross Income (AGI) in 2012: $71,219 (Individual Income Tax Returns)
Here:
$71,219
State:
$81,425
Salary/wage: $67,391 (reported on 90.9% of returns)
Here:
$67,391
State:
$64,752
(% of AGI for various income ranges: 77.2% for AGIs below $25k, 89.2% for AGIs $25k-50k, 91.9% for AGIs $50k-75k, 89.5% for AGIs $75k-100k, 89.5% for AGIs $100k-200k, 75.1% for AGIs over 200k)
Taxable interest for individuals: $820 (reported on 36.9% of returns)
This zip code:
$820
Massachusetts:
$2,136
(% of AGI for various income ranges: 0.6% for AGIs below $25k, 0.3% for AGIs $25k-50k, 0.3% for AGIs $50k-75k, 0.4% for AGIs $75k-100k, 0.5% for AGIs $100k-200k, 0.5% for AGIs over 200k)
Ordinary dividends: $2,758 (reported on 22.3% of returns)
Here:
$2,758
State:
$9,473
(% of AGI for various income ranges: 1.5% for AGIs below $25k, 0.6% for AGIs $25k-50k, 0.5% for AGIs $50k-75k, 0.6% for AGIs $75k-100k, 0.6% for AGIs $100k-200k, 1.6% for AGIs over 200k)
Net capital gain/loss in AGI: +$9,375 (reported on 17.1% of returns)
Here:
+$9,375
State:
+$31,437
(% of AGI for various income ranges: 0.2% for AGIs $25k-50k, 0.2% for AGIs $50k-75k, 0.5% for AGIs $75k-100k, 0.9% for AGIs $100k-200k, 7.9% for AGIs over 200k)
Profit/loss from business: +$18,210 (reported on 9.1% of returns)
Here:
+$18,210
State:
+$20,662
(% of AGI for various income ranges: 6.8% for AGIs below $25k, 2.1% for AGIs $25k-50k, 1.3% for AGIs $50k-75k, 1.6% for AGIs $75k-100k, 2.2% for AGIs $100k-200k, 3.1% for AGIs over 200k)
Taxable individual retirement arrangement distribution: $11,573 (reported on 4.9% of returns)
02127:
$11,573
Massachusetts:
$18,892
(% of AGI for various income ranges: 1.6% for AGIs below $25k, 0.9% for AGIs $25k-50k, 0.7% for AGIs $50k-75k, 1.0% for AGIs $75k-100k, 0.7% for AGIs $100k-200k, 0.6% for AGIs over 200k)
Self-employment retirement plans: $22,708 (reported on 0.6% of returns)
02127:
$22,708
Massachusetts:
$20,669
(% of AGI for various income ranges: 0.1% for AGIs $50k-75k, 0.2% for AGIs $100k-200k, 0.5% for AGIs over 200k)
Total itemized deductions: $22,160 (17% of AGI, reported on 31.9% of returns)
Here:
$22,160
State:
$28,907
Here:
16.7% of AGI
State:
18.2% of AGI
(% of AGI for various income ranges: 7.5% for AGIs below $25k, 4.6% for AGIs $25k-50k, 6.8% for AGIs $50k-75k, 10.3% for AGIs $75k-100k, 13.6% for AGIs $100k-200k, 11.6% for AGIs over 200k)
Charity contributions: $1,993 (reported on 25.8% of returns)
Here:
$1,993
State:
$4,208
(% of AGI for various income ranges: 0.4% for AGIs below $25k, 0.3% for AGIs $25k-50k, 0.5% for AGIs $50k-75k, 0.6% for AGIs $75k-100k, 0.9% for AGIs $100k-200k, 1.0% for AGIs over 200k)
Taxes paid: $9,602 (reported on 31.8% of returns)
02127:
$9,602
State:
$13,303
(% of AGI for various income ranges: 1.5% for AGIs below $25k, 1.3% for AGIs $25k-50k, 2.3% for AGIs $50k-75k, 3.9% for AGIs $75k-100k, 5.9% for AGIs $100k-200k, 6.4% for AGIs over 200k)
Earned income credit: $1,985 (reported on 9.4% of returns)
Here:
$1,985
State:
$1,971
(% of AGI for various income ranges: 5.4% for AGIs below $25k, 0.3% for AGIs $25k-50k)
Percentage of individuals using paid preparers for their 2012 taxes: 48.0%
Here:
48%
State:
56%
(% for various income ranges: 49.1% for AGIs below $25k, 44.1% for AGIs $25k-50k, 40.8% for AGIs $50k-75k, 47.4% for AGIs $75k-100k, 58.1% for AGIs $100k-200k, 69.6% for AGIs over 200k)
Averages for the 2004 tax year for zip code 02127, filed in 2005:
Average Adjusted Gross Income (AGI) in 2004: $50,041 (Individual Income Tax Returns)
Here:
$50,041
State:
$62,877
Salary/wage: $48,311 (reported on 88.8% of returns)
Here:
$48,311
State:
$52,969
(% of AGI for various income ranges: 93.0% for AGIs below $10k, 77.9% for AGIs $10k-25k, 89.6% for AGIs $25k-50k, 89.6% for AGIs $50k-75k, 89.6% for AGIs $75k-100k, 80.3% for AGIs over 100k)
Taxable interest for individuals: $959 (reported on 44.5% of returns)
This zip code:
$959
Massachusetts:
$1,945
(% of AGI for various income ranges: 3.2% for AGIs below $10k, 1.4% for AGIs $10k-25k, 0.6% for AGIs $25k-50k, 0.7% for AGIs $50k-75k, 0.7% for AGIs $75k-100k, 0.9% for AGIs over 100k)
Taxable dividends: $1,425 (reported on 21.4% of returns)
Here:
$1,425
State:
$5,323
(% of AGI for various income ranges: 1.6% for AGIs below $10k, 0.7% for AGIs $10k-25k, 0.5% for AGIs $25k-50k, 0.5% for AGIs $50k-75k, 0.4% for AGIs $75k-100k, 0.8% for AGIs over 100k)
Net capital gain/loss: +$9,096 (reported on 16.6% of returns)
Here:
+$9,096
State:
+$20,377
(% of AGI for various income ranges: 1.5% for AGIs below $10k, 0.1% for AGIs $10k-25k, 0.0% for AGIs $25k-50k, 0.5% for AGIs $50k-75k, 0.8% for AGIs $75k-100k, 8.2% for AGIs over 100k)
Profit/loss from business: +$11,387 (reported on 9.2% of returns)
Here:
+$11,387
State:
+$17,837
(% of AGI for various income ranges: 10.6% for AGIs below $10k, 4.6% for AGIs $10k-25k, 1.9% for AGIs $25k-50k, 1.2% for AGIs $50k-75k, 1.5% for AGIs $75k-100k, 2.3% for AGIs over 100k)
IRA payment deduction: $2,618 (reported on 1.6% of returns)
02127:
$2,618
Massachusetts:
$3,100
(% of AGI for various income ranges: 0.2% for AGIs $10k-25k, 0.1% for AGIs $25k-50k, 0.1% for AGIs $50k-75k, 0.1% for AGIs $75k-100k, 0.0% for AGIs over 100k)
Self-employed pension: $8,988 (reported on 0.5% of returns)
Here:
$8,988
Massachusetts:
$14,516
(% of AGI for various income ranges: 0.1% for AGIs $25k-50k, 0.0% for AGIs $50k-75k, 0.1% for AGIs $75k-100k, 0.2% for AGIs over 100k)
Total itemized deductions: $17,608 (20% of AGI, reported on 32.2% of returns)
Here:
$17,608
State:
$22,573
Here:
19.7% of AGI
State:
19.5% of AGI
(% of AGI for various income ranges: 9.0% for AGIs below $10k, 6.6% for AGIs $10k-25k, 7.1% for AGIs $25k-50k, 11.6% for AGIs $50k-75k, 14.2% for AGIs $75k-100k, 13.8% for AGIs over 100k)
Charity contributions deductions: $1,926 (2% of AGI, reported on 28.9% of returns)
Here:
$1,926
State:
$3,295
Here:
2.1% of AGI
State:
2.7% of AGI
(% of AGI for various income ranges: 0.5% for AGIs below $10k, 0.6% for AGIs $10k-25k, 0.7% for AGIs $25k-50k, 1.2% for AGIs $50k-75k, 1.3% for AGIs $75k-100k, 1.4% for AGIs over 100k)
Total tax: $8,038 (reported on 82.9% of returns)
02127:
$8,038
State:
$11,494
(% of AGI for various income ranges: 2.9% for AGIs below $10k, 4.6% for AGIs $10k-25k, 9.6% for AGIs $25k-50k, 12.7% for AGIs $50k-75k, 13.7% for AGIs $75k-100k, 18.2% for AGIs over 100k)
Earned income credit: $1,622 (reported on 11.9% of returns)
Here:
$1,622
State:
$1,518
Percentage of individuals using paid preparers for their 2004 taxes: 53.9%
Here:
54%
State:
58%
(% for various income ranges: 49.4% for AGIs below $10k, 54.3% for AGIs $10k-25k, 47.9% for AGIs $25k-50k, 54.6% for AGIs $50k-75k, 62.8% for AGIs $75k-100k, 69.2% for AGIs over 100k)
Likely homosexual households (counted as self-reported same-sex unmarried-partner households)
Lesbian couples: 0.1% of all households
Gay men: 0.2% of all households
Household received Food Stamps/SNAP in the past 12 months: 2,183 Household did not receive Food Stamps/SNAP in the past 12 months: 15,479
Women who had a birth in the past 12 months: 381 (364 now married, 30 unmarried) Women who did not have a birth in the past 12 months: 12,232 (2,860 now married, 9,473 unmarried)
Housing units in zip code 02127 with a mortgage: 5,952 (762 second mortgage, 729 both second mortgage and home equity loan) Houses without a mortgage: 114
Median monthly owner costs for units with a mortgage: $3,178 Median monthly owner costs for units without a mortgage: $1,098
Residents with income below the poverty level in 2022:
This zip code:
11.0%
Whole state:
10.4%
Residents with income below 50% of the poverty level in 2022:
This zip code:
4.9%
Whole state:
5.1%
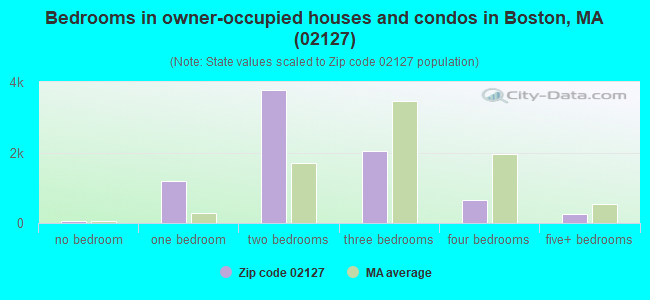
Median number of rooms in houses and condos:
Here:
4.6
State:
6.5
Median number of rooms in apartments:
Here:
3.9
State:
4.0
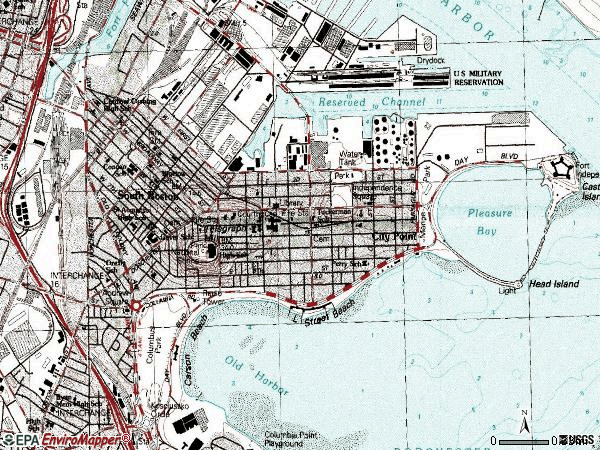
Notable locations in this zip code not listed on our city pages
Notable locations in zip code 02127: Pleasure Bay Jetty Light (A), L Street Bathhouse (B), Boston Fire Department Station 39 South Boston (C), Boston Fire Department Station 2 South Boston (D), South Boston High School Library (E), Perkins Elementary School Library (F). Display/hide their locations on the map
Churches in zip code 02127 include: Saint Augustine Chapel (A), Saint Peter Lithuanian Parish (B), Saint Matthew and the Redeemer Church (C), Albanian Orthodox Archdioceses in America (D). Display/hide their locations on the map
2,391 married couples with children.
1,286 single-parent households (118 men, 1,168 women).
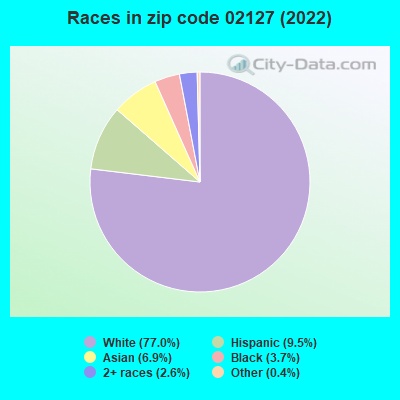
82.6% of residents of 02127 zip code speak English at home.
7.6% of residents speak Spanish at home (46% very well, 21% well, 20% not well, 14% not at all).
3.2% of residents speak other Indo-European language at home (71% very well, 19% well, 9% not well, 2% not at all).
5.2% of residents speak Asian or Pacific Island language at home (47% very well, 19% well, 28% not well, 5% not at all).
0.9% of residents speak other language at home (63% very well, 24% well, 12% not well).
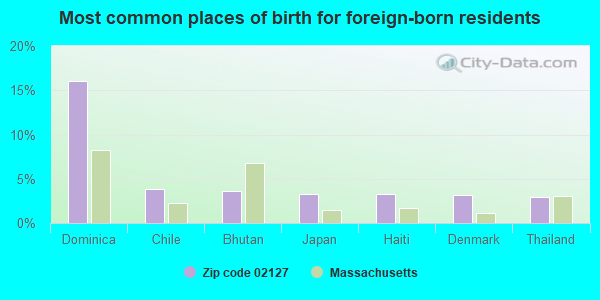
Foreign born population: 4,803 (13.3%) (67.5% of them are naturalized citizens)
Major facilities with environmental interests located in this zip code:
COLE HERSEE CO (20 OLD COLONY AVENUE in BOSTON, MA)
AIR MINOR (AIRS/AFS) (Integrated Compliance Information System) - ICIS-01-1995-0102, FORMAL ENFORCEMENT ACTION COMPLIANCE ACTIVITY (Tracking inspections of insecticide, fungicide, and rodenticide, and toxic substances) CRITERIA AND HAZARDOUS AIR POLLUTANT INVENTORY (Inventory of air pollution sources) (Resource Conservation and Recovery Act (tracking hazardous waste)) Small Quantity Generators, between 100 kg and 1000 kg of hazardous waste/month (Resource Conservation and Recovery Act (tracking hazardous waste)) - notification TRI REPORTER (Tracking of toxic chemicals releasing facilities) Business SIC classification: CURRENT-CARRYING WIRING DEVICES; MOTOR VEHICLE PARTS AND ACCESSORIES Business NAICS classification: CURRENT-CARRYING WIRING DEVICE MANUFACTURING. Organizations: ROBERT L MAYER (CONTACT/OWNER)
MBTA CABOT GARAGE (275 DORCHESTER AVE in SOUTH BOSTON, MA)
AIR MINOR (AIRS/AFS) (Integrated Compliance Information System) - ICIS-01-2000-0041, FORMAL ENFORCEMENT ACTION COMPLIANCE ACTIVITY (Tracking inspections of insecticide, fungicide, and rodenticide, and toxic substances) CRITERIA AND HAZARDOUS AIR POLLUTANT INVENTORY (Inventory of air pollution sources) Conditionally Exempt Small Quantity Generators, less than 100 kg/month of hazardous waste (Resource Conservation and Recovery Act (tracking hazardous waste)) - notification Business SIC classification: TRANSPORTATION EQUIPMENT; LOCAL AND SUBURBAN TRANSIT Organizations: MBTA CABOT BUS (CONTACT/OPERATOR)
, MASS BAY TRANSPORTATION AUTHORITY (CONTACT/OWNER)
Alternative names: CABOT RTL, M B T A CABOT RTL MAINTENANCE SHOP, M B T A CABOT YARD, MA BAY TRANSPORTATION AUTHORITY, MBTA SOUTH BAY MAIN, MBTA SOUTH BAY MAINT
COASTAL OIL OF NEW ENGLAND INC (900 EAST 1ST STREET in BOSTON, MA)
AIR SYNTHETIC MINOR (AIRS/AFS) CRITERIA AND HAZARDOUS AIR POLLUTANT INVENTORY (Inventory of air pollution sources) National Pollutant Discharge Elimination System NON-MAJOR (Tracking pollutant discharge elimination systems) - permit HAZARDOUS WASTE BIENNIAL REPORTER (Resource Conservation and Recovery Act (tracking hazardous waste)) Large Quantity Generators, more that 1000 kg of hazardous waste/month (Resource Conservation and Recovery Act (tracking hazardous waste)) - notification TRI REPORTER (Tracking of toxic chemicals releasing facilities) Business SIC classification: PETROLEUM BULK STATIONS AND TERMINALS Organizations: TEXACO REFINING & MARKETING (CONTACT/OPERATOR)
, TEXACO-USA-A DIV OF TEXACO INC (CONTACT/OWNER)
Alternative names: COASTAL OIL NEW ENGL, COASTAL OIL NEW ENGLAND INC
LOYAL CROWN SERV SYS (39 DAMRELL STREET in BOSTON, MA)
AIR MINOR (AIRS/AFS) CRITERIA AND HAZARDOUS AIR POLLUTANT INVENTORY (Inventory of air pollution sources) (Resource Conservation and Recovery Act (tracking hazardous waste)) TRI REPORTER (Tracking of toxic chemicals releasing facilities) Business SIC classification: LINEN SUPPLY; INDUSTRIAL LAUNDERERS; NONCLASSIFIABLE ESTABLISHMENTS Organizations: CROWN SERVICES (CONTACT/OPERATOR)
, CROWN SERVICE SYSTEMS (CONTACT/OWNER)
Alternative names: CROWN SERVICE SYS., CROWN SER.SYSTEMS IN
NISSAN DIESEL TRUCK OF BOSTON (24 CYPHER ST in BOSTON, MA)
(Resource Conservation and Recovery Act (tracking hazardous waste)) Business NAICS classification: GENERAL AUTOMOTIVE REPAIR. Organizations: JAMES DEMICHELE (CONTACT/OWNER)
MBTA SOUTH BOSTON POWER FACILITY (696 EAST FIRST ST in BOSTON, MA)
AIR MINOR (AIRS/AFS) AIR MAJOR (AIRS/AFS) AIR PROGRAM (Clean Air Markets Division Business System) CRITERIA AND HAZARDOUS AIR POLLUTANT INVENTORY (Inventory of air pollution sources) Conditionally Exempt Small Quantity Generators, less than 100 kg/month of hazardous waste (Resource Conservation and Recovery Act (tracking hazardous waste)) - notification Business SIC classification: LOCAL AND SUBURBAN TRANSIT; ELECTRIC SERVICES Organizations: MASS BAY TRANS AUTH (CONTACT/OWNER)
, MASSACHUSSETTS BAY TRANSPORTATION (OWNER/OPERATOR)
Alternative names: M B T A POWER STATI, M B T A SOUTH BOSTON POWER STA, MBTA - ENV. AFFAIRS, SOUTH BOSTON COMBUSTION TURBINES
MHD RESEARCH AND MATERIALS LAB (400 D ST in BOSTON (SOUTH BOSTON), MA)
Conditionally Exempt Small Quantity Generators, less than 100 kg/month of hazardous waste (Resource Conservation and Recovery Act (tracking hazardous waste)) (Resource Conservation and Recovery Act (tracking hazardous waste)) Organizations: MA TURNPIKE AUTH (CONTACT/OPERATOR)
, MA HIGHWAY DEPT (CONTACT/OWNER)
, COMMONWEALTH OF MASS (CONTACT/OWNER)
Alternative names: COMM OF MASS DPW, M H D RESEARCH & MATERIALS LAB, MA DEPARTMENT OF PUBLIC WORKS, MA HIGHWAY DEPART RESEARCH & MATERIALS LAB
MULTIPRINT INC (630 EAST SECOND STREET in BOSTON, MA)
AIR MINOR (AIRS/AFS) CRITERIA AND HAZARDOUS AIR POLLUTANT INVENTORY (Inventory of air pollution sources) (Resource Conservation and Recovery Act (tracking hazardous waste)) Business SIC classification: COMMERCIAL PRINTING, LITHOGRAPHIC Business NAICS classification: COMMERCIAL LITHOGRAPHIC PRINTING. Organizations: ANDERS MOESTUE (CONTACT/OWNER)
MICHAEL J PERKINS (50 BURKE STREET in SOUTH BOSTON, MA)
(National Center for Education Statistics) - STATE ID-035231 Organizations: BOSTON (SCHOOL DISTRICT)
JOSEPH P TYNAN (650 E FOURTH STREET in SOUTH BOSTON, MA)
(National Center for Education Statistics) - STATE ID-035181 Organizations: BOSTON (SCHOOL DISTRICT)
PATRICK F GAVIN MIDDLE (215 DORCHESTER STREET in SOUTH BOSTON, MA)
(National Center for Education Statistics) - STATE ID-035435 Organizations: BOSTON (SCHOOL DISTRICT)
OLIVER HAZARD PERRY (745 EAST SEVENTH STREET in SOUTH BOSTON, MA)
(National Center for Education Statistics) - STATE ID-035255 Organizations: BOSTON (SCHOOL DISTRICT)
MARR EQUIPMENT CORP (1 D ST in BOSTON, MA)
National Pollutant Discharge Elimination System NON-MAJOR (Tracking pollutant discharge elimination systems) - permit Conditionally Exempt Small Quantity Generators, less than 100 kg/month of hazardous waste (Resource Conservation and Recovery Act (tracking hazardous waste)) - notification Organizations: ROBERT L MARR (CONTACT/OWNER)
Alternative names: MARR COMPANIES, MARR COMPANIES DBA DANIEL MARR & SON CO
Housing units lacking complete plumbing facilities: 0.3% Housing units lacking complete kitchen facilities: 0.3%
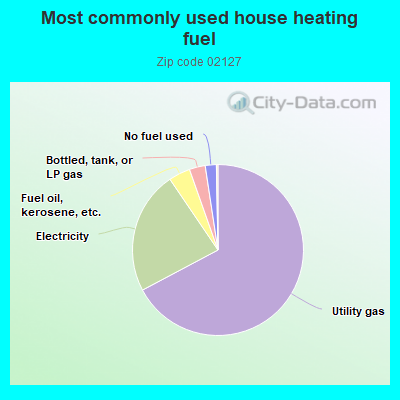
67.3%Utility gas
23.3%Electricity
4.1%Fuel oil, kerosene, etc.
3.0%Bottled, tank, or LP gas
2.1%No fuel used
Population in 1990: 29,170. Population change in the 1990s: +286 (+1.0%).
Place of birth for U.S.-born residents:
This state: 20,270
Northeast: 6,479
Midwest: 1,261
South: 1,837
West: 989
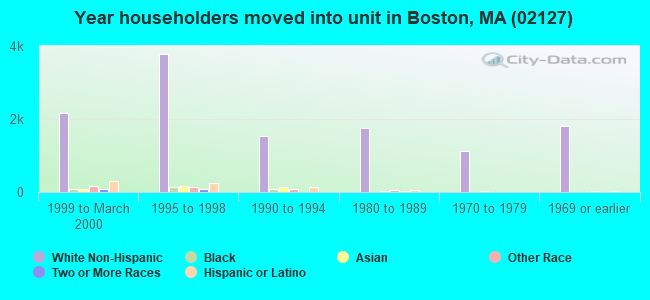
60% of the 02127 zip code residents lived in the same house 5 years ago. Out of people who lived in different houses, 57% lived in this county. Out of people who lived in different counties, 50% lived in Massachusetts.
83% of the 02127 zip code residents lived in the same house 1 year ago. Out of people who lived in different houses, 58% moved from this county. Out of people who lived in different houses, 25% moved from different county within same state. Out of people who lived in different houses, 12% moved from different state. Out of people who lived in different houses, 1% moved from abroad.
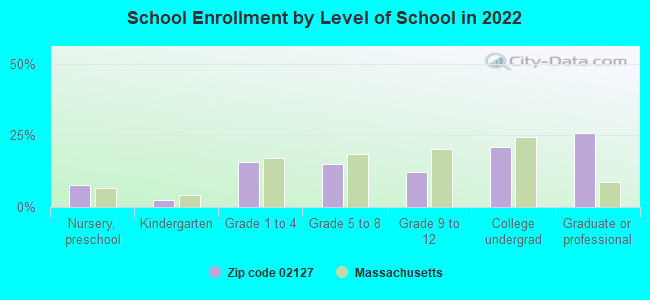
Private vs. public school enrollment:
Students in private schools in grades 1 to 8 (elementary and middle school): 92
Here:
5.2%
Massachusetts:
10.3%
Students in private schools in grades 9 to 12 (high school): 205
Here:
28.4%
Massachusetts:
12.3%
Students in private undergraduate colleges: 780
Here:
63.2%
Massachusetts:
51.2%
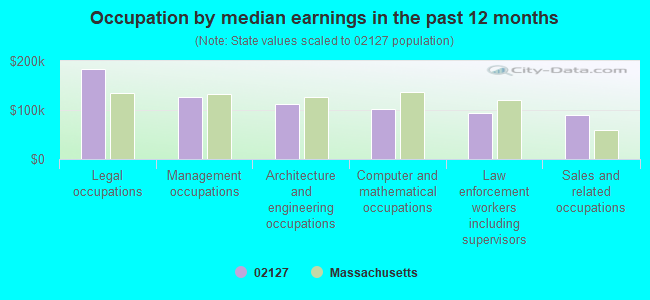
Occupation by median earnings in the past 12 months ($)
182,808Legal occupations
126,329Management occupations
112,523Architecture and engineering occupations
101,938Computer and mathematical occupations
93,561Law enforcement workers including supervisors
90,576Sales and related occupations
Companies with biggest federal contracts located in this zip code:
GILLETTE COMPANY, THE INC (1 GILLETTE PARK in BOSTON, MA) : $3,827,494 in 9 contractsfrom 1999 to 2000
Contracts for Food Items For Resale by Department of Defense Signed by year:2000: $1,288,494; 2001: $0; 2002: $0; 2003: $0; 2004: $0; 2005: $0; 2006: $0.
Biggest contracts:
$875,112 with Department of Defense for Food Items For Resale. Signed on 2000-06-30. Completion date: 2000-06-30.
$729,470, same as above.Signed on 1999-12-31. Completion date: 2000-01-31.
$682,453, same as above.Signed on 1999-11-30. Completion date: 1999-11-30.
$430,535, same as above.Signed on 1999-12-31. Completion date: 1999-12-31.
CTA CONSTRUCTION CO , INC (60 K ST in BOSTON, MA; small business) : $533,127 in 8 contractsfrom 2001 to 2004
Contracts for Maintenance, Repair or Alteration of Real Property -- Other Administrative Facilities and Service Buildings by Army Signed by year:2000: $0; 2001: $497,547; 2002: $32,120; 2003: $4,460; 2004: -$1,000; 2005: $0; 2006: $0.
Biggest contracts:
$491,000 with Army for Maintenance, Repair or Alteration of Real Property -- Other Administrative Facilities and Service Buildings. Signed on 2001-07-19. Completion date: 2001-10-26.
$11,299, same as above.Signed on 2002-02-19. Completion date: 2001-10-26.
$8,530, same as above.Signed on 2002-04-18. Completion date: 2001-11-12.
$6,588, same as above.Signed on 2002-02-22. Completion date: 2001-10-26.
SHAUGHNESSY AND AHERN COMPANY (346 D ST in BOSTON, MA; small business) : $111,000 in 2 contractsfrom 1999 to 2000
$89,400 with Navy for Lease or Rental of Equipment -- Ground Effect Vehicles, Motor Vehicles, Trailers, and Cycles. Taking place in NH. Signed on 1999-11-04. Completion date: 1999-12-06.
$21,600 with Navy for Maintenance, Repair or Alteration of Real Property -- Other Non-Building Facilities. Taking place in NH. Signed on 2000-02-15. Completion date: 2000-04-15.
TEI BIOSCIENCES INC (7 ELKINS ST in BOSTON, MA; small business) : $92,720 in 5 contractsin 2006
Contracts for Medical and Surgical Instruments, Equipment, and Supplies by Navy Signed by year:2000: $0; 2001: $0; 2002: $0; 2003: $0; 2004: $0; 2005: $0; 2006: $92,720.
Biggest contracts:
$24,660 with Navy for Medical and Surgical Instruments, Equipment, and Supplies. Taking place in VA. Signed on 2006-05-15. Completion date: 2006-05-16.
$24,660, same as above.Signed on 2006-02-23. Completion date: 2006-02-27.
$24,600, same as above.Signed on 2006-04-26. Completion date: 2006-02-27.
$9,400, same as above.Signed on 2006-02-16. Completion date: 2006-02-15.
THOMPSON ISLAND OUTWARD BOUND (THOMPSON IS in BOSTON, MA) : $66,138 in 5 contractsfrom 2002 to 2004
Contracts for Educational Studies and Analyses, Education Services by Air Force Signed by year:2000: $0; 2001: $0; 2002: $22,635; 2003: $28,533; 2004: $14,970; 2005: $0; 2006: $0.
Biggest contracts:
$27,024 with Air Force for Educational Studies and Analyses. Signed on 2003-06-16. Completion date: 2003-09-12.
$22,635, same as above.Signed on 2002-09-11. Completion date: 2002-09-19.
$17,850 with Air Force for Education Services. Signed on 2004-11-18. Completion date: 2004-11-20.
$1,509 with Air Force for Educational Studies and Analyses. Signed on 2003-09-26. Completion date: 2003-09-12.
KRISTIN BOWLING (350 WEST 4TH STREET in SOUTH BOSTON, MA; small business) : $34,156 in 3 contractsfrom 2004 to 2005
$20,600 with Army for Technical Assistance. Signed on 2005-02-15. Completion date: 2006-02-21.
$13,556, same as above.Signed on 2004-09-03. Completion date: 2005-05-09.
$0, same as above.Signed on 2004-09-03. Completion date: 2005-05-09.
ANTCZAK, AMANDA J (231 W 5TH APT 1 in BOSTON, MA; small business) : $19,324 in 2 contractsin 2006
$14,723 with Army for Technical Assistance. Signed on 2006-07-05. Completion date: 2007-04-02.
$4,601, same as above.Signed on 2006-03-23. Completion date: 2007-04-02.
NES COMPANIES LP (346 D STREET in BOSTON, MA)
$16,000 with Army for Lease or Rental of Equipment -- Tractors. Signed on 2003-12-04. Completion date: 2004-04-05.
EKITON CORPORATION (17 POWER HOUSE ST R in BOSTON, MA; small business)
$7,480 with Army for Blocks, Tackle, Rigging, and Slings. Signed on 2005-09-16. Completion date: 2005-10-15.
BSC COMPANIES, INC (15 ELKINS ST in BOSTON, MA; small business)
$5,700 with Army for Land Surveys, Cadastral Services (non-construction). Taking place in RI. Signed on 2002-05-01. Completion date: 2002-05-15.
Top industries in this zip code by the number of employees in 2005:
Professional, Scientific, and Technical Services: Research and Development in the Physical, Engineering, and Life Sciences (500-999 employees: 1 establishment, 20-49 employees: 1 establishment)
Administrative and Support and Waste Management and Remediation Services: Janitorial Services (250-499: 1, 20-49: 1, 1-4: 2)
Real Estate and Rental and Leasing: Lessors of Residential Buildings and Dwellings (250-499: 1, 1-4: 2)
Health Care and Social Assistance: Nursing Care Facilities (250-499: 1)
Real Estate and Rental and Leasing: Other Commercial and Industrial Machinery and Equipment Rental and Leasing (100-249: 1, 50-99: 1, 10-19: 1, 1-4: 1)
People in group quarters in 2010:
361 people in nursing facilities/skilled-nursing facilities
51 people in residential treatment centers for adults
24 people in group homes for juveniles (non-correctional)
23 people in other noninstitutional facilities
2 people in group homes intended for adults
People in group quarters in 2000:
362 people in nursing homes
25 people in homes or halfway houses for drug/alcohol abuse
13 people in religious group quarters
12 people in homes for the mentally ill
5 people in homes for abused, dependent, and neglected children
Fatal accident statistics in 2014:
Fatal accident count: 1
Vehicles involved in fatal accidents: 1
Fatal accidents caused by drunken drivers: 0
Fatalities: 1
Persons involved in fatal accidents: 1
Pedestrians involved in fatal accidents: 1
Fatal accident statistics in 2013:
Fatal accident count: 1
Vehicles involved in fatal accidents: 1
Fatal accidents caused by drunken drivers: 0
Fatalities: 1
Persons involved in fatal accidents: 1
Pedestrians involved in fatal accidents: 1
Home Mortgage Disclosure Act Aggregated Statistics For Year 2009 (Based on 2 full and 14 partial tracts)
A) FHA, FSA/RHS & VA Home Purchase Loans
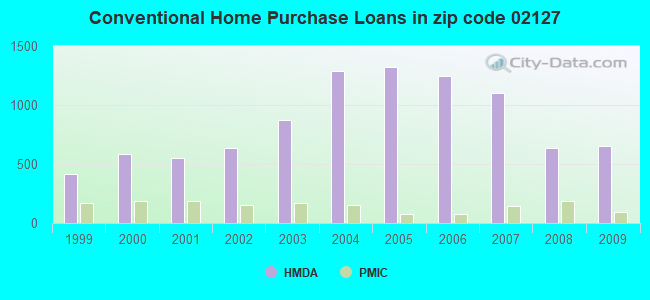
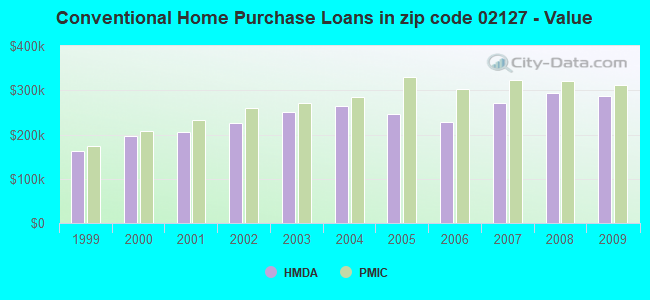
B) Conventional Home Purchase Loans
C) Refinancings
D) Home Improvement Loans
E) Loans on Dwellings For 5+ Families
F) Non-occupant Loans on < 5 Family Dwellings (A B C & D)
Number
Average Value
Number
Average Value
Number
Average Value
Number
Average Value
Number
Average Value
Number
Average Value
LOANS ORIGINATED
63
$346,739
650
$286,106
1,314
$287,922
28
$75,015
4
$2,779,465
159
$323,773
APPLICATIONS APPROVED, NOT ACCEPTED
5
$327,320
43
$309,103
101
$304,656
2
$444,500
2
$666,750
14
$393,410
APPLICATIONS DENIED
12
$337,211
97
$255,040
304
$300,322
9
$16,431
1
$1,195,560
43
$240,254
APPLICATIONS WITHDRAWN
14
$303,036
67
$278,721
235
$280,580
11
$212,605
2
$340,215
34
$254,487
FILES CLOSED FOR INCOMPLETENESS
1
$421,940
9
$193,902
70
$292,163
5
$249,980
0
$0
7
$272,073
Aggregated Statistics For Year 2008 (Based on 3 full and 14 partial tracts)
A) FHA, FSA/RHS & VA Home Purchase Loans
B) Conventional Home Purchase Loans
C) Refinancings
D) Home Improvement Loans
E) Loans on Dwellings For 5+ Families
F) Non-occupant Loans on < 5 Family Dwellings (A B C & D)
Number
Average Value
Number
Average Value
Number
Average Value
Number
Average Value
Number
Average Value
Number
Average Value
LOANS ORIGINATED
20
$296,237
635
$293,167
745
$290,563
31
$158,872
6
$784,922
159
$305,015
APPLICATIONS APPROVED, NOT ACCEPTED
3
$339,217
62
$313,797
85
$274,423
3
$42,887
0
$0
14
$232,346
APPLICATIONS DENIED
16
$348,801
86
$277,219
172
$303,734
39
$60,376
0
$0
36
$226,075
APPLICATIONS WITHDRAWN
4
$439,840
112
$304,370
129
$304,524
2
$98,900
1
$564,840
19
$273,344
FILES CLOSED FOR INCOMPLETENESS
1
$248,000
27
$388,069
20
$273,420
3
$319,843
0
$0
7
$525,093
Aggregated Statistics For Year 2007 (Based on 3 full and 14 partial tracts)
A) FHA, FSA/RHS & VA Home Purchase Loans
B) Conventional Home Purchase Loans
C) Refinancings
D) Home Improvement Loans
E) Loans on Dwellings For 5+ Families
F) Non-occupant Loans on < 5 Family Dwellings (A B C & D)
G) Loans On Manufactured Home Dwelling (A B C & D)
Number
Average Value
Number
Average Value
Number
Average Value
Number
Average Value
Number
Average Value
Number
Average Value
Number
Average Value
LOANS ORIGINATED
3
$380,593
1,103
$271,144
690
$269,831
71
$121,001
16
$466,790
231
$310,558
0
$0
APPLICATIONS APPROVED, NOT ACCEPTED
0
$0
136
$285,545
118
$265,186
18
$168,971
0
$0
32
$285,668
0
$0
APPLICATIONS DENIED
3
$417,350
167
$263,863
341
$316,576
41
$64,581
3
$948,067
138
$283,957
0
$0
APPLICATIONS WITHDRAWN
6
$275,207
104
$244,268
112
$279,335
9
$335,047
0
$0
37
$294,339
2
$56,005
FILES CLOSED FOR INCOMPLETENESS
0
$0
20
$244,059
57
$355,349
3
$132,143
0
$0
7
$271,111
0
$0
Aggregated Statistics For Year 2006 (Based on 3 full and 14 partial tracts)
A) FHA, FSA/RHS & VA Home Purchase Loans
B) Conventional Home Purchase Loans
C) Refinancings
D) Home Improvement Loans
E) Loans on Dwellings For 5+ Families
F) Non-occupant Loans on < 5 Family Dwellings (A B C & D)
G) Loans On Manufactured Home Dwelling (A B C & D)
Number
Average Value
Number
Average Value
Number
Average Value
Number
Average Value
Number
Average Value
Number
Average Value
Number
Average Value
LOANS ORIGINATED
1
$320,000
1,242
$229,329
885
$270,090
112
$111,956
14
$692,983
276
$313,465
0
$0
APPLICATIONS APPROVED, NOT ACCEPTED
0
$0
97
$222,659
107
$278,525
23
$139,690
1
$1,950,000
32
$325,005
0
$0
APPLICATIONS DENIED
2
$365,000
202
$244,754
308
$286,296
42
$131,188
2
$452,665
76
$302,232
3
$38,200
APPLICATIONS WITHDRAWN
0
$0
125
$252,549
200
$280,144
10
$144,957
0
$0
38
$332,934
0
$0
FILES CLOSED FOR INCOMPLETENESS
0
$0
32
$238,499
50
$293,565
2
$109,040
0
$0
8
$402,822
0
$0
Aggregated Statistics For Year 2005 (Based on 3 full and 14 partial tracts)
A) FHA, FSA/RHS & VA Home Purchase Loans
B) Conventional Home Purchase Loans
C) Refinancings
D) Home Improvement Loans
E) Loans on Dwellings For 5+ Families
F) Non-occupant Loans on < 5 Family Dwellings (A B C & D)
G) Loans On Manufactured Home Dwelling (A B C & D)
Number
Average Value
Number
Average Value
Number
Average Value
Number
Average Value
Number
Average Value
Number
Average Value
Number
Average Value
LOANS ORIGINATED
2
$227,585
1,322
$246,923
961
$287,546
92
$185,762
16
$735,776
299
$327,371
3
$252,263
APPLICATIONS APPROVED, NOT ACCEPTED
0
$0
101
$265,323
101
$234,234
13
$89,364
4
$280,035
35
$269,838
1
$215,000
APPLICATIONS DENIED
1
$320,140
224
$259,914
272
$290,014
63
$119,362
4
$240,772
80
$309,870
0
$0
APPLICATIONS WITHDRAWN
0
$0
168
$271,831
307
$285,498
22
$189,841
0
$0
64
$327,268
0
$0
FILES CLOSED FOR INCOMPLETENESS
0
$0
35
$250,274
60
$293,925
5
$362,480
1
$366,100
13
$328,608
0
$0
Aggregated Statistics For Year 2004 (Based on 3 full and 14 partial tracts)
A) FHA, FSA/RHS & VA Home Purchase Loans
B) Conventional Home Purchase Loans
C) Refinancings
D) Home Improvement Loans
E) Loans on Dwellings For 5+ Families
F) Non-occupant Loans on < 5 Family Dwellings (A B C & D)
G) Loans On Manufactured Home Dwelling (A B C & D)
Number
Average Value
Number
Average Value
Number
Average Value
Number
Average Value
Number
Average Value
Number
Average Value
Number
Average Value
LOANS ORIGINATED
1
$285,000
1,291
$263,906
1,006
$247,128
66
$138,087
8
$767,912
279
$289,702
5
$85,028
APPLICATIONS APPROVED, NOT ACCEPTED
0
$0
127
$279,412
104
$239,967
22
$75,400
0
$0
34
$306,081
3
$81,160
APPLICATIONS DENIED
1
$194,490
193
$263,002
231
$250,121
48
$129,835
1
$697,410
49
$293,052
1
$43,000
APPLICATIONS WITHDRAWN
0
$0
116
$242,456
229
$249,620
14
$111,256
3
$374,147
44
$269,482
0
$0
FILES CLOSED FOR INCOMPLETENESS
0
$0
34
$207,736
51
$282,553
2
$75,965
1
$318,820
14
$256,665
0
$0
Aggregated Statistics For Year 2003 (Based on 3 full and 14 partial tracts)
A) FHA, FSA/RHS & VA Home Purchase Loans
B) Conventional Home Purchase Loans
C) Refinancings
D) Home Improvement Loans
E) Loans on Dwellings For 5+ Families
F) Non-occupant Loans on < 5 Family Dwellings (A B C & D)
Number
Average Value
Number
Average Value
Number
Average Value
Number
Average Value
Number
Average Value
Number
Average Value
LOANS ORIGINATED
7
$344,757
877
$251,551
2,521
$218,736
55
$77,916
22
$554,805
487
$259,203
APPLICATIONS APPROVED, NOT ACCEPTED
2
$272,500
91
$264,335
249
$222,973
11
$43,543
0
$0
55
$272,299
APPLICATIONS DENIED
0
$0
128
$243,180
381
$240,447
34
$119,791
2
$2,313,470
82
$257,075
APPLICATIONS WITHDRAWN
3
$301,650
98
$246,322
292
$209,013
10
$67,139
0
$0
46
$266,283
FILES CLOSED FOR INCOMPLETENESS
0
$0
15
$233,913
47
$219,067
3
$32,690
1
$258,000
12
$297,152
Aggregated Statistics For Year 2002 (Based on 3 full and 14 partial tracts)
A) FHA, FSA/RHS & VA Home Purchase Loans
B) Conventional Home Purchase Loans
C) Refinancings
D) Home Improvement Loans
E) Loans on Dwellings For 5+ Families
F) Non-occupant Loans on < 5 Family Dwellings (A B C & D)
Number
Average Value
Number
Average Value
Number
Average Value
Number
Average Value
Number
Average Value
Number
Average Value
LOANS ORIGINATED
7
$267,047
639
$226,373
1,599
$209,165
95
$53,349
25
$582,905
335
$246,093
APPLICATIONS APPROVED, NOT ACCEPTED
0
$0
65
$228,585
167
$213,346
18
$82,977
0
$0
39
$228,414
APPLICATIONS DENIED
3
$259,770
54
$205,675
224
$228,852
64
$74,425
0
$0
56
$220,288
APPLICATIONS WITHDRAWN
2
$202,690
51
$261,609
148
$193,682
7
$63,513
2
$160,020
21
$203,658
FILES CLOSED FOR INCOMPLETENESS
0
$0
12
$227,612
49
$223,940
0
$0
0
$0
7
$303,244
Aggregated Statistics For Year 2001 (Based on 3 full and 14 partial tracts)
A) FHA, FSA/RHS & VA Home Purchase Loans
B) Conventional Home Purchase Loans
C) Refinancings
D) Home Improvement Loans
E) Loans on Dwellings For 5+ Families
F) Non-occupant Loans on < 5 Family Dwellings (A B C & D)
Number
Average Value
Number
Average Value
Number
Average Value
Number
Average Value
Number
Average Value
Number
Average Value
LOANS ORIGINATED
17
$217,924
548
$205,357
1,135
$200,588
56
$57,851
18
$562,081
248
$215,869
APPLICATIONS APPROVED, NOT ACCEPTED
2
$363,915
62
$213,982
121
$176,061
22
$55,160
4
$1,241,172
20
$200,002
APPLICATIONS DENIED
1
$259,000
52
$177,002
208
$171,969
56
$54,433
0
$0
33
$170,926
APPLICATIONS WITHDRAWN
2
$206,210
35
$238,650
171
$187,218
17
$55,161
2
$284,880
20
$222,536
FILES CLOSED FOR INCOMPLETENESS
0
$0
1
$255,050
32
$200,062
3
$73,587
0
$0
3
$123,000
Aggregated Statistics For Year 2000 (Based on 3 full and 14 partial tracts)
A) FHA, FSA/RHS & VA Home Purchase Loans
B) Conventional Home Purchase Loans
C) Refinancings
D) Home Improvement Loans
E) Loans on Dwellings For 5+ Families
F) Non-occupant Loans on < 5 Family Dwellings (A B C & D)
Number
Average Value
Number
Average Value
Number
Average Value
Number
Average Value
Number
Average Value
Number
Average Value
LOANS ORIGINATED
17
$227,162
582
$197,449
333
$159,313
62
$40,385
9
$486,902
115
$189,034
APPLICATIONS APPROVED, NOT ACCEPTED
0
$0
49
$186,160
39
$168,302
23
$23,939
0
$0
13
$171,058
APPLICATIONS DENIED
0
$0
90
$223,336
117
$160,518
56
$70,620
1
$2,000,000
20
$229,206
APPLICATIONS WITHDRAWN
2
$298,355
40
$216,884
54
$136,974
6
$74,357
2
$276,920
11
$152,429
FILES CLOSED FOR INCOMPLETENESS
0
$0
1
$197,000
24
$164,914
0
$0
0
$0
4
$152,662
Aggregated Statistics For Year 1999 (Based on 7 full and 6 partial tracts)
A) FHA, FSA/RHS & VA Home Purchase Loans
B) Conventional Home Purchase Loans
C) Refinancings
D) Home Improvement Loans
E) Loans on Dwellings For 5+ Families
F) Non-occupant Loans on < 5 Family Dwellings (A B C & D)
2002 - 2018 National Fire Incident Reporting System (NFIRS) incidents
Based on the data from the years 2002 - 2018 the average number of fire incidents per year is 201. The highest number of fire incidents - 247 took place in 2016, and the least - 118 in 2002. The data has a rising trend.
When looking into fire subcategories, the most incidents belonged to: Structure Fires (57.7%), and Outside Fires (30.1%).
Fire incident types reported to NFIRS in Zip Code 02127


 Nearest zip codes: 02210, 02111, 02125, 02110, 02118, 02203.


 Based on the data from the years 2002 - 2018 the average number of fire incidents per year is 201. The highest number of fire incidents - 247 took place in 2016, and the least - 118 in 2002. The data has a rising trend.
 When looking into fire subcategories, the most incidents belonged to: Structure Fires (57.7%), and Outside Fires (30.1%).