Estimated zip code population in 2022: 15,308 Zip code population in 2010: 14,608 Zip code population in 2000: 14,493
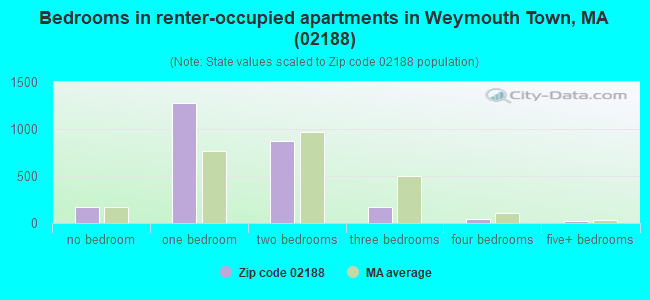
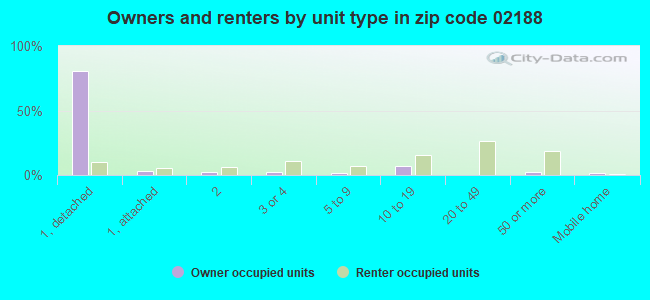
Houses and condos: 7,185 Renter-occupied apartments: 2,547
% of renters here:
37%
State:
38%
March 2022 cost of living index in zip code 02188: 133.9 (high, U.S. average is 100)
Land area: 3.7 sq. mi. Water area: 0.1 sq. mi.
Population density: 4,116 people per square mile
(average).
OSM Map
Google Map
MSN Map
OSM Map
General Map
Google Map
MSN Map
OSM Map
Google Map
MSN Map
OSM Map
Google Map
MSN Map
Please wait while loading the map...
Real estate property taxes paid for housing units in 2022:
This zip code:
0.9% ($4,986)
Massachusetts:
1.0% ($5,536)
Median real estate property taxes paid for housing units with mortgages in 2022: $5,138 (1.0%) Median real estate property taxes paid for housing units with no mortgage in 2022: $4,853 (0.9%)
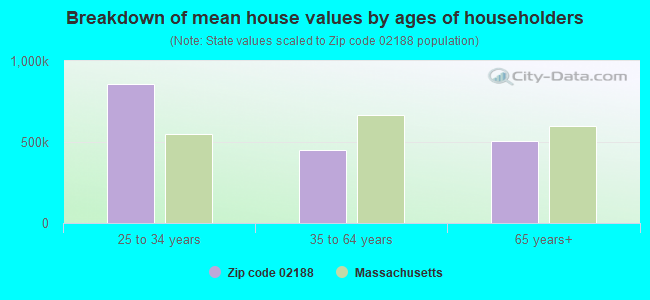
Estimated median house/condo value in 2022: $531,827
02188:
$531,827
Massachusetts:
$534,700
According to our research of Massachusetts and other state lists, there were 3 registered sex offenders living in 02188 zip code as of April 27, 2024. The ratio of all residents to sex offenders in zip code 02188 is 5,189 to 1. The ratio of registered sex offenders to all residents in this zip code is much lower than the state average.
Median resident age:
This zip code:
46.6 years
Massachusetts median age:
40.3 years
Average household size:
This zip code:
2.2 people
Massachusetts:
2.4 people
Averages for the 2020 tax year for zip code 02188, filed in 2021:
Average Adjusted Gross Income (AGI) in 2020: $75,530 (Individual Income Tax Returns)
Here:
$75,530
State:
$105,130
Salary/wage: $68,751 (reported on 81.5% of returns)
Here:
$68,751
State:
$82,951
(% of AGI for various income ranges: 1099.0% for AGIs below $25k, 3553.5% for AGIs $25k-50k, 6311.0% for AGIs $50k-75k, 9712.6% for AGIs $75k-100k, 18859.6% for AGIs $100k-200k, 60181.3% for AGIs over 200k)
Taxable interest for individuals: $817 (reported on 35.5% of returns)
This zip code:
$817
Massachusetts:
$2,361
(% of AGI for various income ranges: 23.8% for AGIs below $25k, 18.3% for AGIs $25k-50k, 32.8% for AGIs $50k-75k, 49.8% for AGIs $75k-100k, 74.1% for AGIs $100k-200k, 320.0% for AGIs over 200k)
Ordinary dividends: $2,930 (reported on 19.9% of returns)
Here:
$2,930
State:
$10,365
(% of AGI for various income ranges: 25.2% for AGIs below $25k, 21.3% for AGIs $25k-50k, 62.3% for AGIs $50k-75k, 107.0% for AGIs $75k-100k, 137.3% for AGIs $100k-200k, 1009.3% for AGIs over 200k)
Net capital gain/loss in AGI: +$11,010 (reported on 17.5% of returns)
Here:
+$11,010
State:
+$48,178
(% of AGI for various income ranges: 13.7% for AGIs below $25k, 36.1% for AGIs $25k-50k, 53.1% for AGIs $50k-75k, 63.2% for AGIs $75k-100k, 292.7% for AGIs $100k-200k, 7518.0% for AGIs over 200k)
Profit/loss from business: +$12,320 (reported on 13.8% of returns)
Here:
+$12,320
State:
+$20,792
(% of AGI for various income ranges: 124.7% for AGIs below $25k, 184.5% for AGIs $25k-50k, 200.9% for AGIs $50k-75k, 303.2% for AGIs $75k-100k, 407.1% for AGIs $100k-200k, 1435.3% for AGIs over 200k)
Taxable individual retirement arrangement distribution: $17,832 (reported on 9.4% of returns)
02188:
$17,832
Massachusetts:
$22,790
(% of AGI for various income ranges: 75.2% for AGIs below $25k, 95.2% for AGIs $25k-50k, 208.3% for AGIs $50k-75k, 308.0% for AGIs $75k-100k, 536.7% for AGIs $100k-200k, 1493.3% for AGIs over 200k)
Self-employed (Keogh) retirement plans: $12,533 (reported on 0.4% of returns)
02188:
$12,533
Massachusetts:
$26,868
(% of AGI for various income ranges: 39.2% for AGIs $100k-200k)
Total itemized deductions: $25,507 (reported on 12.2% of returns)
Here:
$25,507
State:
$36,722
(% of AGI for various income ranges: 98.8% for AGIs below $25k, 173.3% for AGIs $25k-50k, 342.6% for AGIs $50k-75k, 664.4% for AGIs $75k-100k, 1021.8% for AGIs $100k-200k, 2910.7% for AGIs over 200k)
Charity contributions: $3,465 (reported on 9.2% of returns)
Here:
$3,465
State:
$12,529
(% of AGI for various income ranges: 2.5% for AGIs below $25k, 14.8% for AGIs $25k-50k, 21.6% for AGIs $50k-75k, 53.3% for AGIs $75k-100k, 114.0% for AGIs $100k-200k, 486.0% for AGIs over 200k)
Taxes paid: $8,415 (reported on 12.1% of returns)
02188:
$8,415
State:
$8,782
(% of AGI for various income ranges: 18.2% for AGIs below $25k, 44.5% for AGIs $25k-50k, 101.8% for AGIs $50k-75k, 241.5% for AGIs $75k-100k, 370.7% for AGIs $100k-200k, 883.3% for AGIs over 200k)
Earned income credit: $1,522 (reported on 7.9% of returns)
Here:
$1,522
State:
$1,909
(% of AGI for various income ranges: 43.0% for AGIs below $25k, 37.5% for AGIs $25k-50k)
Percentage of individuals using paid preparers for their 2020 taxes: 92.1%
Here:
92%
State:
92%
(% for various income ranges: 89.1% for AGIs below $25k, 92.9% for AGIs $25k-50k, 92.1% for AGIs $50k-75k, 93.8% for AGIs $75k-100k, 93.3% for AGIs $100k-200k, 95.1% for AGIs over 200k)
Averages for the 2012 tax year for zip code 02188, filed in 2013:
Average Adjusted Gross Income (AGI) in 2012: $59,645 (Individual Income Tax Returns)
Here:
$59,645
State:
$81,425
Salary/wage: $56,240 (reported on 83.6% of returns)
Here:
$56,240
State:
$64,752
(% of AGI for various income ranges: 65.2% for AGIs below $25k, 76.1% for AGIs $25k-50k, 77.9% for AGIs $50k-75k, 80.5% for AGIs $75k-100k, 85.0% for AGIs $100k-200k, 69.5% for AGIs over 200k)
Taxable interest for individuals: $741 (reported on 41.4% of returns)
This zip code:
$741
Massachusetts:
$2,136
(% of AGI for various income ranges: 1.4% for AGIs below $25k, 0.7% for AGIs $25k-50k, 0.5% for AGIs $50k-75k, 0.4% for AGIs $75k-100k, 0.4% for AGIs $100k-200k, 0.4% for AGIs over 200k)
Ordinary dividends: $2,315 (reported on 20.8% of returns)
Here:
$2,315
State:
$9,473
(% of AGI for various income ranges: 1.8% for AGIs below $25k, 0.6% for AGIs $25k-50k, 0.8% for AGIs $50k-75k, 0.8% for AGIs $75k-100k, 0.5% for AGIs $100k-200k, 1.6% for AGIs over 200k)
Net capital gain/loss in AGI: +$4,637 (reported on 13.9% of returns)
Here:
+$4,637
State:
+$31,437
(% of AGI for various income ranges: 0.2% for AGIs $25k-50k, 0.4% for AGIs $50k-75k, 0.4% for AGIs $75k-100k, 0.5% for AGIs $100k-200k, 6.7% for AGIs over 200k)
Profit/loss from business: +$12,607 (reported on 11.2% of returns)
Here:
+$12,607
State:
+$20,662
(% of AGI for various income ranges: 8.8% for AGIs below $25k, 3.8% for AGIs $25k-50k, 1.6% for AGIs $50k-75k, 1.9% for AGIs $75k-100k, 1.3% for AGIs $100k-200k, 2.2% for AGIs over 200k)
Taxable individual retirement arrangement distribution: $13,290 (reported on 10.8% of returns)
02188:
$13,290
Massachusetts:
$18,892
(% of AGI for various income ranges: 4.2% for AGIs below $25k, 2.4% for AGIs $25k-50k, 2.2% for AGIs $50k-75k, 2.7% for AGIs $75k-100k, 2.4% for AGIs $100k-200k, 1.7% for AGIs over 200k)
Self-employment retirement plans: $7,733 (reported on 0.4% of returns)
02188:
$7,733
Massachusetts:
$20,669
Total itemized deductions: $20,856 (21% of AGI, reported on 38.4% of returns)
Here:
$20,856
State:
$28,907
Here:
21.0% of AGI
State:
18.2% of AGI
(% of AGI for various income ranges: 9.8% for AGIs below $25k, 10.0% for AGIs $25k-50k, 13.4% for AGIs $50k-75k, 14.0% for AGIs $75k-100k, 15.6% for AGIs $100k-200k, 12.2% for AGIs over 200k)
Charity contributions: $1,724 (reported on 31.6% of returns)
Here:
$1,724
State:
$4,208
(% of AGI for various income ranges: 0.5% for AGIs below $25k, 0.8% for AGIs $25k-50k, 0.9% for AGIs $50k-75k, 1.0% for AGIs $75k-100k, 1.0% for AGIs $100k-200k, 1.0% for AGIs over 200k)
Taxes paid: $8,460 (reported on 38.2% of returns)
02188:
$8,460
State:
$13,303
(% of AGI for various income ranges: 2.5% for AGIs below $25k, 2.7% for AGIs $25k-50k, 4.7% for AGIs $50k-75k, 5.4% for AGIs $75k-100k, 6.8% for AGIs $100k-200k, 7.2% for AGIs over 200k)
Earned income credit: $1,645 (reported on 9.8% of returns)
Here:
$1,645
State:
$1,971
(% of AGI for various income ranges: 3.1% for AGIs below $25k, 0.6% for AGIs $25k-50k)
Percentage of individuals using paid preparers for their 2012 taxes: 57.1%
Here:
57%
State:
56%
(% for various income ranges: 53.4% for AGIs below $25k, 54.3% for AGIs $25k-50k, 57.9% for AGIs $50k-75k, 61.4% for AGIs $75k-100k, 63.0% for AGIs $100k-200k, 70.6% for AGIs over 200k)
Averages for the 2004 tax year for zip code 02188, filed in 2005:
Average Adjusted Gross Income (AGI) in 2004: $50,584 (Individual Income Tax Returns)
Here:
$50,584
State:
$62,877
Salary/wage: $48,510 (reported on 84.5% of returns)
Here:
$48,510
State:
$52,969
(% of AGI for various income ranges: 88.1% for AGIs below $10k, 64.8% for AGIs $10k-25k, 81.3% for AGIs $25k-50k, 82.7% for AGIs $50k-75k, 88.3% for AGIs $75k-100k, 78.6% for AGIs over 100k)
Taxable interest for individuals: $1,080 (reported on 55.8% of returns)
This zip code:
$1,080
Massachusetts:
$1,945
(% of AGI for various income ranges: 4.0% for AGIs below $10k, 2.7% for AGIs $10k-25k, 1.3% for AGIs $25k-50k, 1.2% for AGIs $50k-75k, 0.6% for AGIs $75k-100k, 1.0% for AGIs over 100k)
Taxable dividends: $1,443 (reported on 25.7% of returns)
Here:
$1,443
State:
$5,323
(% of AGI for various income ranges: 2.4% for AGIs below $10k, 1.4% for AGIs $10k-25k, 0.6% for AGIs $25k-50k, 0.6% for AGIs $50k-75k, 0.5% for AGIs $75k-100k, 0.8% for AGIs over 100k)
Net capital gain/loss: +$5,169 (reported on 18.7% of returns)
Here:
+$5,169
State:
+$20,377
(% of AGI for various income ranges: -1.3% for AGIs below $10k, 0.2% for AGIs $10k-25k, 0.2% for AGIs $25k-50k, 0.1% for AGIs $50k-75k, 0.6% for AGIs $75k-100k, 5.2% for AGIs over 100k)
Profit/loss from business: +$10,590 (reported on 11.1% of returns)
Here:
+$10,590
State:
+$17,837
(% of AGI for various income ranges: 6.2% for AGIs below $10k, 5.0% for AGIs $10k-25k, 2.4% for AGIs $25k-50k, 2.2% for AGIs $50k-75k, 1.0% for AGIs $75k-100k, 2.4% for AGIs over 100k)
IRA payment deduction: $2,896 (reported on 2.7% of returns)
02188:
$2,896
Massachusetts:
$3,100
(% of AGI for various income ranges: 0.2% for AGIs $10k-25k, 0.3% for AGIs $25k-50k, 0.1% for AGIs $50k-75k, 0.1% for AGIs $75k-100k, 0.1% for AGIs over 100k)
Self-employed pension: $7,971 (reported on 0.5% of returns)
Here:
$7,971
Massachusetts:
$14,516
Total itemized deductions: $17,677 (22% of AGI, reported on 40.3% of returns)
Here:
$17,677
State:
$22,573
Here:
21.9% of AGI
State:
19.5% of AGI
(% of AGI for various income ranges: 17.4% for AGIs below $10k, 11.4% for AGIs $10k-25k, 11.8% for AGIs $25k-50k, 15.5% for AGIs $50k-75k, 16.3% for AGIs $75k-100k, 13.7% for AGIs over 100k)
Charity contributions deductions: $1,848 (2% of AGI, reported on 37.4% of returns)
Here:
$1,848
State:
$3,295
Here:
2.2% of AGI
State:
2.7% of AGI
(% of AGI for various income ranges: 0.7% for AGIs below $10k, 0.9% for AGIs $10k-25k, 1.1% for AGIs $25k-50k, 1.4% for AGIs $50k-75k, 1.4% for AGIs $75k-100k, 1.5% for AGIs over 100k)
Total tax: $7,043 (reported on 83.8% of returns)
02188:
$7,043
State:
$11,494
(% of AGI for various income ranges: 2.7% for AGIs below $10k, 4.9% for AGIs $10k-25k, 8.4% for AGIs $25k-50k, 10.3% for AGIs $50k-75k, 10.7% for AGIs $75k-100k, 16.7% for AGIs over 100k)
Earned income credit: $1,372 (reported on 6.8% of returns)
Here:
$1,372
State:
$1,518
Percentage of individuals using paid preparers for their 2004 taxes: 57.9%
Here:
58%
State:
58%
(% for various income ranges: 48.4% for AGIs below $10k, 57.9% for AGIs $10k-25k, 55.0% for AGIs $25k-50k, 61.2% for AGIs $50k-75k, 63.1% for AGIs $75k-100k, 67.8% for AGIs over 100k)
Likely homosexual households (counted as self-reported same-sex unmarried-partner households)
Lesbian couples: 0.5% of all households
Gay men: 0.0% of all households
Household received Food Stamps/SNAP in the past 12 months: 795 Household did not receive Food Stamps/SNAP in the past 12 months: 6,016
Women who had a birth in the past 12 months: 132 (127 now married, 9 unmarried) Women who did not have a birth in the past 12 months: 2,948 (1,338 now married, 1,594 unmarried)
Housing units in zip code 02188 with a mortgage: 2,815 (422 second mortgage, 429 both second mortgage and home equity loan) Houses without a mortgage: 112
Median monthly owner costs for units with a mortgage: $2,625 Median monthly owner costs for units without a mortgage: $950
Residents with income below the poverty level in 2022:
This zip code:
6.0%
Whole state:
10.4%
Residents with income below 50% of the poverty level in 2022:
This zip code:
3.3%
Whole state:
5.1%
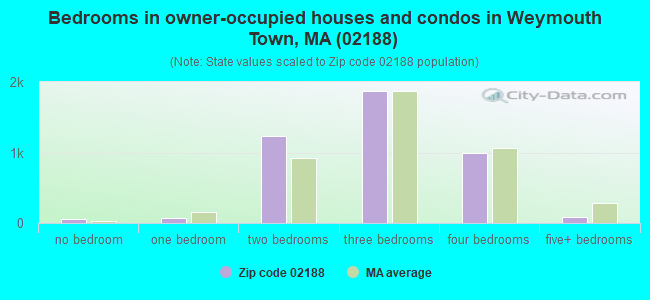
Median number of rooms in houses and condos:
Here:
6.4
State:
6.5
Median number of rooms in apartments:
Here:
3.4
State:
4.0
Notable locations in this zip code not listed on our city pages
Notable locations in zip code 02188: Route 3 Industrial Park (A), Weymouth Fire Department Station 3 (B), Weymouth Townhall (C), Tufts Library (D). Display/hide their locations on the map
Churches in zip code 02188 include: Sacred Heart Parish Church (A), New Life Foursquare Church (B), Community Baptist Church (C). Display/hide their locations on the map
Parks in zip code 02188 include: Webb Park (1), Weston Park (2), Newell Playground (3), Gagnon Park (4), House Rock Park (5). Display/hide their locations on the map
In group quarters: 215 (-1 institutionalized population)
Size of family households: 2,168 2-persons, 648 3-persons, 674 4-persons, 287 5-persons, 222 6-persons, 11 7-or-more-persons
Size of nonfamily households: 2,398 1-person, 454 2-persons, 21 3-persons
1,796 married couples with children.
357 single-parent households (65 men, 292 women).
84.2% of residents of 02188 zip code speak English at home.
2.4% of residents speak Spanish at home (44% very well, 28% well, 14% not well, 15% not at all).
8.0% of residents speak other Indo-European language at home (66% very well, 20% well, 9% not well, 5% not at all).
4.9% of residents speak Asian or Pacific Island language at home (49% very well, 25% well, 21% not well, 5% not at all).
0.5% of residents speak other language at home (100% very well).
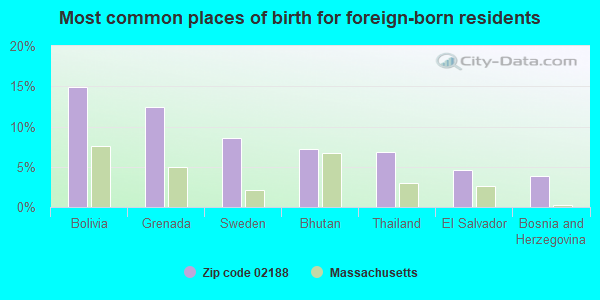
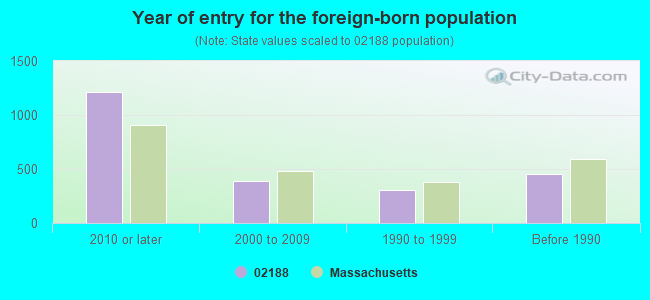
Foreign born population: 2,125 (13.9%) (53.2% of them are naturalized citizens)
Facilities with environmental interests located in this zip code:
MASSACHUSETTS ELECTRIC COMPANY (186 MAIN ST in WEYMOUTH, MA)
HAZARDOUS WASTE BIENNIAL REPORTER (Resource Conservation and Recovery Act (tracking hazardous waste)) Large Quantity Generators, more that 1000 kg of hazardous waste/month (Resource Conservation and Recovery Act (tracking hazardous waste)) - notification Business NAICS classification: ELECTRIC POWER DISTRIBUTION. Alternative names: MA ELEC CO WEYMOUTH DIST HQ, MASSACHUSETTS ELECRIC COMPANY, WEYMOUTH
ADVANCE AUTO PARTS 8644 (437 WASHINGTON ST in WEYMOUTH, MA)
LG SERVICES INC (367 WASHINGTON ST in WEYMOUTH, MA)
(Resource Conservation and Recovery Act (tracking hazardous waste)) Business NAICS classification: AUTOMOTIVE OIL CHANGE AND LUBRICATION SHOPS. Organizations: MEINEKE DISCOUNT MUFFLER (CONTACT/OPERATOR)
, KOULOURAS KONSTANTINOS (CONTACT/OWNER)
Alternative names: LG SERVICES INC DBA OIL CHANGE EXPRSS, MEINEKE DISCOUNT MUFFLER
BJS WHOLESALE CLUB INC (622 WASHINGTON ST in WEYMOUTH, MA)
Small Quantity Generators, between 100 kg and 1000 kg of hazardous waste/month (Resource Conservation and Recovery Act (tracking hazardous waste)) - notification Organizations: WABAN INC DBA BJS WHOLESALE CLUB (CONTACT/OWNER)
Alternative names: B J S WHOLESALE CLUB 018
MIDAS MUFFLER (462-464 WASHINGTON ST in WEYMOUTH, MA)
Conditionally Exempt Small Quantity Generators, less than 100 kg/month of hazardous waste (Resource Conservation and Recovery Act (tracking hazardous waste)) - notification Organizations: JLJ ENTERPRISES INC (CONTACT/OWNER)
MWRA FORE RIVER SIPHON (FORE RIVER in WEYMOUTH, MA)
National Pollutant Discharge Elimination System NON-MAJOR (Tracking pollutant discharge elimination systems) - permit
BRAVA CLEANERS (59 WASHINGTON ST in WEYMOUTH, MA)
(Resource Conservation and Recovery Act (tracking hazardous waste))
MONAHANS MARINE INC (396 WASHINGTON ST in WEYMOUTH, MA)
Conditionally Exempt Small Quantity Generators, less than 100 kg/month of hazardous waste (Resource Conservation and Recovery Act (tracking hazardous waste)) - notification Organizations: DANIEL P MONAHAN (CONTACT/OWNER)
NATIONAL TIRE & BATTERY 568 (175 NORTH MAIN ST in WEYMOUTH, MA)
Conditionally Exempt Small Quantity Generators, less than 100 kg/month of hazardous waste (Resource Conservation and Recovery Act (tracking hazardous waste)) Organizations: TIRE KINGDOM (CONTACT/OPERATOR)
EAST WEYMOUTH AUTO BODY (374R WASHINGTON ST in WEYMOUTH, MA)
Conditionally Exempt Small Quantity Generators, less than 100 kg/month of hazardous waste (Resource Conservation and Recovery Act (tracking hazardous waste)) - notification Organizations: KENNETH DELUZE (CONTACT/OWNER)
AGRICO AMERICAN AGRICULTURAL CHEM CO FMR (RIVER STREET in WEYMOUTH, MA)
SUPERFUND (Superfund database) Alternative names: AGRICO AMERICAN AGRICULTURAL CHEM. CO.
MICROSONICS INC (60 WINTER ST in WEYMOUTH, MA)
Small Quantity Generators, between 100 kg and 1000 kg of hazardous waste/month (Resource Conservation and Recovery Act (tracking hazardous waste)) - notification
Housing units lacking complete plumbing facilities: 0.5% Housing units lacking complete kitchen facilities: 1.0%
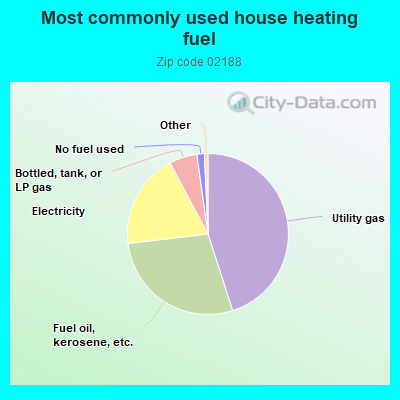
45.1%Utility gas
28.1%Fuel oil, kerosene, etc.
19.1%Electricity
5.6%Bottled, tank, or LP gas
1.5%No fuel used
Population in 1990: 13,187. Population change in the 1990s: +1,306 (+9.9%).
Place of birth for U.S.-born residents:
This state: 11,004
Northeast: 933
Midwest: 351
South: 447
West: 195
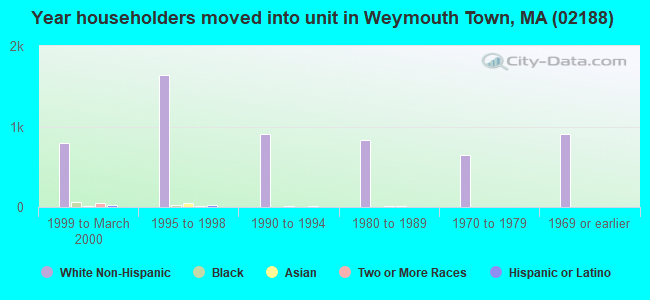
62% of the 02188 zip code residents lived in the same house 5 years ago. Out of people who lived in different houses, 60% lived in this county. Out of people who lived in different counties, 50% lived in Massachusetts.
85% of the 02188 zip code residents lived in the same house 1 year ago. Out of people who lived in different houses, 42% moved from this county. Out of people who lived in different houses, 44% moved from different county within same state. Out of people who lived in different houses, 12% moved from different state.
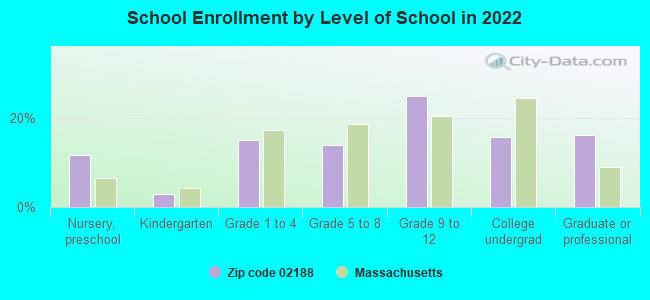
Private vs. public school enrollment:
Students in private schools in grades 1 to 8 (elementary and middle school): 38
Here:
4.8%
Massachusetts:
10.3%
Students in private schools in grades 9 to 12 (high school): 78
Here:
11.5%
Massachusetts:
12.3%
Students in private undergraduate colleges: 156
Here:
36.8%
Massachusetts:
51.2%
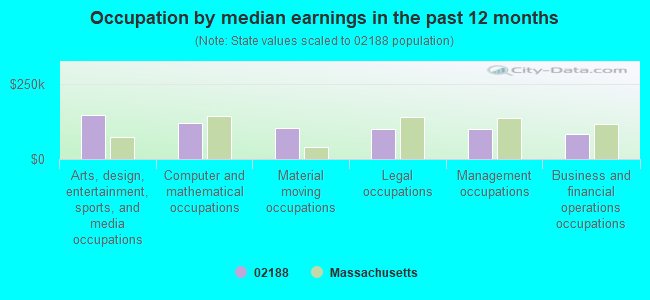
Occupation by median earnings in the past 12 months ($)
146,073Arts, design, entertainment, sports, and media occupations
121,602Computer and mathematical occupations
104,505Material moving occupations
101,093Legal occupations
99,002Management occupations
84,127Business and financial operations occupations
Top industries in this zip code by the number of employees in 2005:
Health Care and Social Assistance: Nursing Care Facilities (100-249 employees: 1 establishment, 50-99 employees: 1 establishment, 20-49 employees: 1 establishment, 10-19 employees: 1 establishment, 1-4 employees: 1 establishment)
2002 - 2017 National Fire Incident Reporting System (NFIRS) incidents
According to the data from the years 2002 - 2017 the average number of fires per year is 19. The highest number of fire incidents - 52 took place in 2004, and the least - 0 in 2015. The data has a declining trend.
When looking into fire subcategories, the most reports belonged to: Structure Fires (57.4%), and Outside Fires (27.4%).
Fire incident types reported to NFIRS in Zip Code 02188


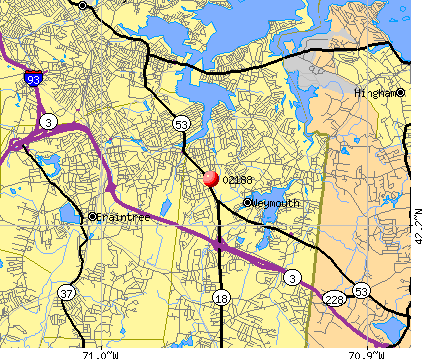 Nearest zip codes: 02189, 02190, 02191, 02184, 02169, 02343.


 According to the data from the years 2002 - 2017 the average number of fires per year is 19. The highest number of fire incidents - 52 took place in 2004, and the least - 0 in 2015. The data has a declining trend.
 When looking into fire subcategories, the most reports belonged to: Structure Fires (57.4%), and Outside Fires (27.4%).