Estimated zip code population in 2022: 11,278 Zip code population in 2010: 10,745 Zip code population in 2000: 10,738
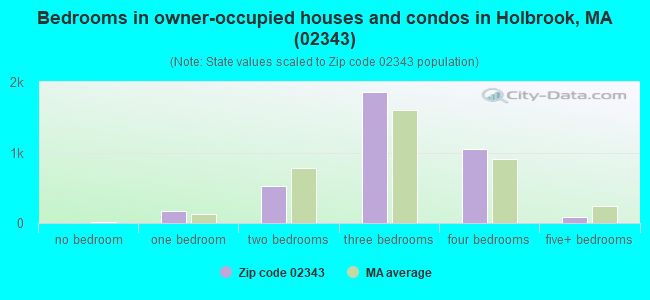
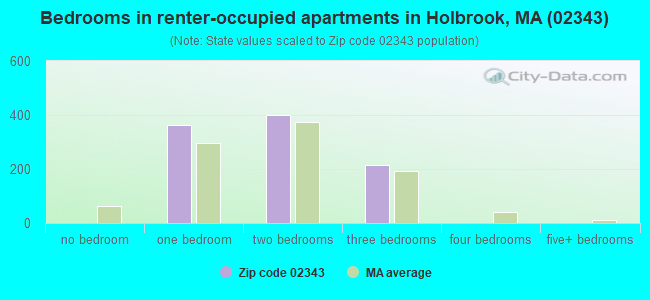
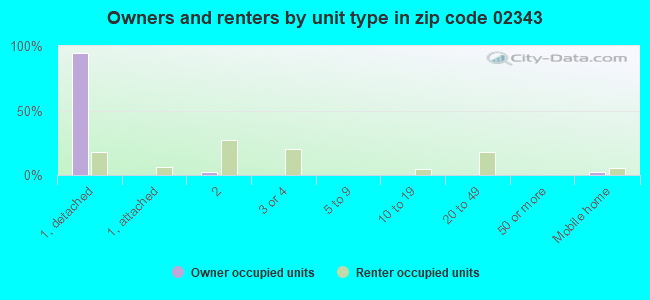
Houses and condos: 4,756 Renter-occupied apartments: 979
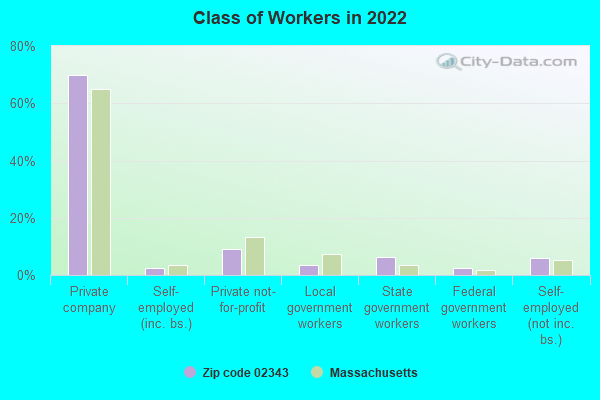
% of renters here:
21%
State:
38%
March 2022 cost of living index in zip code 02343: 131.9 (high, U.S. average is 100)
Land area: 7.0 sq. mi. Water area: 0.1 sq. mi.
Population density: 1,610 people per square mile
(low).
OSM Map
Google Map
MSN Map
OSM Map
General Map
Google Map
MSN Map
OSM Map
Google Map
MSN Map
OSM Map
Google Map
MSN Map
Please wait while loading the map...
Real estate property taxes paid for housing units in 2022:
This zip code:
1.4% ($6,049)
Massachusetts:
1.0% ($5,536)
Median real estate property taxes paid for housing units with mortgages in 2022: $5,997 (1.3%) Median real estate property taxes paid for housing units with no mortgage in 2022: $6,206 (1.5%)
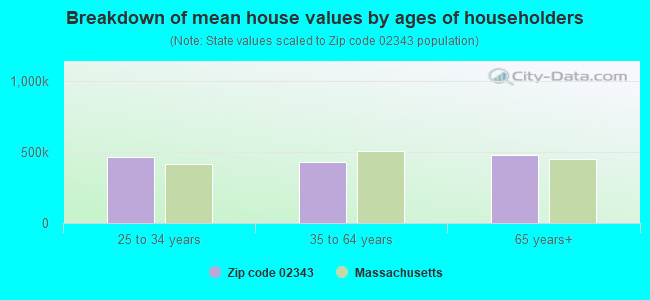
Estimated median house/condo value in 2022: $444,755
02343:
$444,755
Massachusetts:
$534,700
According to our research of Massachusetts and other state lists, there were 2 registered sex offenders living in 02343 zip code as of April 27, 2024. The ratio of all residents to sex offenders in zip code 02343 is 5,403 to 1. The ratio of registered sex offenders to all residents in this zip code is much lower than the state average.
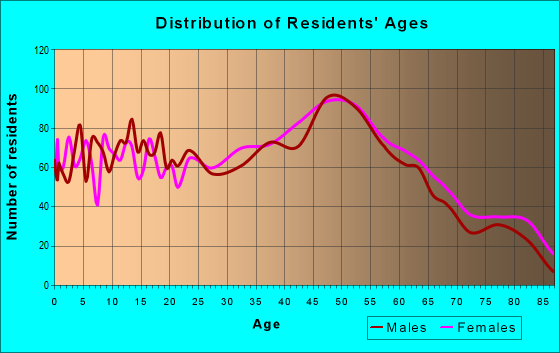
Median resident age:
This zip code:
43.7 years
Massachusetts median age:
40.3 years
Average household size:
This zip code:
2.4 people
Massachusetts:
2.4 people
Averages for the 2020 tax year for zip code 02343, filed in 2021:
Average Adjusted Gross Income (AGI) in 2020: $66,890 (Individual Income Tax Returns)
Here:
$66,890
State:
$105,130
Salary/wage: $60,603 (reported on 84.4% of returns)
Here:
$60,603
State:
$82,951
(% of AGI for various income ranges: 1156.4% for AGIs below $25k, 3573.3% for AGIs $25k-50k, 6434.2% for AGIs $50k-75k, 9668.4% for AGIs $75k-100k, 18026.1% for AGIs $100k-200k, 56578.6% for AGIs over 200k)
Taxable interest for individuals: $732 (reported on 31.4% of returns)
This zip code:
$732
Massachusetts:
$2,361
(% of AGI for various income ranges: 19.7% for AGIs below $25k, 14.3% for AGIs $25k-50k, 25.8% for AGIs $50k-75k, 44.7% for AGIs $75k-100k, 73.4% for AGIs $100k-200k, 174.3% for AGIs over 200k)
Ordinary dividends: $2,291 (reported on 14.4% of returns)
Here:
$2,291
State:
$10,365
(% of AGI for various income ranges: 18.4% for AGIs below $25k, 17.5% for AGIs $25k-50k, 37.0% for AGIs $50k-75k, 68.4% for AGIs $75k-100k, 100.7% for AGIs $100k-200k, 457.1% for AGIs over 200k)
Net capital gain/loss in AGI: +$11,910 (reported on 11.5% of returns)
Here:
+$11,910
State:
+$48,178
(% of AGI for various income ranges: 6.3% for AGIs below $25k, 14.1% for AGIs $25k-50k, 45.1% for AGIs $50k-75k, 98.2% for AGIs $75k-100k, 238.4% for AGIs $100k-200k, 8171.4% for AGIs over 200k)
Profit/loss from business: +$10,780 (reported on 13.3% of returns)
Here:
+$10,780
State:
+$20,792
(% of AGI for various income ranges: 107.3% for AGIs below $25k, 125.4% for AGIs $25k-50k, 64.7% for AGIs $50k-75k, 207.1% for AGIs $75k-100k, 315.6% for AGIs $100k-200k, 3720.0% for AGIs over 200k)
Taxable individual retirement arrangement distribution: $17,936 (reported on 8.1% of returns)
02343:
$17,936
Massachusetts:
$22,790
(% of AGI for various income ranges: 71.3% for AGIs below $25k, 104.5% for AGIs $25k-50k, 152.6% for AGIs $50k-75k, 170.8% for AGIs $75k-100k, 544.3% for AGIs $100k-200k, 1765.7% for AGIs over 200k)
Total itemized deductions: $24,429 (reported on 13.8% of returns)
Here:
$24,429
State:
$36,722
(% of AGI for various income ranges: 61.6% for AGIs below $25k, 163.0% for AGIs $25k-50k, 543.0% for AGIs $50k-75k, 934.1% for AGIs $75k-100k, 993.1% for AGIs $100k-200k, 3495.7% for AGIs over 200k)
Charity contributions: $3,820 (reported on 9.7% of returns)
Here:
$3,820
State:
$12,529
(% of AGI for various income ranges: 12.9% for AGIs $25k-50k, 40.9% for AGIs $50k-75k, 88.0% for AGIs $75k-100k, 136.4% for AGIs $100k-200k, 615.7% for AGIs over 200k)
Taxes paid: $8,758 (reported on 13.8% of returns)
02343:
$8,758
State:
$8,782
(% of AGI for various income ranges: 20.1% for AGIs below $25k, 53.8% for AGIs $25k-50k, 202.6% for AGIs $50k-75k, 350.0% for AGIs $75k-100k, 375.6% for AGIs $100k-200k, 961.4% for AGIs over 200k)
Earned income credit: $1,847 (reported on 10.0% of returns)
Here:
$1,847
State:
$1,909
(% of AGI for various income ranges: 63.8% for AGIs below $25k, 44.9% for AGIs $25k-50k)
Percentage of individuals using paid preparers for their 2020 taxes: 93.0%
Here:
93%
State:
92%
(% for various income ranges: 90.2% for AGIs below $25k, 93.1% for AGIs $25k-50k, 94.1% for AGIs $50k-75k, 94.4% for AGIs $75k-100k, 94.7% for AGIs $100k-200k, 95.0% for AGIs over 200k)
Averages for the 2012 tax year for zip code 02343, filed in 2013:
Average Adjusted Gross Income (AGI) in 2012: $55,262 (Individual Income Tax Returns)
Here:
$55,262
State:
$81,425
Salary/wage: $52,402 (reported on 85.7% of returns)
Here:
$52,402
State:
$64,752
(% of AGI for various income ranges: 71.5% for AGIs below $25k, 79.7% for AGIs $25k-50k, 77.9% for AGIs $50k-75k, 82.0% for AGIs $75k-100k, 87.4% for AGIs $100k-200k, 74.3% for AGIs over 200k)
Taxable interest for individuals: $628 (reported on 37.0% of returns)
This zip code:
$628
Massachusetts:
$2,136
(% of AGI for various income ranges: 1.3% for AGIs below $25k, 0.6% for AGIs $25k-50k, 0.4% for AGIs $50k-75k, 0.3% for AGIs $75k-100k, 0.2% for AGIs $100k-200k, 0.4% for AGIs over 200k)
Ordinary dividends: $1,830 (reported on 17.2% of returns)
Here:
$1,830
State:
$9,473
(% of AGI for various income ranges: 1.0% for AGIs below $25k, 0.6% for AGIs $25k-50k, 0.7% for AGIs $50k-75k, 0.6% for AGIs $75k-100k, 0.4% for AGIs $100k-200k, 0.3% for AGIs over 200k)
Net capital gain/loss in AGI: +$1,857 (reported on 10.4% of returns)
Here:
+$1,857
State:
+$31,437
(% of AGI for various income ranges: 0.2% for AGIs $100k-200k, 3.8% for AGIs over 200k)
Profit/loss from business: +$10,423 (reported on 11.6% of returns)
Here:
+$10,423
State:
+$20,662
(% of AGI for various income ranges: 6.2% for AGIs below $25k, 3.1% for AGIs $25k-50k, 2.3% for AGIs $50k-75k, 1.7% for AGIs $75k-100k, 1.6% for AGIs $100k-200k)
Taxable individual retirement arrangement distribution: $12,005 (reported on 10.6% of returns)
02343:
$12,005
Massachusetts:
$18,892
(% of AGI for various income ranges: 4.1% for AGIs below $25k, 2.0% for AGIs $25k-50k, 2.6% for AGIs $50k-75k, 2.1% for AGIs $75k-100k, 2.5% for AGIs $100k-200k)
Total itemized deductions: $20,278 (23% of AGI, reported on 41.7% of returns)
Here:
$20,278
State:
$28,907
Here:
23.0% of AGI
State:
18.2% of AGI
(% of AGI for various income ranges: 11.6% for AGIs below $25k, 11.5% for AGIs $25k-50k, 15.9% for AGIs $50k-75k, 17.3% for AGIs $75k-100k, 16.9% for AGIs $100k-200k, 13.5% for AGIs over 200k)
Charity contributions: $1,899 (reported on 34.0% of returns)
Here:
$1,899
State:
$4,208
(% of AGI for various income ranges: 0.8% for AGIs below $25k, 0.9% for AGIs $25k-50k, 1.0% for AGIs $50k-75k, 1.2% for AGIs $75k-100k, 1.2% for AGIs $100k-200k, 2.1% for AGIs over 200k)
Taxes paid: $8,597 (reported on 41.7% of returns)
02343:
$8,597
State:
$13,303
(% of AGI for various income ranges: 3.6% for AGIs below $25k, 4.0% for AGIs $25k-50k, 6.2% for AGIs $50k-75k, 7.2% for AGIs $75k-100k, 7.9% for AGIs $100k-200k, 7.4% for AGIs over 200k)
Earned income credit: $1,680 (reported on 10.9% of returns)
Here:
$1,680
State:
$1,971
(% of AGI for various income ranges: 3.4% for AGIs below $25k, 0.6% for AGIs $25k-50k)
Percentage of individuals using paid preparers for their 2012 taxes: 55.8%
Here:
56%
State:
56%
(% for various income ranges: 50.8% for AGIs below $25k, 53.4% for AGIs $25k-50k, 59.6% for AGIs $50k-75k, 62.3% for AGIs $75k-100k, 61.0% for AGIs $100k-200k, 62.5% for AGIs over 200k)
Averages for the 2004 tax year for zip code 02343, filed in 2005:
Average Adjusted Gross Income (AGI) in 2004: $46,800 (Individual Income Tax Returns)
Here:
$46,800
State:
$62,877
Salary/wage: $44,290 (reported on 86.5% of returns)
Here:
$44,290
State:
$52,969
(% of AGI for various income ranges: 83.7% for AGIs below $10k, 65.4% for AGIs $10k-25k, 82.9% for AGIs $25k-50k, 83.5% for AGIs $50k-75k, 88.7% for AGIs $75k-100k, 78.5% for AGIs over 100k)
Taxable interest for individuals: $814 (reported on 53.3% of returns)
This zip code:
$814
Massachusetts:
$1,945
(% of AGI for various income ranges: 3.0% for AGIs below $10k, 2.6% for AGIs $10k-25k, 1.0% for AGIs $25k-50k, 0.7% for AGIs $50k-75k, 0.6% for AGIs $75k-100k, 0.7% for AGIs over 100k)
Taxable dividends: $1,122 (reported on 21.7% of returns)
Here:
$1,122
State:
$5,323
(% of AGI for various income ranges: 1.9% for AGIs below $10k, 1.2% for AGIs $10k-25k, 0.6% for AGIs $25k-50k, 0.4% for AGIs $50k-75k, 0.2% for AGIs $75k-100k, 0.5% for AGIs over 100k)
Net capital gain/loss: +$7,969 (reported on 13.9% of returns)
Here:
+$7,969
State:
+$20,377
(% of AGI for various income ranges: -1.3% for AGIs below $10k, 0.2% for AGIs $10k-25k, 0.3% for AGIs $25k-50k, 0.5% for AGIs $50k-75k, 0.2% for AGIs $75k-100k, 8.2% for AGIs over 100k)
Profit/loss from business: +$10,614 (reported on 11.4% of returns)
Here:
+$10,614
State:
+$17,837
(% of AGI for various income ranges: 5.4% for AGIs below $10k, 5.2% for AGIs $10k-25k, 2.8% for AGIs $25k-50k, 3.1% for AGIs $50k-75k, 1.4% for AGIs $75k-100k, 2.0% for AGIs over 100k)
IRA payment deduction: $3,122 (reported on 2.5% of returns)
02343:
$3,122
Massachusetts:
$3,100
(% of AGI for various income ranges: 0.2% for AGIs $10k-25k, 0.2% for AGIs $25k-50k, 0.2% for AGIs $50k-75k, 0.1% for AGIs $75k-100k, 0.1% for AGIs over 100k)
Self-employed pension: $6,679 (reported on 0.5% of returns)
Here:
$6,679
Massachusetts:
$14,516
Total itemized deductions: $18,051 (25% of AGI, reported on 44.7% of returns)
Here:
$18,051
State:
$22,573
Here:
24.9% of AGI
State:
19.5% of AGI
(% of AGI for various income ranges: 10.4% for AGIs below $10k, 13.3% for AGIs $10k-25k, 14.2% for AGIs $25k-50k, 19.5% for AGIs $50k-75k, 20.1% for AGIs $75k-100k, 17.0% for AGIs over 100k)
Charity contributions deductions: $1,773 (2% of AGI, reported on 41.3% of returns)
Here:
$1,773
State:
$3,295
Here:
2.4% of AGI
State:
2.7% of AGI
(% of AGI for various income ranges: 0.5% for AGIs below $10k, 1.2% for AGIs $10k-25k, 1.2% for AGIs $25k-50k, 1.6% for AGIs $50k-75k, 1.7% for AGIs $75k-100k, 1.9% for AGIs over 100k)
Total tax: $5,690 (reported on 81.8% of returns)
02343:
$5,690
State:
$11,494
(% of AGI for various income ranges: 2.3% for AGIs below $10k, 4.5% for AGIs $10k-25k, 7.9% for AGIs $25k-50k, 9.1% for AGIs $50k-75k, 9.8% for AGIs $75k-100k, 14.4% for AGIs over 100k)
Earned income credit: $1,290 (reported on 8.5% of returns)
Here:
$1,290
State:
$1,518
Percentage of individuals using paid preparers for their 2004 taxes: 58.3%
Here:
58%
State:
58%
(% for various income ranges: 43.6% for AGIs below $10k, 59.0% for AGIs $10k-25k, 56.4% for AGIs $25k-50k, 64.3% for AGIs $50k-75k, 63.6% for AGIs $75k-100k, 71.1% for AGIs over 100k)
Likely homosexual households (counted as self-reported same-sex unmarried-partner households)
Lesbian couples: 0.6% of all households
Gay men: 0.4% of all households
Household received Food Stamps/SNAP in the past 12 months: 694 Household did not receive Food Stamps/SNAP in the past 12 months: 3,982
Women who had a birth in the past 12 months: 145 (120 now married, 26 unmarried) Women who did not have a birth in the past 12 months: 2,337 (1,050 now married, 1,274 unmarried)
Housing units in zip code 02343 with a mortgage: 2,681 (330 second mortgage, 294 both second mortgage and home equity loan) Houses without a mortgage: 183
Median monthly owner costs for units with a mortgage: $2,480 Median monthly owner costs for units without a mortgage: $1,053
Residents with income below the poverty level in 2022:
This zip code:
7.8%
Whole state:
10.4%
Residents with income below 50% of the poverty level in 2022:
This zip code:
3.2%
Whole state:
5.1%
Median number of rooms in houses and condos:
Here:
6.3
State:
6.5
Median number of rooms in apartments:
Here:
4.0
State:
4.0
Notable locations in this zip code not listed on our city pages
Notable locations in zip code 02343: Holbrook-Randolph Station (A), New Highland Plaza (B), Holbrook Fire Department (C), Holbrook Public Library (D), Holbrook Townhall (E). Display/hide their locations on the map
Shopping Centers: Angelo's Shopping Center (1), Angelos Shopping Center (2), New Highland Plaza Shopping Center (3). Display/hide their locations on the map
Churches in zip code 02343 include: Church of Christ (A), Winthrop Congregational Church (B), Temple Beth Shalom (C), Holbrook United Methodist Church (D). Display/hide their locations on the map
In group quarters: 64 (-1 institutionalized population)
Size of family households: 1,326 2-persons, 845 3-persons, 657 4-persons, 237 5-persons, 13 6-persons, 13 7-or-more-persons
Size of nonfamily households: 1,309 1-person, 269 2-persons
1,248 married couples with children.
818 single-parent households (114 men, 704 women).
85.8% of residents of 02343 zip code speak English at home.
1.8% of residents speak Spanish at home (82% very well, 18% well).
8.4% of residents speak other Indo-European language at home (84% very well, 16% well).
4.1% of residents speak Asian or Pacific Island language at home (48% very well, 52% not well).
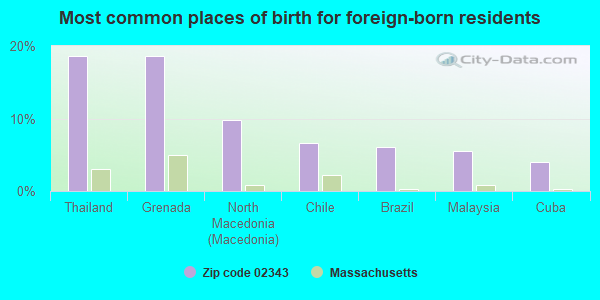
Foreign born population: 1,556 (13.8%) (81.3% of them are naturalized citizens)
This zip code:
13.8%
Whole state:
18.0%
19%Thailand
19%Grenada
10%North Macedonia (Macedonia)
7%Chile
6%Brazil
6%Malaysia
4%Cuba
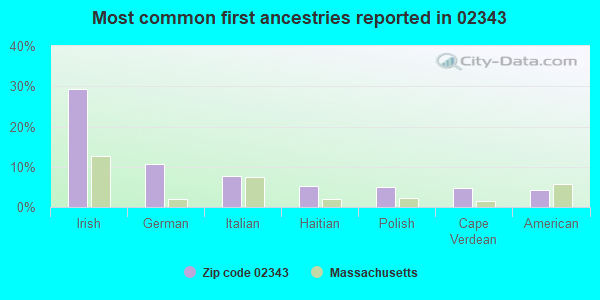
29%Irish
11%German
8%Italian
5%Haitian
5%Polish
5%Cape Verdean
4%American
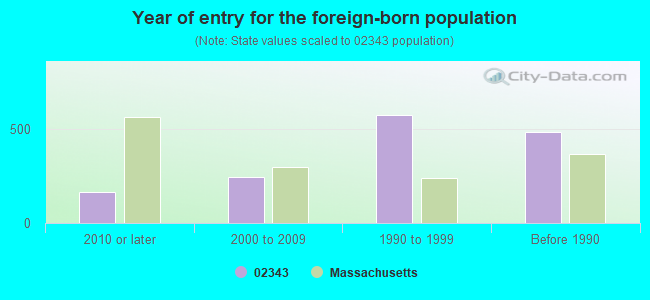
Year of entry for the foreign-born population
1632010 or later
2452000 to 2009
5771990 to 1999
487Before 1990
Major facilities with environmental interests located in this zip code:
AVON CUSTOM MIXING SERVICES INC (55 HIGH ST. in HOLBROOK, MA)
AIR MINOR (AIRS/AFS) ENFORCEMENT/COMPLIANCE ACTIVITY (Integrated Compliance Information System) FORMAL ENFORCEMENT ACTION (Integrated Compliance Information System) CRITERIA AND HAZARDOUS AIR POLLUTANT INVENTORY (Inventory of air pollution sources) National Pollutant Discharge Elimination System NON-MAJOR (Tracking pollutant discharge elimination systems) - permit TRI REPORTER (Tracking of toxic chemicals releasing facilities) - ICIS-01-2004-9133, FORMAL ENFORCEMENT ACTION, ICIS-, ENFORCEMENT/COMPLIANCE ACTIVITY Business SIC classification: PLASTICS MATERIALS, SYNTHETIC RESINS, AND NONVULCANIZABLE ELASTOMERS; INDUSTRIAL ORGANIC CHEMICALS; FABRICATED RUBBER PRODUCTS Organizations: AVON CUSTOM MIXING SERVICE INC (CONTACT/OPERATOR)
BAIRD & MCGUIRE (775 SOUTH ST in HOLBROOK, MA)
SUPERFUND NPL (Superfund database) (Integrated Compliance Information System) - ICIS-01-1983-0010, FORMAL ENFORCEMENT ACTION (Resource Conservation and Recovery Act (tracking hazardous waste)) Business SIC classification: SPECIALTY CLEANING, POLISHING, AND SANITATION PREPARATIONS Business NAICS classification: POLISH AND OTHER SANITATION GOOD MANUFACTURING.
NEW CAN CO INC THE (1 MEAR RD in HOLBROOK, MA)
(Resource Conservation and Recovery Act (tracking hazardous waste)) Organizations: THE NEW CAN CO INC (CONTACT/OWNER)
BARCOLENE COMPANY THE (620 SOUTH ST in HOLBROOK, MA)
AIR MINOR (AIRS/AFS) (Resource Conservation and Recovery Act (tracking hazardous waste)) TRI REPORTER (Tracking of toxic chemicals releasing facilities) Business SIC classification: SOAP AND OTHER DETERGENTS, EXCEPT SPECIALTY CLEANERS; SURFACE ACTIVE AGENTS, FINISHING AGENTS, SULFONATED OILS, AND ASSISTANTS; GENERAL WAREHOUSING AND STORAGE
AVENI CLEANERS (224 PLYMOUTH ST in HOLBROOK, MA)
AIR MINOR (AIRS/AFS) CRITERIA AND HAZARDOUS AIR POLLUTANT INVENTORY (Inventory of air pollution sources) Small Quantity Generators, between 100 kg and 1000 kg of hazardous waste/month (Resource Conservation and Recovery Act (tracking hazardous waste)) - notification Business SIC classification: DRYCLEANING PLANTS, EXCEPT RUG CLEANING
ATLANTIC SWITCHBOARD & ENGINEE (144 CENTER ST in HOLBROOK, MA)
(Resource Conservation and Recovery Act (tracking hazardous waste)) Organizations: CARL DYER & CHARLES REEVES (CONTACT/OWNER)
Alternative names: ATLANTIC SWITCHBOARD & ENGINEERING
MORAN LEATHER CO (8 MEAR RD in HOLBROOK, MA)
(Resource Conservation and Recovery Act (tracking hazardous waste))
ALLIED CORK INC (624 SOUTH ST in HOLBROOK, MA)
(Resource Conservation and Recovery Act (tracking hazardous waste))
BROOKS PHARMACY 543 (479 NORTH FRANKLIN ST in HOLBROOK, MA)
Small Quantity Generators, between 100 kg and 1000 kg of hazardous waste/month (Resource Conservation and Recovery Act (tracking hazardous waste)) - notification Organizations: NEW HIGHLAND PLAZA TRUST (CONTACT/OWNER)
, PJC REALTY CO INC (CONTACT/OWNER)
COLONIAL PRINTERS (63 PLYMOUTH ST in HOLBROOK, MA)
(Resource Conservation and Recovery Act (tracking hazardous waste)) Organizations: GAIDES JOSEPH (CONTACT/OWNER)
NORTHEAST.REFRIGERATION SERVICE (275 CENTRE ST UNIT 19 in HOLBROOK, MA) . Federal Facility
AIR MINOR (AIRS/AFS) ENFORCEMENT/COMPLIANCE ACTIVITY (Integrated Compliance Information System) Business SIC classification: NONCLASSIFIABLE ESTABLISHMENTS Alternative names: N E REFRIGERATION SERVICE
ADOLPH BAUER INC (763 SOUTH ST in HOLBROOK, MA)
Small Quantity Generators, between 100 kg and 1000 kg of hazardous waste/month (Resource Conservation and Recovery Act (tracking hazardous waste)) - notification
AEROSOL RESEARCH LABORATORIES (606 SOUTH STREET in HOLBROOK, MA)
(Resource Conservation and Recovery Act (tracking hazardous waste))
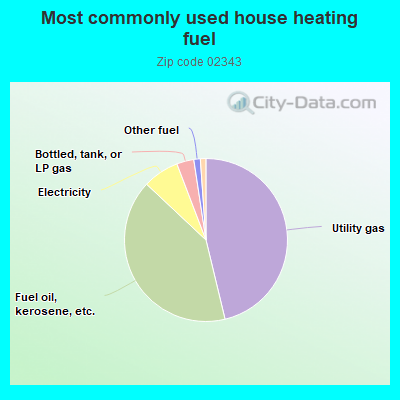
46.3%Utility gas
40.8%Fuel oil, kerosene, etc.
7.2%Electricity
3.4%Bottled, tank, or LP gas
1.3%Other fuel
1.1%Solar energy
Population in 1990: 11,041.
Place of birth for U.S.-born residents:
This state: 8,583
Northeast: 490
Midwest: 121
South: 369
West: 108
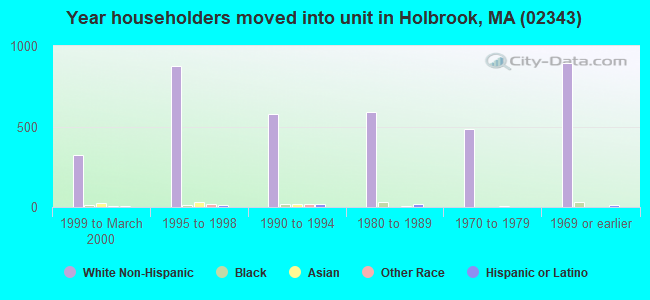
67% of the 02343 zip code residents lived in the same house 5 years ago. Out of people who lived in different houses, 59% lived in this county. Out of people who lived in different counties, 50% lived in Massachusetts.
97% of the 02343 zip code residents lived in the same house 1 year ago. Out of people who lived in different houses, 61% moved from this county. Out of people who lived in different houses, 25% moved from different county within same state. Out of people who lived in different houses, 18% moved from different state.
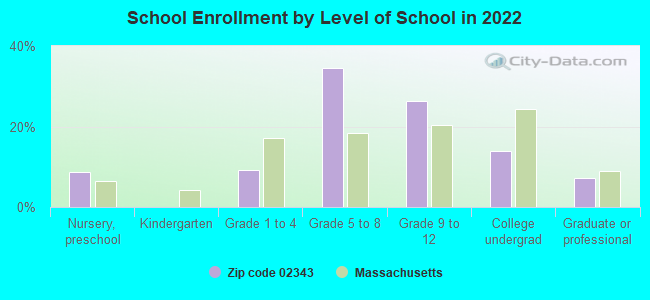
Private vs. public school enrollment:
Students in private schools in grades 1 to 8 (elementary and middle school): 119
Here:
11.8%
Massachusetts:
10.3%
Students in private schools in grades 9 to 12 (high school): 110
Here:
18.1%
Massachusetts:
12.3%
Students in private undergraduate colleges: 39
Here:
12.3%
Massachusetts:
51.2%
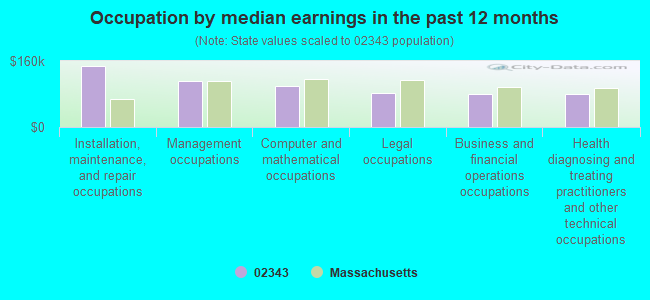
Occupation by median earnings in the past 12 months ($)
148,107Installation, maintenance, and repair occupations
111,442Management occupations
99,538Computer and mathematical occupations
83,520Legal occupations
80,574Business and financial operations occupations
79,078Health diagnosing and treating practitioners and other technical occupations
Companies with federal contracts located in this zip code (HOLBROOK, MA):
PISTRIS, INC. (63 CEDAR HILL RD.; small business) : $544,000 in 2 contractsfrom 1999 to 2000
$499,000 with Navy for Training/Curriculum Development. Taking place in MS. Signed on 2000-01-24. Completion date: 2000-07-12.
$45,000 with Department of Defense for Lectures For Training. Signed on 1999-11-04. Completion date: 1999-11-19.
R L DESIGN CORP (275 CENTRE STREET STE 2; small business) : $163,619 in 4 contractsfrom 2000 to 2004
$51,000 with Defense Logistics Agency for Antennas, Waveguides, and Related Equipment. Signed on 2001-07-18. Completion date: 2002-07-18.
$48,750 with Navy for Radar Equipment, Airborne. Signed on 2003-05-16. Completion date: 2003-11-28.
$36,527 with Navy for Marine Hardware and Hull Items. Signed on 2000-04-07. Completion date: 2001-04-01.
$27,342 with Navy for Generators and Generators Sets, Electrical. Signed on 2004-03-26. Completion date: 2004-06-28.
FORUM ENVIRONMENTAL, INC (270 CENTRE STREET; small business) : $83,867 in 3 contractsin 2001
$53,868 with Air Force for Toxic Substances Support Services. Signed on 2001-12-12. Completion date: 2002-09-30.
$29,999 with Air Force for Hazardous Substance Removal, Cleanup, and Disposal Services and Operational Support. Signed on 2001-03-29. Completion date: 2001-05-18.
$0 with Air Force for Toxic Substances Support Services. Signed on 2001-12-12. Completion date: 2002-09-30.
BRITE VISUAL PRODUCTS, INC (270 CENTRE STREET; small business) : $52,031 in 11 contractsfrom 2003 to 2006
Contracts for Office Devices and Accessories, Office Furniture, Office Supplies, Signs, Advertising Displays, and Identification Plates by Army, Bureau of Reclamation, Navy, Department of Veterans Affairs, and others Signed by year:2000: $0; 2001: $0; 2002: $0; 2003: $9,213; 2004: $0; 2005: $42,073; 2006: $745.
Biggest contracts:
$15,763 with Army for Office Devices and Accessories. Signed on 2005-09-21. Completion date: 2005-10-21.
$9,213 with Army for Office Furniture. Taking place in AZ. Signed on 2003-09-18. Completion date: 2003-09-30.
$8,140 with Bureau of Reclamation for Office Supplies. Taking place in CA. Signed on 2005-08-26. Completion date: 2005-09-20.
$7,680 with Army for Office Furniture. Taking place in NY. Signed on 2005-09-27. Completion date: 2005-12-14.
INTERFACE ENGINEERING INC (275 CENTRE ST STE 2; small business)
$30,000 with Navy for Miscellaneous Electrical and Electronic Components. Signed on 2001-12-21. Completion date: 2002-02-21.
Top industries in this zip code by the number of employees in 2005:
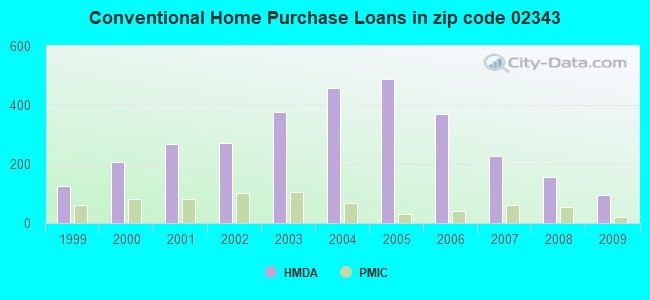
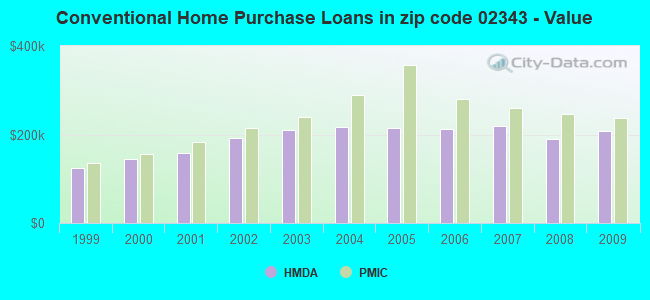
Detailed PMIC statistics for the following Tracts:4211.00
, 4212.00
2002 - 2018 National Fire Incident Reporting System (NFIRS) incidents
According to the data from the years 2002 - 2018 the average number of fires per year is 53. The highest number of reported fire incidents - 95 took place in 2007, and the least - 29 in 2014. The data has a declining trend.
When looking into fire subcategories, the most reports belonged to: Structure Fires (51.4%), and Outside Fires (31.8%).
Fire incident types reported to NFIRS in Zip Code 02343


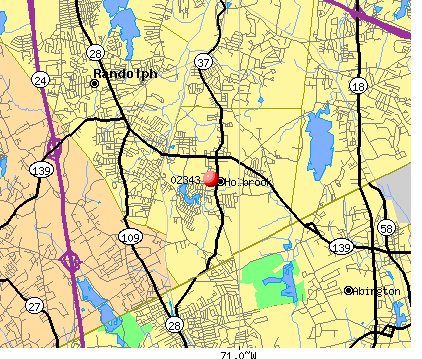 Nearest zip codes: 02351, 02302, 02190, 02322, 02368, 02184.
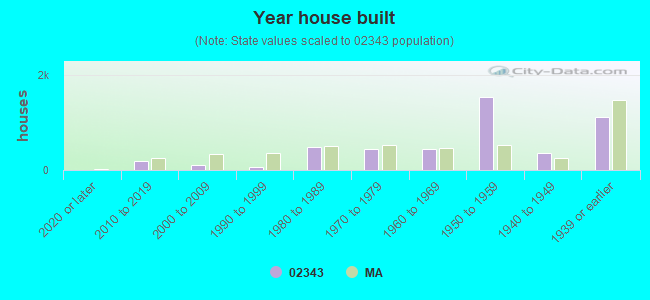


 According to the data from the years 2002 - 2018 the average number of fires per year is 53. The highest number of reported fire incidents - 95 took place in 2007, and the least - 29 in 2014. The data has a declining trend.
 When looking into fire subcategories, the most reports belonged to: Structure Fires (51.4%), and Outside Fires (31.8%).