Estimated zip code population in 2022: 16,997 Zip code population in 2010: 16,029 Zip code population in 2000: 14,605
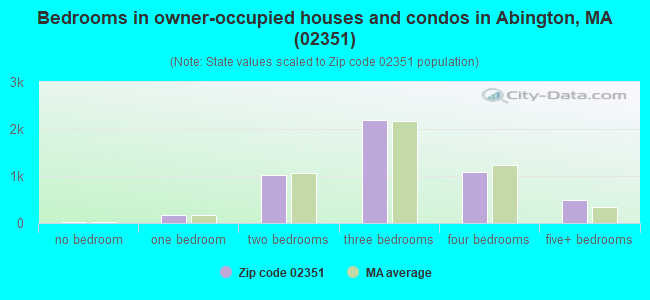
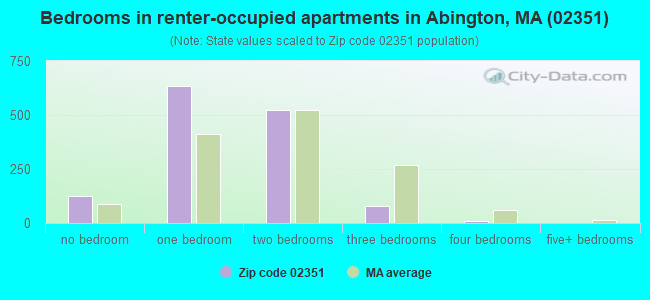
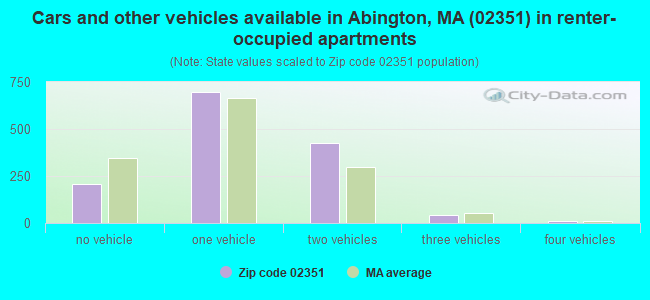
Houses and condos: 6,524 Renter-occupied apartments: 1,374
% of renters here:
22%
State:
38%
March 2022 cost of living index in zip code 02351: 131.7 (high, U.S. average is 100)
Land area: 9.7 sq. mi. Water area: 0.2 sq. mi.
Population density: 1,760 people per square mile
(low).
OSM Map
Google Map
MSN Map
OSM Map
General Map
Google Map
MSN Map
OSM Map
Google Map
MSN Map
OSM Map
Google Map
MSN Map
Please wait while loading the map...
Real estate property taxes paid for housing units in 2022:
This zip code:
1.3% ($6,747)
Massachusetts:
1.0% ($5,536)
Median real estate property taxes paid for housing units with mortgages in 2022: $6,816 (1.3%) Median real estate property taxes paid for housing units with no mortgage in 2022: $6,492 (1.3%)
Business Search- 14 Million verified businesses
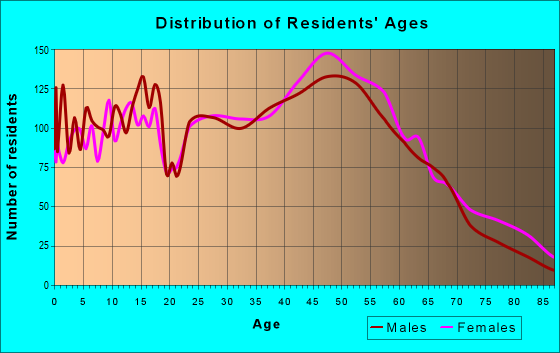
Males: 8,650
(50.9%)
Females: 8,347
(49.1%)
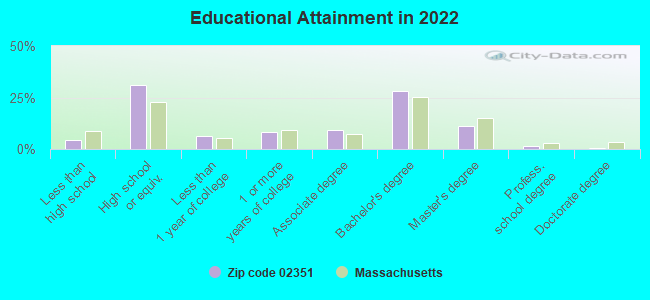
For population 25 years and over in 02351:
High school or higher: 95.5%
Bachelor's degree or higher: 41.3%
Graduate or professional degree: 13.1%
Unemployed: 3.7%
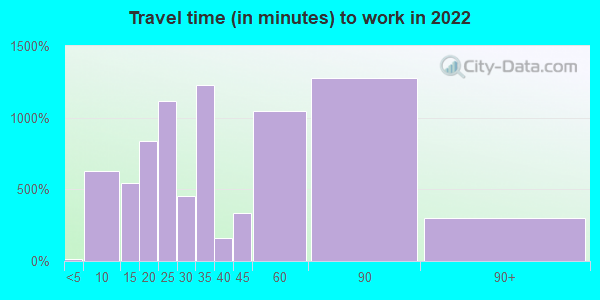
Mean travel time to work (commute): 33.0 minutes
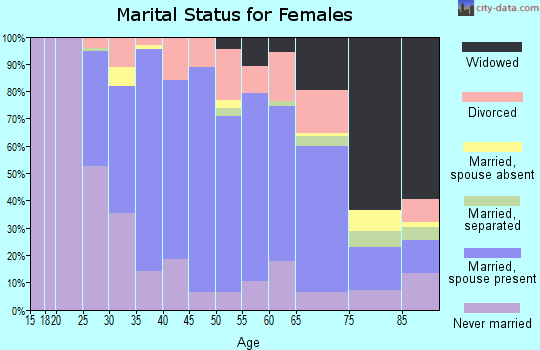
For population 15 years and over in 02351:
Never married: 33.5%
Now married: 50.4%
Separated: 0.7%
Widowed: 5.5%
Divorced: 9.9%
Zip code 02351 compared to state average:
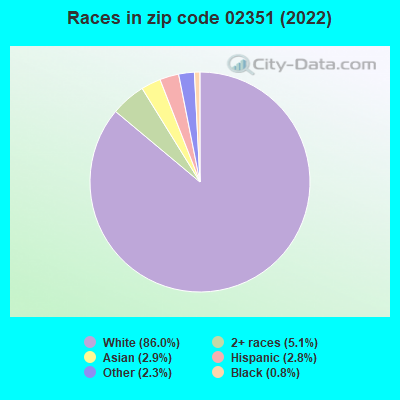
Black race population percentage significantly below state average.
Hispanic race population percentage significantly below state average.
Foreign-born population percentage below state average.
Renting percentage below state average.
Length of stay since moving in below state average.
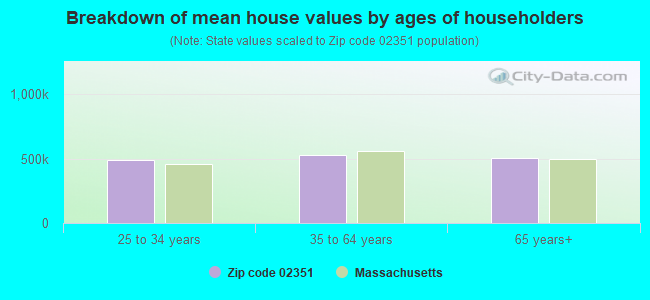
Estimated median house/condo value in 2022: $526,634
02351:
$526,634
Massachusetts:
$534,700
According to our research of Massachusetts and other state lists, there were 5 registered sex offenders living in 02351 zip code as of April 27, 2024. The ratio of all residents to sex offenders in zip code 02351 is 3,286 to 1. The ratio of registered sex offenders to all residents in this zip code is lower than the state average.
Median resident age:
This zip code:
41.1 years
Massachusetts median age:
40.3 years
Average household size:
This zip code:
2.6 people
Massachusetts:
2.4 people
Averages for the 2020 tax year for zip code 02351, filed in 2021:
Average Adjusted Gross Income (AGI) in 2020: $78,127 (Individual Income Tax Returns)
Here:
$78,127
State:
$105,130
Salary/wage: $71,768 (reported on 83.3% of returns)
Here:
$71,768
State:
$82,951
(% of AGI for various income ranges: 1102.2% for AGIs below $25k, 3734.4% for AGIs $25k-50k, 6406.7% for AGIs $50k-75k, 9681.5% for AGIs $75k-100k, 18582.6% for AGIs $100k-200k, 64768.5% for AGIs over 200k)
Taxable interest for individuals: $734 (reported on 34.3% of returns)
This zip code:
$734
Massachusetts:
$2,361
(% of AGI for various income ranges: 19.9% for AGIs below $25k, 19.8% for AGIs $25k-50k, 33.2% for AGIs $50k-75k, 35.9% for AGIs $75k-100k, 54.0% for AGIs $100k-200k, 265.0% for AGIs over 200k)
Ordinary dividends: $2,884 (reported on 18.1% of returns)
Here:
$2,884
State:
$10,365
(% of AGI for various income ranges: 28.8% for AGIs below $25k, 42.4% for AGIs $25k-50k, 48.1% for AGIs $50k-75k, 44.6% for AGIs $75k-100k, 121.3% for AGIs $100k-200k, 797.0% for AGIs over 200k)
Net capital gain/loss in AGI: +$7,963 (reported on 15.6% of returns)
Here:
+$7,963
State:
+$48,178
(% of AGI for various income ranges: 2.3% for AGIs below $25k, 25.7% for AGIs $25k-50k, 70.1% for AGIs $50k-75k, 87.8% for AGIs $75k-100k, 290.6% for AGIs $100k-200k, 3158.0% for AGIs over 200k)
Profit/loss from business: +$15,012 (reported on 13.1% of returns)
Here:
+$15,012
State:
+$20,792
(% of AGI for various income ranges: 132.0% for AGIs below $25k, 183.8% for AGIs $25k-50k, 187.9% for AGIs $50k-75k, 191.2% for AGIs $75k-100k, 487.4% for AGIs $100k-200k, 2389.0% for AGIs over 200k)
Taxable individual retirement arrangement distribution: $17,627 (reported on 9.0% of returns)
02351:
$17,627
Massachusetts:
$22,790
(% of AGI for various income ranges: 73.3% for AGIs below $25k, 111.0% for AGIs $25k-50k, 184.5% for AGIs $50k-75k, 281.9% for AGIs $75k-100k, 538.9% for AGIs $100k-200k, 903.0% for AGIs over 200k)
Self-employed (Keogh) retirement plans: $24,500 (reported on 0.4% of returns)
02351:
$24,500
Massachusetts:
$26,868
(% of AGI for various income ranges: 490.0% for AGIs over 200k)
Total itemized deductions: $25,337 (reported on 13.7% of returns)
Here:
$25,337
State:
$36,722
(% of AGI for various income ranges: 103.9% for AGIs below $25k, 155.0% for AGIs $25k-50k, 457.1% for AGIs $50k-75k, 773.1% for AGIs $75k-100k, 973.0% for AGIs $100k-200k, 3247.0% for AGIs over 200k)
Charity contributions: $3,584 (reported on 10.1% of returns)
Here:
$3,584
State:
$12,529
(% of AGI for various income ranges: 4.1% for AGIs below $25k, 6.6% for AGIs $25k-50k, 33.6% for AGIs $50k-75k, 56.4% for AGIs $75k-100k, 115.0% for AGIs $100k-200k, 538.0% for AGIs over 200k)
Taxes paid: $8,702 (reported on 13.7% of returns)
02351:
$8,702
State:
$8,782
(% of AGI for various income ranges: 22.8% for AGIs below $25k, 50.4% for AGIs $25k-50k, 157.3% for AGIs $50k-75k, 301.4% for AGIs $75k-100k, 358.6% for AGIs $100k-200k, 947.5% for AGIs over 200k)
Earned income credit: $1,568 (reported on 7.0% of returns)
Here:
$1,568
State:
$1,909
(% of AGI for various income ranges: 40.7% for AGIs below $25k, 34.0% for AGIs $25k-50k)
Percentage of individuals using paid preparers for their 2020 taxes: 91.6%
Here:
92%
State:
92%
(% for various income ranges: 87.7% for AGIs below $25k, 91.4% for AGIs $25k-50k, 93.4% for AGIs $50k-75k, 92.6% for AGIs $75k-100k, 93.3% for AGIs $100k-200k, 96.4% for AGIs over 200k)
Averages for the 2012 tax year for zip code 02351, filed in 2013:
Average Adjusted Gross Income (AGI) in 2012: $62,811 (Individual Income Tax Returns)
Here:
$62,811
State:
$81,425
Salary/wage: $57,806 (reported on 86.7% of returns)
Here:
$57,806
State:
$64,752
(% of AGI for various income ranges: 73.3% for AGIs below $25k, 79.8% for AGIs $25k-50k, 78.8% for AGIs $50k-75k, 80.0% for AGIs $75k-100k, 85.7% for AGIs $100k-200k, 67.4% for AGIs over 200k)
Taxable interest for individuals: $602 (reported on 39.5% of returns)
This zip code:
$602
Massachusetts:
$2,136
(% of AGI for various income ranges: 1.0% for AGIs below $25k, 0.4% for AGIs $25k-50k, 0.4% for AGIs $50k-75k, 0.3% for AGIs $75k-100k, 0.3% for AGIs $100k-200k, 0.6% for AGIs over 200k)
Ordinary dividends: $2,713 (reported on 18.6% of returns)
Here:
$2,713
State:
$9,473
(% of AGI for various income ranges: 1.2% for AGIs below $25k, 0.6% for AGIs $25k-50k, 0.7% for AGIs $50k-75k, 0.6% for AGIs $75k-100k, 0.5% for AGIs $100k-200k, 1.9% for AGIs over 200k)
Net capital gain/loss in AGI: +$2,275 (reported on 13.0% of returns)
Here:
+$2,275
State:
+$31,437
(% of AGI for various income ranges: 0.5% for AGIs $75k-100k, 0.4% for AGIs $100k-200k, 1.9% for AGIs over 200k)
Profit/loss from business: +$15,071 (reported on 12.1% of returns)
Here:
+$15,071
State:
+$20,662
(% of AGI for various income ranges: 8.3% for AGIs below $25k, 2.8% for AGIs $25k-50k, 2.3% for AGIs $50k-75k, 2.4% for AGIs $75k-100k, 2.0% for AGIs $100k-200k, 4.6% for AGIs over 200k)
Taxable individual retirement arrangement distribution: $16,600 (reported on 9.5% of returns)
02351:
$16,600
Massachusetts:
$18,892
(% of AGI for various income ranges: 3.4% for AGIs below $25k, 2.4% for AGIs $25k-50k, 2.6% for AGIs $50k-75k, 2.4% for AGIs $75k-100k, 2.2% for AGIs $100k-200k, 3.3% for AGIs over 200k)
Self-employment retirement plans: $13,325 (reported on 0.5% of returns)
02351:
$13,325
Massachusetts:
$20,669
Total itemized deductions: $21,698 (21% of AGI, reported on 42.3% of returns)
Here:
$21,698
State:
$28,907
Here:
20.8% of AGI
State:
18.2% of AGI
(% of AGI for various income ranges: 10.5% for AGIs below $25k, 10.8% for AGIs $25k-50k, 15.2% for AGIs $50k-75k, 16.1% for AGIs $75k-100k, 16.4% for AGIs $100k-200k, 12.7% for AGIs over 200k)
Charity contributions: $1,870 (reported on 35.2% of returns)
Here:
$1,870
State:
$4,208
(% of AGI for various income ranges: 0.5% for AGIs below $25k, 0.7% for AGIs $25k-50k, 0.9% for AGIs $50k-75k, 1.0% for AGIs $75k-100k, 1.1% for AGIs $100k-200k, 1.5% for AGIs over 200k)
Taxes paid: $9,695 (reported on 42.1% of returns)
02351:
$9,695
State:
$13,303
(% of AGI for various income ranges: 3.2% for AGIs below $25k, 3.8% for AGIs $25k-50k, 5.9% for AGIs $50k-75k, 6.8% for AGIs $75k-100k, 7.8% for AGIs $100k-200k, 7.3% for AGIs over 200k)
Earned income credit: $1,705 (reported on 8.8% of returns)
Here:
$1,705
State:
$1,971
(% of AGI for various income ranges: 3.0% for AGIs below $25k, 0.5% for AGIs $25k-50k)
Percentage of individuals using paid preparers for their 2012 taxes: 56.2%
Here:
56%
State:
56%
(% for various income ranges: 49.8% for AGIs below $25k, 53.0% for AGIs $25k-50k, 59.5% for AGIs $50k-75k, 61.5% for AGIs $75k-100k, 63.4% for AGIs $100k-200k, 69.6% for AGIs over 200k)
Averages for the 2004 tax year for zip code 02351, filed in 2005:
Average Adjusted Gross Income (AGI) in 2004: $54,467 (Individual Income Tax Returns)
Here:
$54,467
State:
$62,877
Salary/wage: $50,097 (reported on 87.8% of returns)
Here:
$50,097
State:
$52,969
(% of AGI for various income ranges: 101.2% for AGIs below $10k, 70.4% for AGIs $10k-25k, 83.7% for AGIs $25k-50k, 84.0% for AGIs $50k-75k, 87.0% for AGIs $75k-100k, 75.7% for AGIs over 100k)
Taxable interest for individuals: $921 (reported on 56.2% of returns)
This zip code:
$921
Massachusetts:
$1,945
(% of AGI for various income ranges: 3.3% for AGIs below $10k, 1.7% for AGIs $10k-25k, 0.9% for AGIs $25k-50k, 0.8% for AGIs $50k-75k, 0.6% for AGIs $75k-100k, 1.0% for AGIs over 100k)
Taxable dividends: $1,636 (reported on 23.7% of returns)
Here:
$1,636
State:
$5,323
(% of AGI for various income ranges: 2.5% for AGIs below $10k, 0.9% for AGIs $10k-25k, 0.5% for AGIs $25k-50k, 0.5% for AGIs $50k-75k, 0.4% for AGIs $75k-100k, 1.0% for AGIs over 100k)
Net capital gain/loss: +$11,341 (reported on 18.3% of returns)
Here:
+$11,341
State:
+$20,377
(% of AGI for various income ranges: -1.7% for AGIs below $10k, 0.6% for AGIs $10k-25k, 0.2% for AGIs $25k-50k, 0.6% for AGIs $50k-75k, 1.0% for AGIs $75k-100k, 8.8% for AGIs over 100k)
Profit/loss from business: +$14,527 (reported on 12.8% of returns)
Here:
+$14,527
State:
+$17,837
(% of AGI for various income ranges: 4.5% for AGIs below $10k, 7.2% for AGIs $10k-25k, 3.2% for AGIs $25k-50k, 2.5% for AGIs $50k-75k, 3.1% for AGIs $75k-100k, 3.5% for AGIs over 100k)
IRA payment deduction: $3,013 (reported on 3.0% of returns)
02351:
$3,013
Massachusetts:
$3,100
(% of AGI for various income ranges: 0.4% for AGIs $10k-25k, 0.3% for AGIs $25k-50k, 0.2% for AGIs $50k-75k, 0.2% for AGIs $75k-100k, 0.1% for AGIs over 100k)
Self-employed pension: $14,082 (reported on 0.6% of returns)
Here:
$14,082
Massachusetts:
$14,516
Total itemized deductions: $19,510 (22% of AGI, reported on 45.8% of returns)
Here:
$19,510
State:
$22,573
Here:
22.4% of AGI
State:
19.5% of AGI
(% of AGI for various income ranges: 13.1% for AGIs below $10k, 13.2% for AGIs $10k-25k, 12.9% for AGIs $25k-50k, 18.5% for AGIs $50k-75k, 19.7% for AGIs $75k-100k, 15.8% for AGIs over 100k)
Charity contributions deductions: $1,898 (2% of AGI, reported on 42.5% of returns)
Here:
$1,898
State:
$3,295
Here:
2.1% of AGI
State:
2.7% of AGI
(% of AGI for various income ranges: 0.7% for AGIs below $10k, 0.9% for AGIs $10k-25k, 1.0% for AGIs $25k-50k, 1.5% for AGIs $50k-75k, 1.7% for AGIs $75k-100k, 1.6% for AGIs over 100k)
Total tax: $7,465 (reported on 84.3% of returns)
02351:
$7,465
State:
$11,494
(% of AGI for various income ranges: 2.9% for AGIs below $10k, 5.4% for AGIs $10k-25k, 8.3% for AGIs $25k-50k, 9.2% for AGIs $50k-75k, 9.7% for AGIs $75k-100k, 16.1% for AGIs over 100k)
Earned income credit: $1,357 (reported on 6.4% of returns)
Here:
$1,357
State:
$1,518
Percentage of individuals using paid preparers for their 2004 taxes: 56.7%
Here:
57%
State:
58%
(% for various income ranges: 42.0% for AGIs below $10k, 52.4% for AGIs $10k-25k, 54.1% for AGIs $25k-50k, 65.0% for AGIs $50k-75k, 66.2% for AGIs $75k-100k, 66.1% for AGIs over 100k)
Likely homosexual households (counted as self-reported same-sex unmarried-partner households)
Lesbian couples: 0.2% of all households
Gay men: 0.0% of all households
Household received Food Stamps/SNAP in the past 12 months: 682 Household did not receive Food Stamps/SNAP in the past 12 months: 5,627
Women who had a birth in the past 12 months: 294 (299 now married, 7 unmarried) Women who did not have a birth in the past 12 months: 3,926 (1,612 now married, 2,302 unmarried)
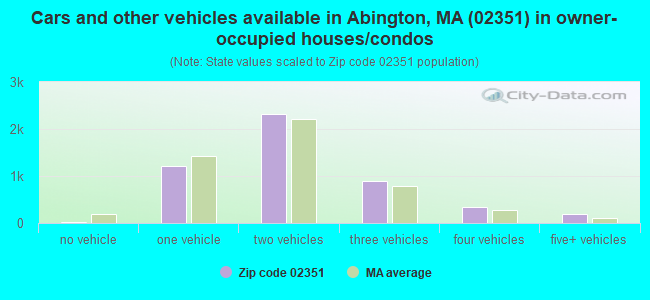
Housing units in zip code 02351 with a mortgage: 3,887 (678 second mortgage, 605 both second mortgage and home equity loan) Houses without a mortgage: 173
Median monthly owner costs for units with a mortgage: $2,665 Median monthly owner costs for units without a mortgage: $1,079
Residents with income below the poverty level in 2022:
This zip code:
5.5%
Whole state:
10.4%
Residents with income below 50% of the poverty level in 2022:
This zip code:
4.1%
Whole state:
5.1%
Median number of rooms in houses and condos:
Here:
6.7
State:
6.5
Median number of rooms in apartments:
Here:
3.2
State:
4.0
Notable locations in this zip code not listed on our city pages
Notable locations in zip code 02351: Abington Station (A), North Abington Depot (B), Strawberry Valley Golf Course (C), Abington Fire Department Station 2 (D), Burton L Wales Public Library (E), Abington Fire Department Station 1 Headquarters (F), North Abington Town Hall (G). Display/hide their locations on the map
Churches in zip code 02351 include: United Church of Christ (A), Saint Marks Lutheran Church (B), Rock Church of Rockland (C), Saint Nicholas Church (D). Display/hide their locations on the map
Cemeteries: Bicknell Family Tomb (1), Cushing Family Tomb Site (2), Gould Family Burying Ground Site (3), Hunt Family Tomb Site (4), Island Grove Cemetery (5), Nash Family Tomb (6), Old Church Burying Ground (7). Display/hide their locations on the map
In group quarters: 172 (-1 institutionalized population)
Size of family households: 1,488 2-persons, 972 3-persons, 880 4-persons, 478 5-persons, 175 6-persons, 107 7-or-more-persons
Size of nonfamily households: 1,702 1-person, 407 2-persons, 127 3-persons
2,731 married couples with children.
814 single-parent households (227 men, 587 women).
87.5% of residents of 02351 zip code speak English at home.
2.0% of residents speak Spanish at home (70% very well, 5% well, 23% not well, 2% not at all).
8.1% of residents speak other Indo-European language at home (65% very well, 19% well, 3% not well, 12% not at all).
0.9% of residents speak Asian or Pacific Island language at home (73% very well, 18% well, 9% not well).
0.8% of residents speak other language at home (41% very well, 59% well).
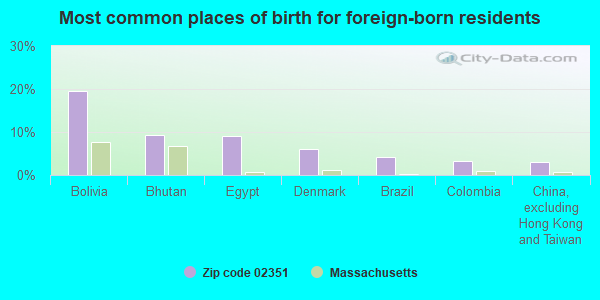
Foreign born population: 1,712 (10.1%) (71.9% of them are naturalized citizens)
This zip code:
10.1%
Whole state:
18.0%
19%Bolivia
9%Bhutan
9%Egypt
6%Denmark
4%Brazil
3%Colombia
3%China, excluding Hong Kong and Taiwan
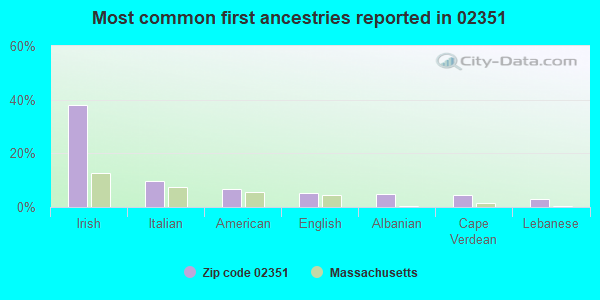
38%Irish
10%Italian
7%American
5%English
5%Albanian
4%Cape Verdean
3%Lebanese
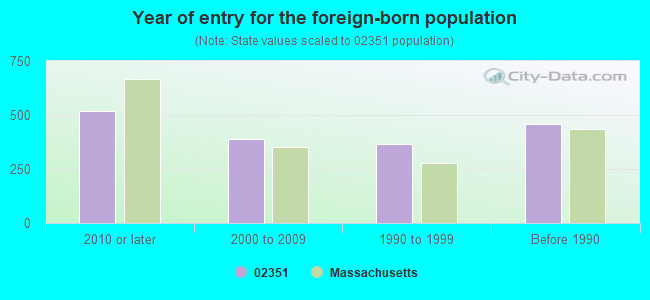
Year of entry for the foreign-born population
5192010 or later
3882000 to 2009
3651990 to 1999
458Before 1990
Major facilities with environmental interests located in this zip code:
CAR CRAFT (310 BEDFORD ST in ABINGTON, MA)
STATE MASTER (MA-EPICS) - RCRAINFO-P22756, HAZARDOUS WASTE PROGRAM STATE MASTER (MA-EPICS) - RCRAINFO-MAD101153823, HAZARDOUS WASTE PROGRAM STATE MASTER (MA-EPICS) - RCRAINFO-MV7818789736, HAZARDOUS WASTE PROGRAM Conditionally Exempt Small Quantity Generators, less than 100 kg/month of hazardous waste (Resource Conservation and Recovery Act (tracking hazardous waste)) - notification Organizations: AUTOWORKS INC (CONTACT/OPERATOR)
, RUGGERI RICHARD (CONTACT/OWNER)
, ABINGTON AUTO SERVICE (CONTACT/OWNER)
, AUTOWORKS INC (CONTACT/REGULATORY)
Alternative names: ABINGTON AUTO SERVICE, AUTOWORKS INC, B&F RICHARDS INC, RUGGERI RICHARD
ABINGTON HIGH SCHOOL (201 LINCOLN BLVD in ABINGTON, MA)
AIR MINOR (AIRS/AFS) STATE MASTER (MA-EPICS) - NEI-1192117, AIR PROGRAM COMPLIANCE ACTIVITY (Tracking inspections of insecticide, fungicide, and rodenticide, and toxic substances) CRITERIA AND HAZARDOUS AIR POLLUTANT INVENTORY (Inventory of air pollution sources) Business SIC classification: ELEMENTARY AND SECONDARY SCHOOLS Alternative names: ABINGTON HS, ABINGTON SCH. DEPT.
ABINGTON ECC (1 RALPH HAMLIN LANE in ABINGTON, MA)
(National Center for Education Statistics) - STATE ID-001003
ABINGTON HIGH (201 GLINIEWICZ WAY in ABINGTON, MA)
(National Center for Education Statistics) - STATE ID-001505
ALGER CORP THE (477 WASHINGTON ST in ABINGTON, MA)
AIR MINOR (AIRS/AFS) CRITERIA AND HAZARDOUS AIR POLLUTANT INVENTORY (Inventory of air pollution sources) Conditionally Exempt Small Quantity Generators, less than 100 kg/month of hazardous waste (Resource Conservation and Recovery Act (tracking hazardous waste)) - notification Business SIC classification: BOOT AND SHOE CUT STOCK AND FINDINGS Organizations: HOPKINS JOHN SR (CONTACT/OWNER)
NORTH (171 ADAMS STREET in ABINGTON, MA)
(National Center for Education Statistics) - STATE ID-001010 Organizations: ABINGTON (SCHOOL DISTRICT)
KOL TAR INC (699 ADAMS ST. in ABINGTON, MA)
AIR MINOR (AIRS/AFS) (Resource Conservation and Recovery Act (tracking hazardous waste)) Business SIC classification: ASPHALT PAVING MIXTURES AND BLOCKS Business NAICS classification: ASPHALT PAVING MIXTURE AND BLOCK MANUFACTURING. Organizations: A BARRY CASHMAN (CONTACT/OWNER)
ABINGTON INCORPORATED (200 WALES ST in ABINGTON, MA)
AIR MINOR (AIRS/AFS) CRITERIA AND HAZARDOUS AIR POLLUTANT INVENTORY (Inventory of air pollution sources) (Resource Conservation and Recovery Act (tracking hazardous waste)) Business SIC classification: TEXTILE MACHINERY Business NAICS classification: SPECIAL DIE AND TOOL, DIE SET, JIG, AND FIXTURE MANUFACTURING.
MYERS AVENUE W T P (MYERS AVENUE in ABINGTON, MA)
National Pollutant Discharge Elimination System NON-MAJOR (Tracking pollutant discharge elimination systems) - permit Business SIC classification: WATER SUPPLY Organizations: ABINGTON-ROCKLAND JOINT WATER (CONTACT/OPERATOR)
, ABINGTON/ROCKLAND JOINT WATER (CONTACT/OPERATOR)
Alternative names: ABINGTON/ROCKLAND JOINT WATER
OLSEN MACHINE & TOOL (225 WALES ST in ABINGTON, MA)
AIR MINOR (AIRS/AFS) CRITERIA AND HAZARDOUS AIR POLLUTANT INVENTORY (Inventory of air pollution sources) Conditionally Exempt Small Quantity Generators, less than 100 kg/month of hazardous waste (Resource Conservation and Recovery Act (tracking hazardous waste)) - notification Business SIC classification: MOTORS AND GENERATORS Business NAICS classification: HOUSEHOLD COOKING APPLIANCE MANUFACTURING. Organizations: H S D CORP (CONTACT/OWNER)
JENKINS & SIMMONS (678 ADAMS ST in ABINGTON, MA)
(Integrated Compliance Information System) - ICIS-01-1997-0025, FORMAL ENFORCEMENT ACTION
EDS AUTO REPAIR (810 BROCKTON AVE in ABINGTON, MA)
(Resource Conservation and Recovery Act (tracking hazardous waste)) Organizations: ED AUTO REPAIR (CONTACT/OWNER)
Housing units lacking complete plumbing facilities: 0.4% Housing units lacking complete kitchen facilities: 0.7%
45.1%Utility gas
37.4%Fuel oil, kerosene, etc.
14.5%Electricity
1.4%Bottled, tank, or LP gas
0.7%Solar energy
0.6%Wood
Population in 1990: 13,849. Population change in the 1990s: +756 (+5.5%).
Place of birth for U.S.-born residents:
This state: 13,576
Northeast: 935
Midwest: 196
South: 207
West: 191
70% of the 02351 zip code residents lived in the same house 5 years ago. Out of people who lived in different houses, 56% lived in this county. Out of people who lived in different counties, 50% lived in Massachusetts.
87% of the 02351 zip code residents lived in the same house 1 year ago. Out of people who lived in different houses, 44% moved from this county. Out of people who lived in different houses, 47% moved from different county within same state. Out of people who lived in different houses, 6% moved from different state. Out of people who lived in different houses, 1% moved from abroad.
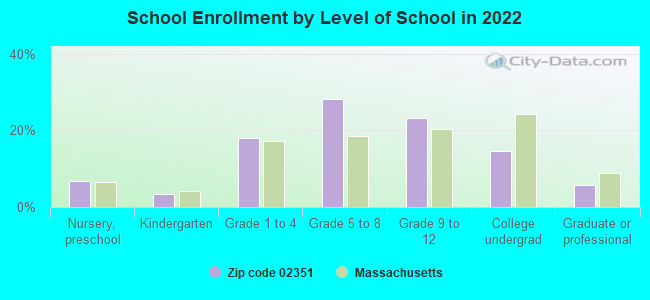
Private vs. public school enrollment:
Students in private schools in grades 1 to 8 (elementary and middle school): 174
Here:
10.2%
Massachusetts:
10.3%
Students in private schools in grades 9 to 12 (high school): 82
Here:
9.7%
Massachusetts:
12.3%
Students in private undergraduate colleges: 342
Here:
63.1%
Massachusetts:
51.2%
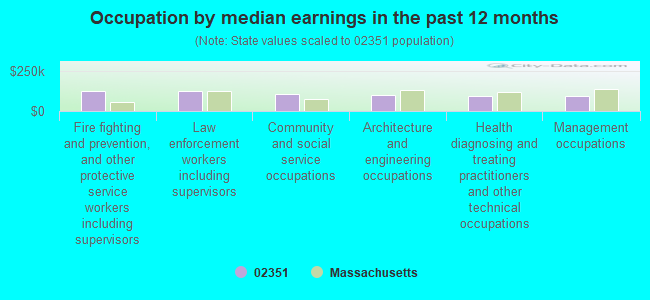
Occupation by median earnings in the past 12 months ($)
125,646Fire fighting and prevention, and other protective service workers including supervisors
120,424Law enforcement workers including supervisors
103,558Community and social service occupations
100,760Architecture and engineering occupations
93,646Health diagnosing and treating practitioners and other technical occupations
92,343Management occupations
Companies with federal contracts located in this zip code:
A J EQUIPMENT REPAIR, INC (306 NORTH AVE in ABINGTON, MA; small business)
$7,360 with Army for Miscellaneous Vehicular Components. Signed on 2003-01-31. Completion date: 2003-02-07.
SNYDER, DALE (132 WALNUT ST in ABINGTON, MA; small business) : $585 in 2 contractsfrom 2002 to 2004
$4,500 with Army for Other Professional Services. Signed on 2002-11-13. Completion date: 2003-11-14.
-$3,915, same as above.Signed on 2004-02-23. Completion date: 2003-11-14.
Top industries in this zip code by the number of employees in 2005:
2002 - 2018 National Fire Incident Reporting System (NFIRS) incidents
According to the data from the years 2002 - 2018 the average number of fires per year is 80. The highest number of reported fire incidents - 111 took place in 2007, and the least - 41 in 2017. The data has a declining trend.
When looking into fire subcategories, the most reports belonged to: Structure Fires (47.5%), and Outside Fires (38.1%).
Fire incident types reported to NFIRS in Zip Code 02351


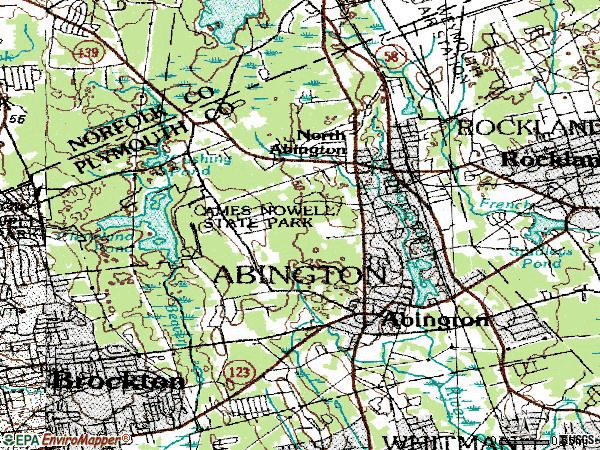
 Nearest zip codes: 02382, 02343, 02190, 02370, 02302, 02333.


 According to the data from the years 2002 - 2018 the average number of fires per year is 80. The highest number of reported fire incidents - 111 took place in 2007, and the least - 41 in 2017. The data has a declining trend.
 When looking into fire subcategories, the most reports belonged to: Structure Fires (47.5%), and Outside Fires (38.1%).