Brockton, Massachusetts
Brockton
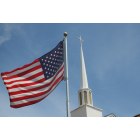
Brockton: American Flag over Immanuel Baptist Church, Brockton, MA Steeple
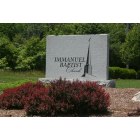
Brockton: Landscaped Sign outside of Immanuel Baptist Church, Brockton, MA
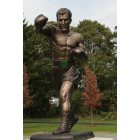
Brockton: Rocky Marciano-Brockton, MA
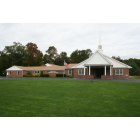
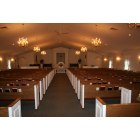
Brockton: Immanuel Baptist Church, Brockton, MA
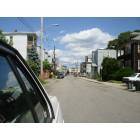
Brockton: The Ghetto West Park St.
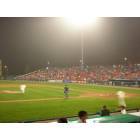
Brockton: Brockton Rox Game
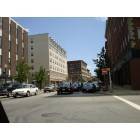
Brockton: Downtown Brockton
- add
your
Submit your own pictures of this city and show them to the world
- OSM Map
- General Map
- Google Map
- MSN Map
Population change since 2000: +11.2%
 |
| Males: 50,585 | |
| Females: 54,241 |
| Median resident age: | 39.5 years |
| Massachusetts median age: | 40.3 years |
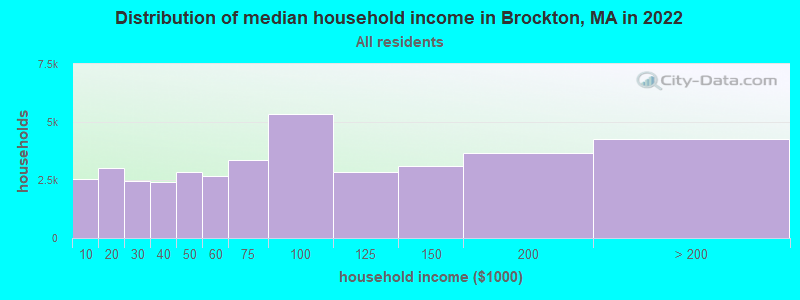
| Brockton: | $74,799 |
| MA: | $94,488 |
Estimated per capita income in 2022: $35,932 (it was $17,163 in 2000)
Brockton city income, earnings, and wages data
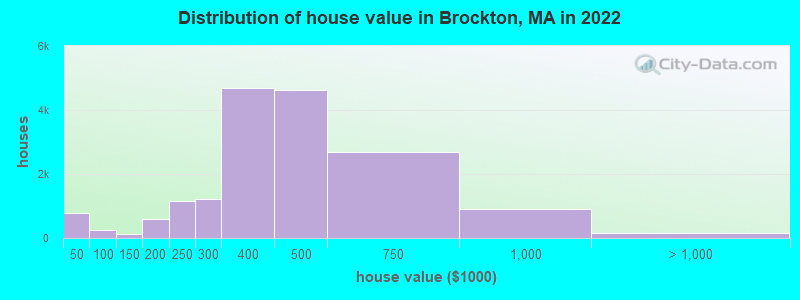
Estimated median house or condo value in 2022: $431,900 (it was $127,900 in 2000)
| Brockton: | $431,900 |
| MA: | $534,700 |
Mean prices in 2022: all housing units: $391,258; detached houses: $406,919; townhouses or other attached units: $291,573; in 2-unit structures: $380,750; in 3-to-4-unit structures: $377,240; in 5-or-more-unit structures: $235,130
Median gross rent in 2022: $1,548.
(10.8% for White Non-Hispanic residents, 14.9% for Black residents, 17.5% for Hispanic or Latino residents, 11.5% for American Indian residents, 70.6% for Native Hawaiian and other Pacific Islander residents, 12.9% for other race residents, 14.0% for two or more races residents)
Detailed information about poverty and poor residents in Brockton, MA


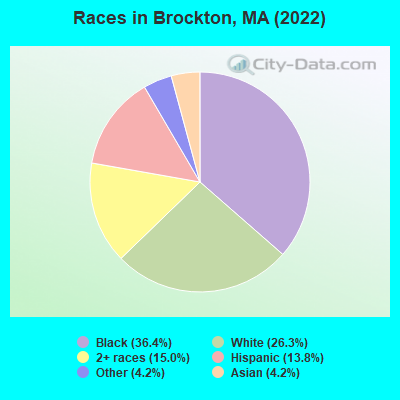
- 38,16336.4%Black alone
- 27,59626.3%White alone
- 15,70415.0%Two or more races
- 14,44213.8%Hispanic
- 4,4134.2%Asian alone
- 4,4244.2%Other race alone
- 590.06%Native Hawaiian and Other
Pacific Islander alone - 320.03%American Indian alone
Races in Brockton detailed stats: ancestries, foreign born residents, place of birth
According to our research of Massachusetts and other state lists, there were 133 registered sex offenders living in Brockton, Massachusetts as of April 27, 2024.
The ratio of all residents to sex offenders in Brockton is 719 to 1.
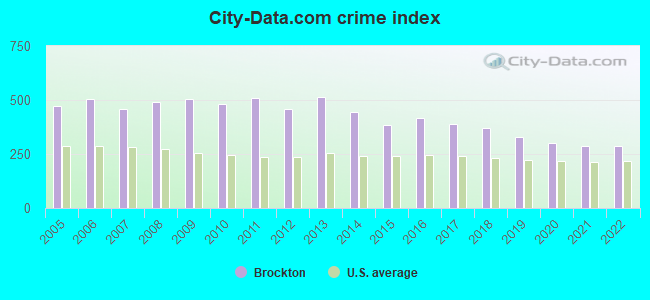
The City-Data.com crime index weighs serious crimes and violent crimes more heavily. Higher means more crime, U.S. average is 246.1. It adjusts for the number of visitors and daily workers commuting into cities.
- means the value is smaller than the state average.- means the value is about the same as the state average.
- means the value is bigger than the state average.
- means the value is much bigger than the state average.
Crime rate in Brockton detailed stats: murders, rapes, robberies, assaults, burglaries, thefts, arson
Full-time law enforcement employees in 2021, including police officers: 220 (192 officers - 172 male; 20 female).
| Officers per 1,000 residents here: | 1.91 |
| Massachusetts average: | 2.53 |
 Recent articles from our blog. Our writers, many of them Ph.D. graduates or candidates, create easy-to-read articles on a wide variety of topics.

 | Brockton PS requesting National guard (125 replies) |
| Brockton the latest nightlife destination??? (37 replies) |
| Fall River can relax for now, as Brockton is named the ugliest city in Massachusetts (29 replies) |
| Brockton police officer kneeling on student (93 replies) |
| Another deadly shooting in Brockton (5 replies) |
| Is Boston the new Brockton (seriously)? (24 replies) |
Latest news from Brockton, MA collected exclusively by city-data.com from local newspapers, TV, and radio stations
Brockton, MA City Guides:
Ancestries: Cape Verdean (25.2%), Haitian (19.6%), Irish (5.9%), Italian (3.2%), American (2.8%), Portuguese (1.6%).
Current Local Time: EST time zone
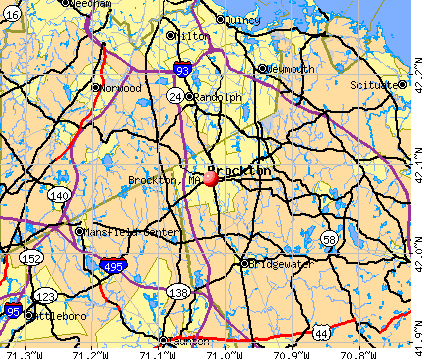
Elevation: 112 feet
Land area: 21.5 square miles.
Population density: 4,883 people per square mile (average).
34,667 residents are foreign born (16.6% Latin America, 13.0% Africa).
| This city: | 32.9% |
| Massachusetts: | 17.6% |
Median real estate property taxes paid for housing units with mortgages in 2022: $4,596 (1.0%)
Median real estate property taxes paid for housing units with no mortgage in 2022: $4,409 (1.2%)
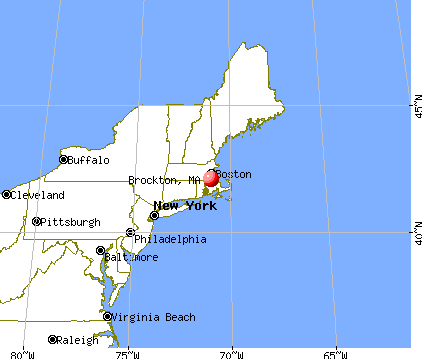
Nearest city with pop. 200,000+: Boston, MA  (16.9 miles , pop. 589,141).
Nearest city with pop. 1,000,000+: Bronx, NY (170.7 miles , pop. 1,332,650).
Nearest cities:
), ), )Latitude: 42.08 N, Longitude: 71.02 W
Daytime population change due to commuting: -13,063 (-12.5%)
Workers who live and work in this city: 16,358 (32.0%)
Area codes: 508, 774
Brockton tourist attractions:
Brockton, Massachusetts accommodation & food services, waste management - Economy and Business Data
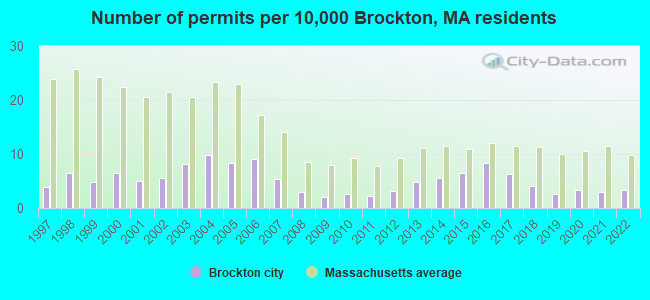
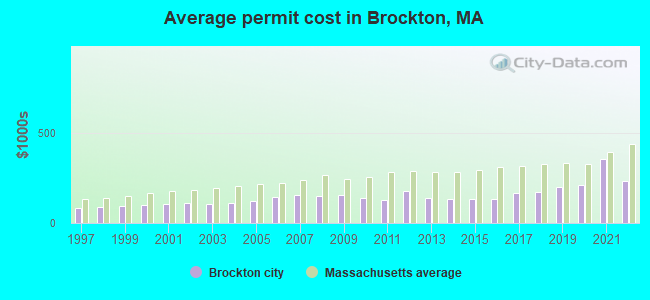
Single-family new house construction building permits:
- 2022: 31 buildings, average cost: $230,700
- 2021: 28 buildings, average cost: $353,500
- 2020: 31 buildings, average cost: $212,400
- 2019: 25 buildings, average cost: $200,600
- 2018: 39 buildings, average cost: $168,900
- 2017: 59 buildings, average cost: $166,600
- 2016: 78 buildings, average cost: $130,100
- 2015: 61 buildings, average cost: $132,800
- 2014: 53 buildings, average cost: $132,000
- 2013: 45 buildings, average cost: $140,600
- 2012: 30 buildings, average cost: $175,800
- 2011: 21 buildings, average cost: $128,500
- 2010: 25 buildings, average cost: $139,400
- 2009: 20 buildings, average cost: $155,700
- 2008: 28 buildings, average cost: $148,600
- 2007: 51 buildings, average cost: $154,600
- 2006: 85 buildings, average cost: $141,900
- 2005: 79 buildings, average cost: $123,500
- 2004: 93 buildings, average cost: $108,100
- 2003: 76 buildings, average cost: $104,900
- 2002: 53 buildings, average cost: $110,000
- 2001: 47 buildings, average cost: $104,000
- 2000: 62 buildings, average cost: $101,600
- 1999: 46 buildings, average cost: $92,900
- 1998: 61 buildings, average cost: $86,000
- 1997: 37 buildings, average cost: $84,300
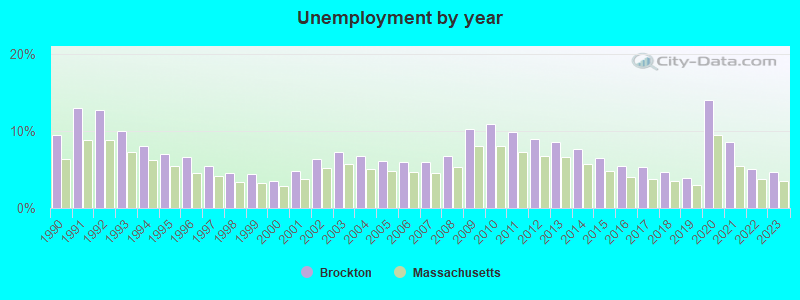
| Here: | 4.7% |
| Massachusetts: | 3.5% |
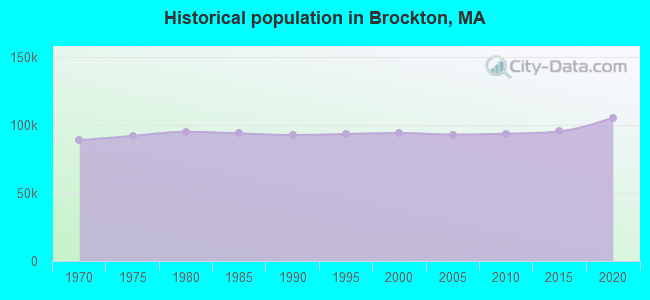
Population change in the 1990s: +1,336 (+1.4%).
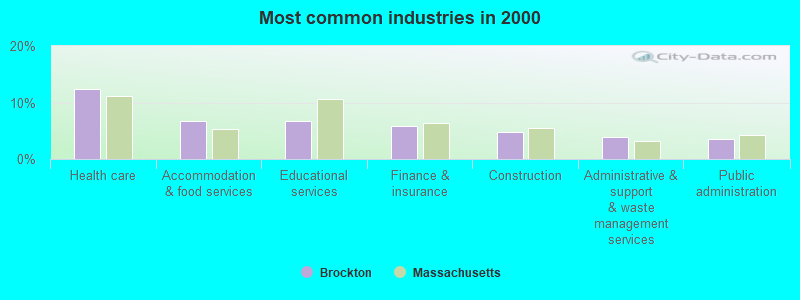
- Health care (12.5%)
- Accommodation & food services (6.7%)
- Educational services (6.6%)
- Finance & insurance (5.8%)
- Construction (4.8%)
- Administrative & support & waste management services (3.9%)
- Public administration (3.6%)
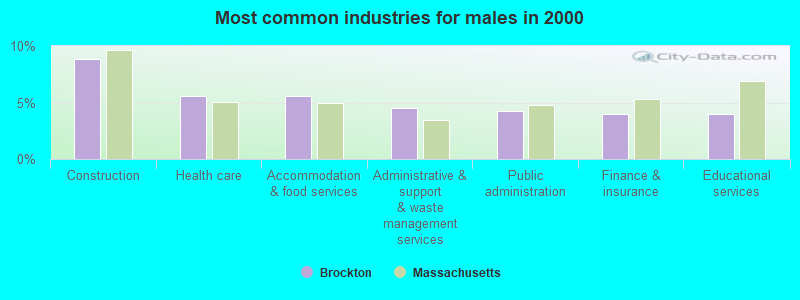
- Construction (8.9%)
- Health care (5.6%)
- Accommodation & food services (5.5%)
- Administrative & support & waste management services (4.5%)
- Public administration (4.3%)
- Finance & insurance (4.0%)
- Educational services (4.0%)
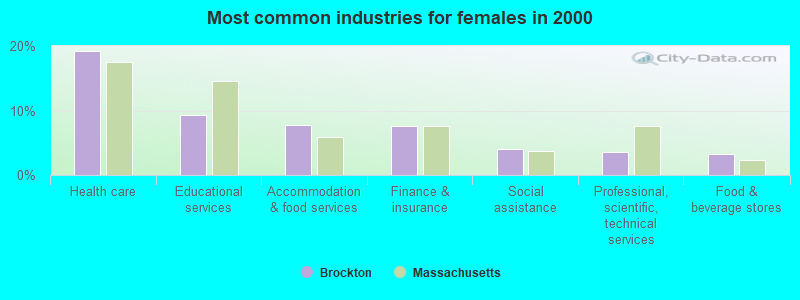
- Health care (19.3%)
- Educational services (9.3%)
- Accommodation & food services (7.8%)
- Finance & insurance (7.6%)
- Social assistance (4.0%)
- Professional, scientific, technical services (3.5%)
- Food & beverage stores (3.3%)
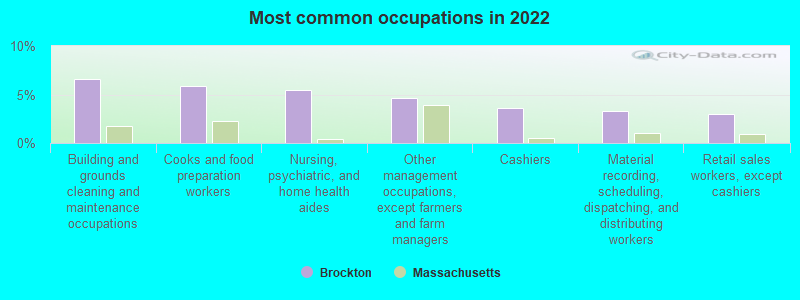
- Building and grounds cleaning and maintenance occupations (6.6%)
- Cooks and food preparation workers (5.9%)
- Nursing, psychiatric, and home health aides (5.5%)
- Other management occupations, except farmers and farm managers (4.6%)
- Cashiers (3.6%)
- Material recording, scheduling, dispatching, and distributing workers (3.3%)
- Retail sales workers, except cashiers (3.0%)
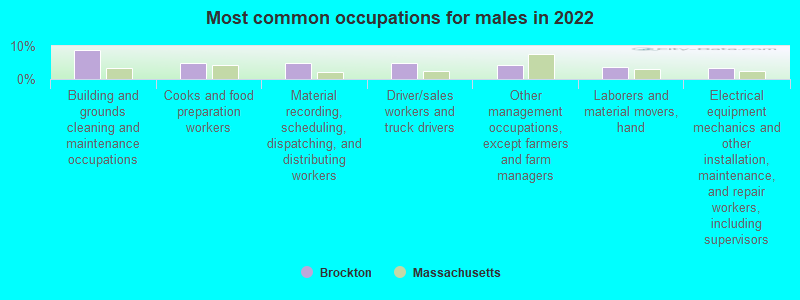
- Building and grounds cleaning and maintenance occupations (8.9%)
- Cooks and food preparation workers (5.0%)
- Material recording, scheduling, dispatching, and distributing workers (5.0%)
- Driver/sales workers and truck drivers (5.0%)
- Other management occupations, except farmers and farm managers (4.1%)
- Laborers and material movers, hand (3.7%)
- Electrical equipment mechanics and other installation, maintenance, and repair workers, including supervisors (3.4%)
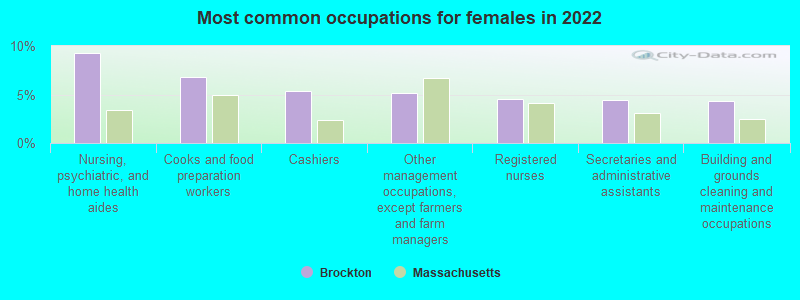
- Nursing, psychiatric, and home health aides (9.2%)
- Cooks and food preparation workers (6.8%)
- Cashiers (5.4%)
- Other management occupations, except farmers and farm managers (5.1%)
- Registered nurses (4.5%)
- Secretaries and administrative assistants (4.4%)
- Building and grounds cleaning and maintenance occupations (4.4%)
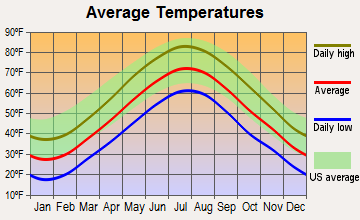
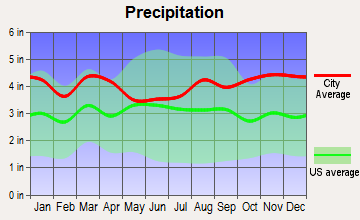
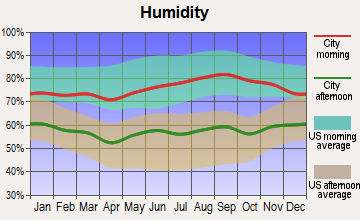
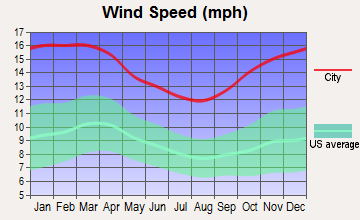
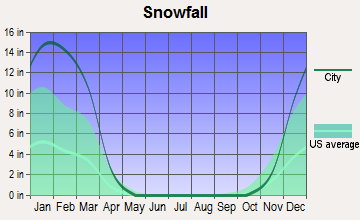
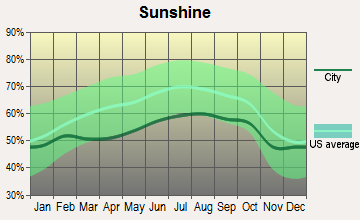
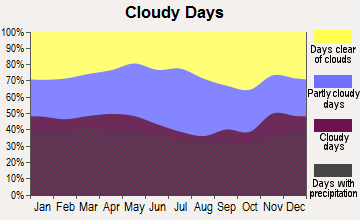
Average climate in Brockton, Massachusetts
Based on data reported by over 4,000 weather stations
|
|


(lower is better)
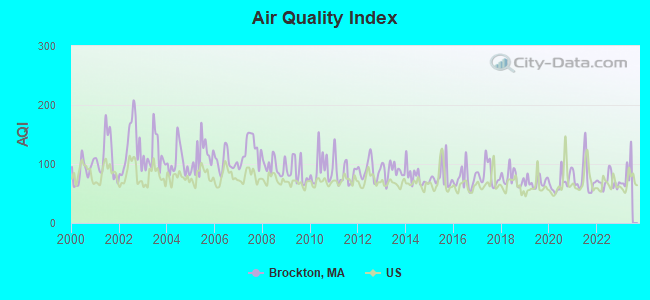
Air Quality Index (AQI) level in 2022 was 70.0. This is about average.
| City: | 70.0 |
| U.S.: | 72.6 |
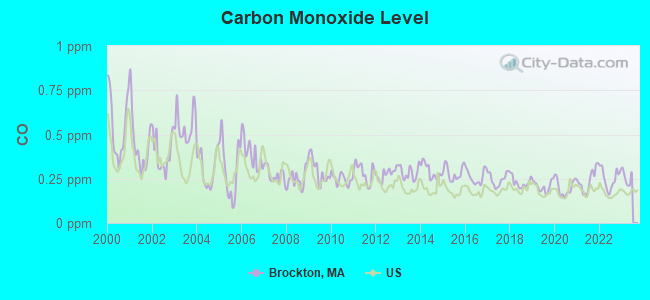
Carbon Monoxide (CO) [ppm] level in 2022 was 0.251. This is about average. Closest monitor was 11.5 miles away from the city center.
| City: | 0.251 |
| U.S.: | 0.251 |
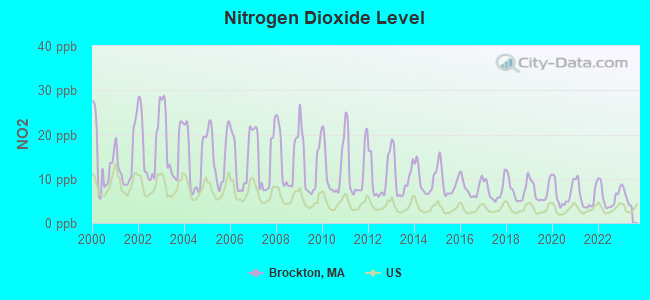
Nitrogen Dioxide (NO2) [ppb] level in 2022 was 5.87. This is about average. Closest monitor was 6.6 miles away from the city center.
| City: | 5.87 |
| U.S.: | 5.11 |
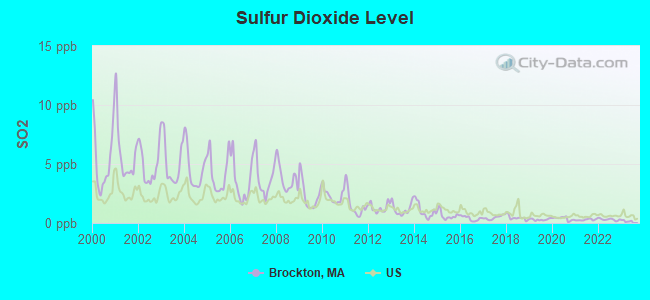
Sulfur Dioxide (SO2) [ppb] level in 2022 was 0.298. This is significantly better than average. Closest monitor was 0.4 miles away from the city center.
| City: | 0.298 |
| U.S.: | 1.515 |
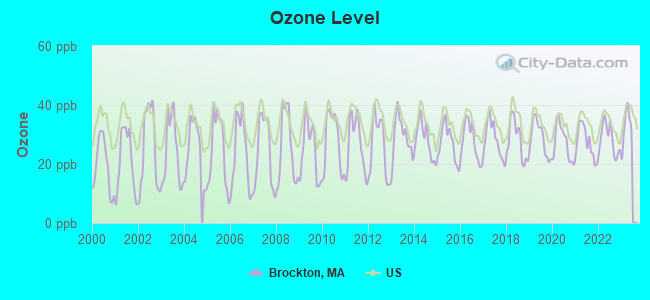
Ozone [ppb] level in 2022 was 28.4. This is about average. Closest monitor was 1.3 miles away from the city center.
| City: | 28.4 |
| U.S.: | 33.3 |
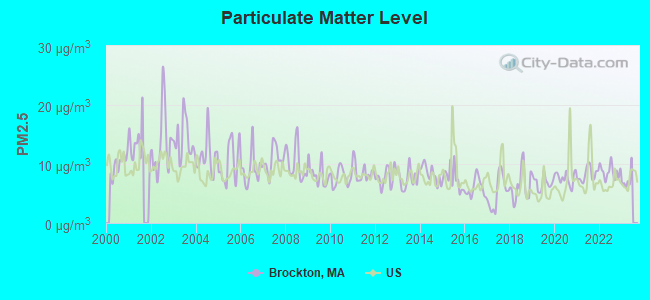
Particulate Matter (PM2.5) [µg/m3] level in 2022 was 8.70. This is about average. Closest monitor was 0.4 miles away from the city center.
| City: | 8.70 |
| U.S.: | 8.11 |
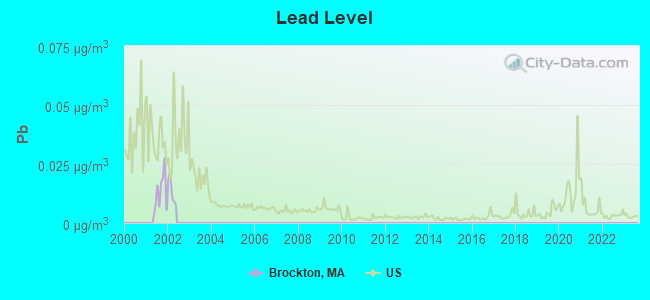
Lead (Pb) [µg/m3] level in 2001 was 0.0129. This is worse than average. Closest monitor was 0.4 miles away from the city center.
| City: | 0.0129 |
| U.S.: | 0.0093 |
Tornado activity:
Brockton-area historical tornado activity is slightly below Massachusetts state average. It is 53% smaller than the overall U.S. average.
On 6/9/1953, a category F4 (max. wind speeds 207-260 mph) tornado 29.6 miles away from the Brockton city center killed 90 people and injured 1228 people and caused between $50,000,000 and $500,000,000 in damages.
On 6/9/1953, a category F3 (max. wind speeds 158-206 mph) tornado 9.4 miles away from the city center injured 17 people and caused between $500,000 and $5,000,000 in damages.
Earthquake activity:
Brockton-area historical earthquake activity is significantly above Massachusetts state average. It is 74% smaller than the overall U.S. average.On 10/7/1983 at 10:18:46, a magnitude 5.3 (5.1 MB, 5.3 LG, 5.1 ML, Class: Moderate, Intensity: VI - VII) earthquake occurred 211.9 miles away from the city center
On 4/20/2002 at 10:50:47, a magnitude 5.3 (5.3 ML, Depth: 3.0 mi) earthquake occurred 215.3 miles away from Brockton center
On 1/19/1982 at 00:14:42, a magnitude 4.7 (4.5 MB, 4.7 MD, 4.5 LG, Class: Light, Intensity: IV - V) earthquake occurred 102.3 miles away from the city center
On 10/16/2012 at 23:12:25, a magnitude 4.7 (4.7 ML, Depth: 10.0 mi) earthquake occurred 106.4 miles away from Brockton center
On 4/20/2002 at 10:50:47, a magnitude 5.2 (5.2 MB, 4.2 MS, 5.2 MW, 5.0 MW) earthquake occurred 214.7 miles away from Brockton center
On 8/22/1992 at 12:20:32, a magnitude 4.8 (4.8 MB, 3.8 MS, 4.7 LG, Depth: 6.2 mi) earthquake occurred 209.2 miles away from the city center
Magnitude types: regional Lg-wave magnitude (LG), body-wave magnitude (MB), duration magnitude (MD), local magnitude (ML), surface-wave magnitude (MS), moment magnitude (MW)
Natural disasters:
The number of natural disasters in Plymouth County (26) is a lot greater than the US average (15).Major Disasters (Presidential) Declared: 17
Emergencies Declared: 9
Causes of natural disasters: Floods: 11, Storms: 9, Hurricanes: 7, Snows: 3, Snowstorms: 3, Blizzards: 2, Winter Storms: 2, Heavy Rain: 1, Snowfall: 1, Tropical Storm: 1, Wind: 1 (Note: some incidents may be assigned to more than one category).
Hospitals in Brockton:
- GODDARD MEM AND CARDINAL CUSHING MED CTR (provides emergency services, 235 N PEARL ST)
- GOOD SAMARITAN MEDICAL CENTER (Proprietary, provides emergency services, 235 NORTH PEARL STREET)
- HOSPICE OF BOSTON, INC (500 BELMONT STREET, SUITE 215)
- SIGNATURE HEALTHCARE BROCKTON HOSPITAL (Voluntary non-profit - Other, provides emergency services, 680 CENTER STREET)
Nursing Homes in Brockton:
- BAYPOINTE REHABILITATION AND SKILLED CARE CENTER (50 CHRISTY PLACE)
- BRAEMOOR REHABILITATION AND NURSING CENTER (34 NORTH PEARL STREET)
- BROCKWOOD HEALTH CARE - OLD (227 W ELM ST, PO BOX 4220)
- EMBASSY HOUSE HEALTHCARE NURS HOME (2 BEAUMONT AVE)
- GUARDIAN CENTER (THE) (888 NORTH MAIN STREET)
- REGENT PARK LONG TERM CARE CENTER (41 LIBBY ST)
- REGENT PARK NURS RETIREMENT HME (41 LIBBY ST)
- ST JOSEPH MANOR NURSING HOME (215 THATCHER STREET)
- WEST ACRES NURSING HOME (804 PLEASANT ST)
- WOODRIDGE HOUSE NURSING AND REHAB CENTER (596 SUMMER STREET)
Dialysis Facilities in Brockton:
- BROCKTON KIDNEY CENTER (375 WESTGATE DRIVE)
- BROCKTON REGIONAL KIDNEY CENTER (76 CAMPANELLI INDUSTRIAL DRIVE)
Home Health Centers in Brockton:
Heliports located in Brockton:
See details about Heliports located in Brockton, MAAmtrak stations near Brockton:
- 11 miles: ROUTE 128 (WESTWOOD, UNIVERSITY AVE. & RTE. 128) . Services: ticket office, enclosed waiting area, public restrooms, public payphones, vending machines, paid short-term parking, taxi stand, public transit connection.
- 19 miles: BACK BAY (BOSTON, 145 DARTMOUTH ST.) . Services: ticket office, partially wheelchair accessible, enclosed waiting area, public restrooms, public payphones, vending machines, ATM, paid short-term parking, paid long-term parking, call for car rental service, taxi stand, public transit connection.
- 19 miles: BOSTON (SO. STA) (BOSTON, ATLANTIC AVE. & SUMMER ST.) . Services: ticket office, fully wheelchair accessible, enclosed waiting area, public restrooms, public payphones, full-service food facilities and snack bar, ATM, paid short-term parking, paid long-term parking, call for car rental service, taxi stand, intercity bus service, public transit connection.
Colleges/Universities in Brockton:
- Massasoit Community College (Full-time enrollment: 5,442; Location: One Massasoit Boulevard; Public; Website: www.massasoit.mass.edu)
- Sullivan and Cogliano Training Center (Full-time enrollment: 616; Location: 460 Belmont Street; Private, for-profit; Website: www.sctrain.com)
- Lincoln Technical Institute-Brockton (Full-time enrollment: 292; Location: 365 Westgate Drive; Private, for-profit; Website: www.lincolntech.com)
- Signature Healthcare Brockton Hospital School of Nursing (Full-time enrollment: 191; Location: 680 Centre St; Private, not-for-profit; Website: www.bhson.org)
- Ailano School of Cosmetology (Full-time enrollment: 58; Location: 541 West St; Private, for-profit; Website: www.theailanoschool.com)
- La Baron Hairdressing Academy-Brockton (Full-time enrollment: 40; Location: 240 Liberty St; Private, for-profit; Website: www.labarononline.com)
Other colleges/universities with over 2000 students near Brockton:
- Stonehill College (about 4 miles; Easton, MA; Full-time enrollment: 2,563)
- Bridgewater State University (about 8 miles; Bridgewater, MA; FT enrollment: 9,802)
- Quincy College (about 12 miles; Quincy, MA; FT enrollment: 3,184)
- Curry College (about 12 miles; Milton, MA; FT enrollment: 2,586)
- University of Massachusetts-Boston (about 17 miles; Boston, MA; FT enrollment: 12,625)
- Wentworth Institute of Technology (about 18 miles; Boston, MA; FT enrollment: 4,418)
- MCPHS University (about 19 miles; Boston, MA; FT enrollment: 5,491)
Public high schools in Brockton:
- BROCKTON HIGH (Students: 4,328, Location: 470 FOREST AVENUE, Grades: 9-12)
- B B RUSSELL ALTERNATIVE SCHOOL (Students: 101, Location: 175 WARREN AVENUE, Grades: 7-12)
- GODDARD ALTERNATIVE SCHOOL (Students: 56, Location: 20 UNION STREET, Grades: 4-12)
- BROCKTON CHAMPION HIGH SCHOOL (Location: 175 WARREN AVENUE, Grades: 8-12)
- EDISON ACADEMY (Location: 470 FOREST AVENUE, Grades: 9-12)
Private high schools in Brockton:
Biggest public elementary/middle schools in Brockton:
- EDGAR B DAVIS (Students: 848, Location: 380 PLAIN STREET, Grades: KG-8)
- BROOKFIELD (Students: 749, Location: 135 JON DRIVE, Grades: KG-5)
- JOSEPH F. PLOUFFE ACADEMY (Students: 717, Location: 250 CRESCENT STREET, Grades: 6-8)
- LOUIS F ANGELO ELEMENTARY (Students: 697, Location: 472 NORTH MAIN STREET, Grades: KG-5)
- OSCAR F RAYMOND (Students: 688, Location: 125 OAK STREET, Grades: KG-8)
- HANCOCK (Students: 673, Location: 125 PEARL STREET, Grades: KG-5)
- DOWNEY (Students: 566, Location: 55 ELECTRIC AVENUE, Grades: KG-5)
- JOHN F KENNEDY (Students: 507, Location: 900 ASH STREET, Grades: KG-5)
- ASHFIELD MIDDLE SCHOOL (Students: 425, Location: 225 COE ROAD, Grades: 6-8)
- HUNTINGTON (Students: 420, Location: 1121 WARREN AVENUE, Grades: KG-5)
Private elementary/middle schools in Brockton:
Library in Brockton:
- BROCKTON PUBLIC LIBRARY SYSTEM (Operating income: $2,199,532; Location: 304 MAIN ST.; 197,389 books; 229 e-books; 6,024 audio materials; 9,351 video materials; 6 local licensed databases; 34 state licensed databases; 1 other licensed databases; 183 print serial subscriptions; 2 electronic serial subscriptions)
Points of interest:
Notable locations in Brockton: Montello Station (A), Brockton Station (B), Campello Station (C), Thorny Lea Golf Club (D), Pine Valley Golf Club (E), Brockton Golf Club (F), Southgate Plaza (G), Points West Plaza (H), East Ashland Shopping Plaza (I), Cary Hill Plaza (J), Brockton East Shopping Plaza (K), Brockton Country Club (L), D W Field Golf Course (M), Thorny Lea Golf Course (N), Wedgewood Country Club (O), Brockton Fire Department Station 7 (P), Brockton Fire Department Station 3 (Q), Brockton Fire Department Station 2 (R), Brockton Fire Department Station 4 (S), Brockton Fire Department Station 6 Headquarters (T). Display/hide their locations on the map
Shopping Centers: Westgate Mall (1), East-Way Shopping Center (2), Westgate Shopping Center (3), Brockton East Shopping Plaza Shopping Center (4). Display/hide their locations on the map
Churches in Brockton include: Word of God Church (A), Warren Avenue Baptist Church (B), Universalist Unitarian Church (C), Trinity Baptist Church (D), Salvation Army (E), Pentecostal United Methodist Church (F), Pearl Street United Methodist Church (G), Olivet Memorial Church (H), New Life Church (I). Display/hide their locations on the map
Cemeteries: Melrose Cemetery (1), Chevra Tilum Cemetery (2), Coweeset Cemetery (3), Union Cemetery (4), Saint Patricks Cemetery (5), Calvary Cemetery (6), Leach Cemetery (7). Display/hide their locations on the map
Lakes and reservoirs: Ellis Brett Pond (A), Waldo Lake (B), Cross Pond (C), Bigney Pond (D), Lower Porter Pond (E), Thirtyacre Pond (F), Upper Porter Pond (G), Flagg Pond (H). Display/hide their locations on the map
Streams, rivers, and creeks: Leach Brook (A), Searles Brook (B), Salisbury Brook (C), Malfardar Brook (D), Lovett Brook (E), French Brook (F), Dorchester Brook (G), Daley Brook (H), Cary Brook (I). Display/hide their locations on the map
Parks in Brockton include: Winthrop Square (1), Turkis Playground (2), South Street Historic District (3), Pulaski Square (4), Puffer Playground (5), Nelson Playground (6), Keith Memorial Field (7), Jas Edgar Playground (8), Hancock Field (9). Display/hide their locations on the map
Tourist attractions: Brockton Historical Society (Museums; 216 North Pearl Street) (1), Brockton Fire Museum (216 North Pearl Street) (2), Fuller Craft Museum (455 Oak Street) (3), Brockton City - Public Libraries- West Branch (Cultural Attractions- Events- & Facilities; 540 Forest Avenue) (4), Brockton City - Public Libraries- Main (Cultural Attractions- Events- & Facilities; 304 Main Street) (5), Brockton City - Public Libraries- East Branch (Cultural Attractions- Events- & Facilities; 54 Kingman Street) (6), Brockton Fair (Arcades & Amusements; 600 Belmont) (7), COD The Cult Of Dan (Arcades & Amusements; 407 Trudy Terrace) (8). Display/hide their approximate locations on the map
Hotels: Cassano's Ristorante & Lounge (1005 Belmont Street) (1), Country Inn-Suites Brockton (50 Christys Drive) (2), Best Western Carlton House (1005 Belmont St) (3), Academy Inn (162 Warren Avenue) (4), Hotel Grayson (32 High Street) (5), Radisson Hotel Brockton (195 Westgate Drive) (6), Skeeter's Tavern (33 West Elm Street) (7), Radisson (195 Westgate Drive) (8). Display/hide their approximate locations on the map
Courts: Mass Commonwealth - Courts- District Court (98 Montauk Road) (1), Mass Commonwealth - Courts- Juvenile Court- Clerk's Ofc (98 Montauk Road) (2), Mass Commonwealth - Courts- Plymouth County Probate & Family Court (215 Main Street) (3), Mass Commonwealth - Courts- Housing Court- Southeastern Housing Court (215 Main Street) (4), Mass Commonwealth - Courts- Juvenile Court- Probation Department (98 Montauk Road) (5), Brockton Probate & Family Court (215 Main Street) (6), Mass Commonwealth - Courts- Plymouth County Superior Court (72 Belmont Street) (7), Brockton Housing Court (215 Main Street) (8). Display/hide their approximate locations on the map
Birthplace of: Al Davis - Football player, Mark Egan - Jazz musician, Scott Gordon - Ice hockey goaltender, Rocky Marciano - Heavyweight boxer, Frank Sexton (baseball) - Baseball player and coach, Glenn D. Paige - Pacifist, Andrew Card - Secretary of Transportation, Thomas A. Barry - Baseball player and coach, Dave Wedge - Politician, Josh Hennessy - Ice hockey player.
Drinking water stations with addresses in Brockton and their reported violations in the past:
BROCKTON WATER COMMISSION (Population served: 93,810, Surface water):Past health violations:WOLFEBORO 7 ELEVEN NO 32506 (Serves NH, Population served: 25, Groundwater):
- MCL, Average - Between APR-2014 and JUN-2014, Contaminant: TTHM. Follow-up actions: St AO (w/o penalty) issued (AUG-27-2014)
- MCL, Average - Between JAN-2014 and MAR-2014, Contaminant: TTHM. Follow-up actions: St AO (w/o penalty) issued (AUG-27-2014)
- MCL, Average - Between OCT-2013 and DEC-2013, Contaminant: TTHM. Follow-up actions: St AO (w/o penalty) issued (AUG-27-2014)
Past health violations:Past monitoring violations:
- MCL, Monthly (TCR) - Between OCT-2011 and DEC-2011, Contaminant: Coliform. Follow-up actions: St Public Notif requested (OCT-24-2011), St Violation/Reminder Notice (OCT-24-2011), St Public Notif received (OCT-27-2011), St Compliance achieved (MAY-22-2012)
- Failure To Address Deficiency - In MAR-05-2011, Contaminant: GROUNDWATER RULE. Follow-up actions: St Public Notif requested (MAR-18-2011), St Violation/Reminder Notice (MAR-18-2011), St Compliance achieved (APR-14-2011), St Public Notif received (JUN-01-2011)
- One routine major monitoring violation
| This city: | 2.8 people |
| Massachusetts: | 2.5 people |
| This city: | 67.5% |
| Whole state: | 63.0% |
| This city: | 7.8% |
| Whole state: | 7.0% |
Likely homosexual households (counted as self-reported same-sex unmarried-partner households)
- Lesbian couples: 0.5% of all households
- Gay men: 0.4% of all households
People in group quarters in Brockton in 2010:
- 790 people in nursing facilities/skilled-nursing facilities
- 307 people in emergency and transitional shelters (with sleeping facilities) for people experiencing homelessness
- 238 people in other noninstitutional facilities
- 121 people in mental (psychiatric) hospitals and psychiatric units in other hospitals
- 97 people in group homes intended for adults
- 74 people in hospitals with patients who have no usual home elsewhere
- 41 people in group homes for juveniles (non-correctional)
- 38 people in residential treatment centers for adults
- 33 people in in-patient hospice facilities
- 18 people in residential treatment centers for juveniles (non-correctional)
- 6 people in correctional residential facilities
- 5 people in residential schools for people with disabilities
People in group quarters in Brockton in 2000:
- 927 people in nursing homes
- 185 people in hospitals/wards and hospices for chronically ill
- 185 people in other hospitals or wards for chronically ill
- 183 people in homes or halfway houses for drug/alcohol abuse
- 163 people in other noninstitutional group quarters
- 79 people in mental (psychiatric) hospitals or wards
- 79 people in religious group quarters
- 51 people in short-term care, detention or diagnostic centers for delinquent children
- 42 people in training schools for juvenile delinquents
- 34 people in other nonhousehold living situations
- 28 people in hospitals or wards for drug/alcohol abuse
- 24 people in orthopedic wards and institutions for the physically handicapped
- 22 people in homes for the mentally retarded
- 20 people in other group homes
- 19 people in wards in general hospitals for patients who have no usual home elsewhere
- 12 people in halfway houses
- 8 people in homes for the mentally ill
Banks with most branches in Brockton (2011 data):
- Rockland Trust Company: Brockton Branch, Brockton Branch, Brockton-Belmont St Branch, Montello Branch. Info updated 2009/05/20: Bank assets: $4,974.4 mil, Deposits: $3,903.9 mil, headquarters in Rockland, MA, positive income, Commercial Lending Specialization, 67 total offices, Holding Company: Independent Bank Corp.
- Bank of America, National Association: West Brockton Branch, East Brockton Branch, South Brockton Branch. Info updated 2009/11/18: Bank assets: $1,451,969.3 mil, Deposits: $1,077,176.8 mil, headquarters in Charlotte, NC, positive income, 5782 total offices, Holding Company: Bank Of America Corporation
- Webster Bank, National Association: Centre Street Branch, Oak Street Branch, West Shopping Center Branch. Info updated 2008/12/23: Bank assets: $18,674.3 mil, Deposits: $13,861.5 mil, headquarters in Waterbury, CT, positive income, Commercial Lending Specialization, 167 total offices, Holding Company: Webster Financial Corporation
- The Community Bank, A Massachusetts Cooperative Bank: at 1265 Belmont Street, branch established on 1878/01/01; Brockton Branch at 276 Quincy Street, branch established on 1975/01/01. Info updated 2011/01/14: Bank assets: $324.2 mil, Deposits: $283.4 mil, local headquarters, negative income in the last year, Commercial Lending Specialization, 5 total offices, Holding Company: Campello Bancorp
- RBS Citizens, National Association: Brockton Stop & Shop Montello Branch at 932 North Montello Street, branch established on 2003/10/16; Brockton Stop And Shop Branch at 683 Belmont Street, branch established on 2002/09/25. Info updated 2007/09/19: Bank assets: $106,940.6 mil, Deposits: $75,690.2 mil, headquarters in Providence, RI, positive income, 1135 total offices, Holding Company: Uk Financial Investments Limited
- Mutual Federal Savings Bank of Plymouth County: East Side Branch at 656 Crescent Street, branch established on 1877/01/01; West Side Branch at 777 Belmont Street, branch established on 1877/01/01. Info updated 2011/07/21: Bank assets: $369.9 mil, Deposits: $260.8 mil, headquarters in Whitman, MA, positive income, Mortgage Lending Specialization, 9 total offices
- Holbrook Co-operative Bank: Brockton Branch at 60 Crescent Street, branch established on 2009/06/02. Info updated 2006/11/03: Bank assets: $92.9 mil, Deposits: $84.3 mil, headquarters in Holbrook, MA, negative income in the last year, Commercial Lending Specialization, 2 total offices
- Eastern Bank: Stonehill Branch at 1313 Belmont Street, branch established on 1972/11/20. Info updated 2011/03/30: Bank assets: $7,812.9 mil, Deposits: $6,295.8 mil, headquarters in Boston, MA, positive income, Commercial Lending Specialization, 94 total offices, Holding Company: Eastern Bank Corporation
- Sovereign Bank, National Association: Brockton Branch at 25 Torrey St, branch established on 2002/02/19. Info updated 2012/01/31: Bank assets: $78,146.9 mil, Deposits: $48,042.9 mil, headquarters in Wilmington, DE, positive income, Commercial Lending Specialization, 718 total offices, Holding Company: Banco Santander, S.A.
For population 15 years and over in Brockton:
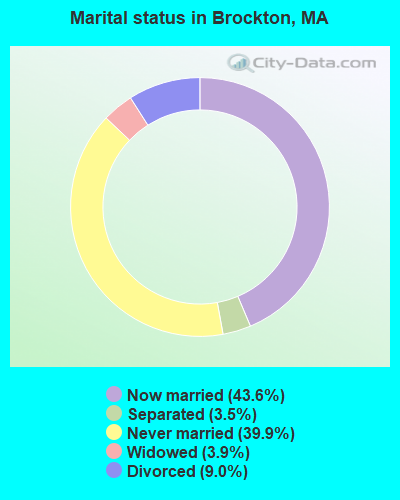
- Never married: 39.9%
- Now married: 43.6%
- Separated: 3.5%
- Widowed: 3.9%
- Divorced: 9.0%
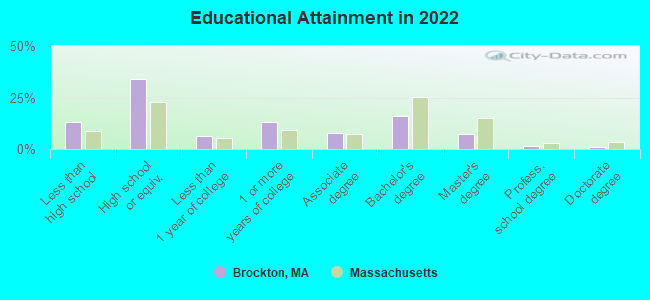
For population 25 years and over in Brockton:
- High school or higher: 86.7%
- Bachelor's degree or higher: 25.6%
- Graduate or professional degree: 9.5%
- Unemployed: 6.7%
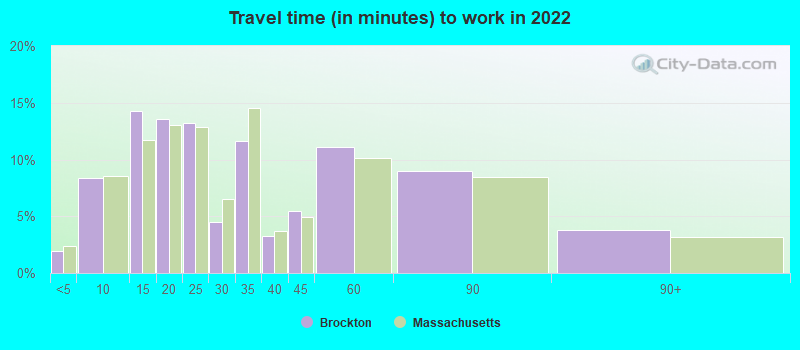
- Mean travel time to work (commute): 30.5 minutes
| Here: | 13.3 |
| Massachusetts average: | 13.0 |
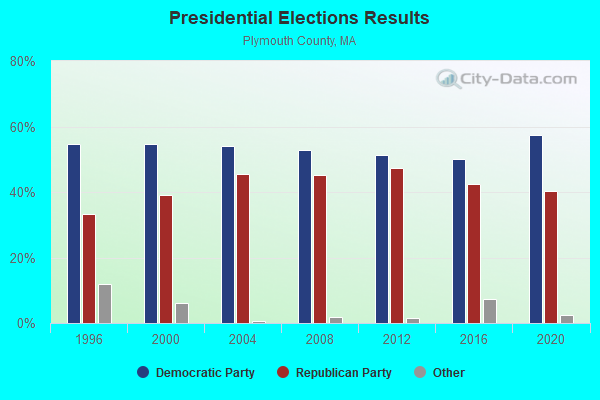
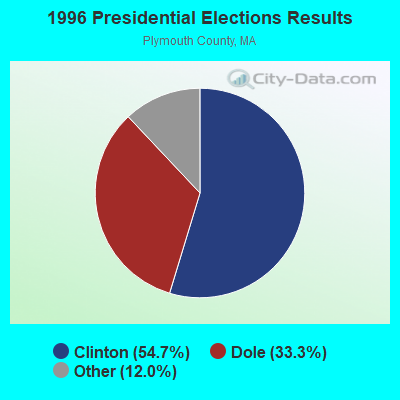
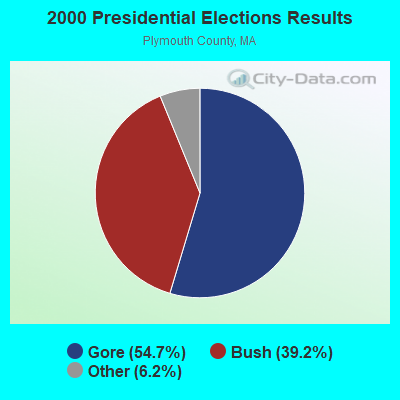
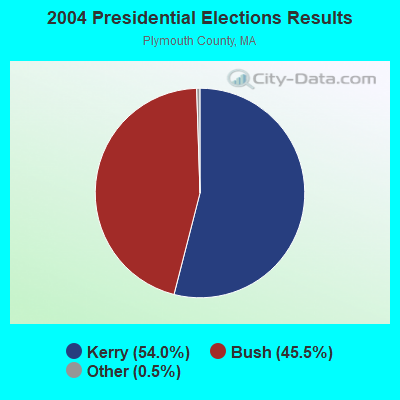
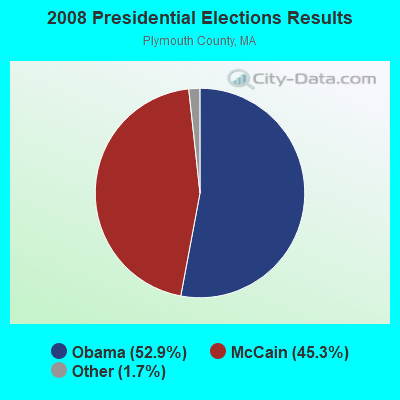

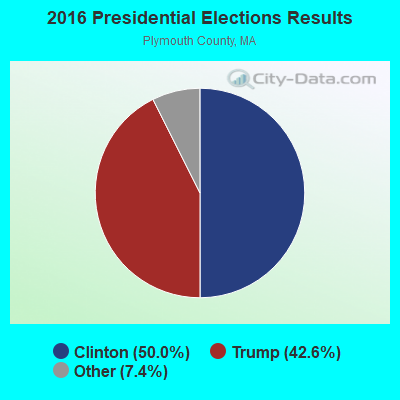
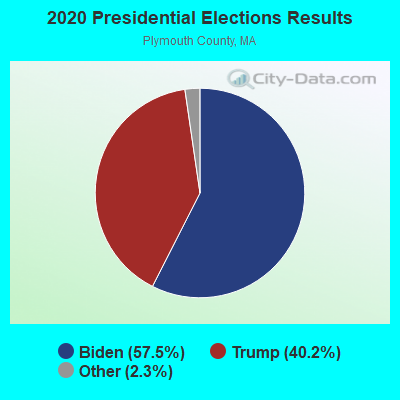
Graphs represent county-level data. Detailed 2008 Election Results
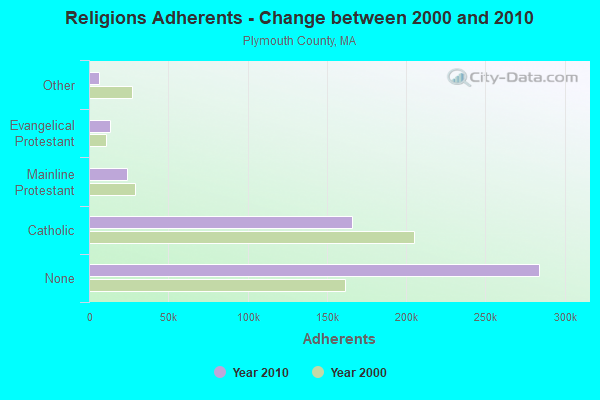
Religion statistics for Brockton, MA (based on Plymouth County data)
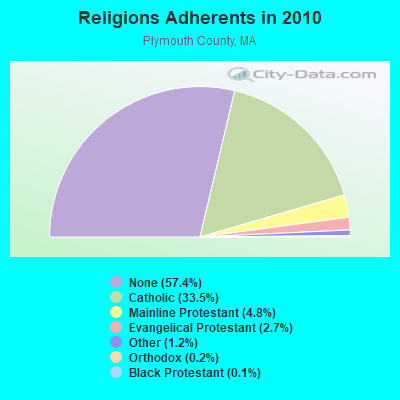
| Religion | Adherents | Congregations |
|---|---|---|
| Catholic | 165,985 | 35 |
| Mainline Protestant | 23,724 | 91 |
| Evangelical Protestant | 13,159 | 96 |
| Other | 6,129 | 43 |
| Orthodox | 1,140 | 3 |
| Black Protestant | 611 | 5 |
| None | 284,171 | - |
Food Environment Statistics:
| Plymouth County: | 1.74 / 10,000 pop. |
| Massachusetts: | 1.98 / 10,000 pop. |
| Plymouth County: | 0.04 / 10,000 pop. |
| Massachusetts: | 0.05 / 10,000 pop. |
| This county: | 2.84 / 10,000 pop. |
| Massachusetts: | 2.22 / 10,000 pop. |
| This county: | 2.20 / 10,000 pop. |
| Massachusetts: | 1.77 / 10,000 pop. |
| This county: | 7.37 / 10,000 pop. |
| Massachusetts: | 8.76 / 10,000 pop. |
| Here: | 7.9% |
| Massachusetts: | 8.1% |
| This county: | 21.7% |
| Massachusetts: | 22.5% |
| Plymouth County: | 16.3% |
| State: | 16.5% |
Health and Nutrition:
| Brockton: | 48.5% |
| Massachusetts: | 50.5% |
| Brockton: | 45.6% |
| Massachusetts: | 48.0% |
| Brockton: | 28.9 |
| Massachusetts: | 28.4 |
| Here: | 22.1% |
| Massachusetts: | 20.7% |
| Here: | 11.0% |
| Massachusetts: | 10.4% |
| This city: | 6.8 |
| State: | 6.8 |
| Brockton: | 33.7% |
| State: | 33.4% |
| This city: | 54.9% |
| Massachusetts: | 57.1% |
| This city: | 79.6% |
| Massachusetts: | 79.2% |
More about Health and Nutrition of Brockton, MA Residents
| Local government employment and payroll (March 2022) | |||||
| Function | Full-time employees | Monthly full-time payroll | Average yearly full-time wage | Part-time employees | Monthly part-time payroll |
|---|---|---|---|---|---|
| Elementary and Secondary - Instruction | 1,634 | $11,904,226 | $87,424 | 377 | $418,877 |
| Elementary and Secondary - Other Total | 509 | $2,789,515 | $65,765 | 53 | $69,225 |
| Police Protection - Officers | 202 | $2,125,130 | $126,245 | 0 | $0 |
| Firefighters | 188 | $978,212 | $62,439 | 0 | $0 |
| Financial Administration | 41 | $286,044 | $83,720 | 3 | $6,346 |
| Other and Unallocable | 35 | $220,844 | $75,718 | 16 | $10,148 |
| Water Supply | 35 | $241,056 | $82,648 | 0 | $0 |
| Other Government Administration | 32 | $199,864 | $74,949 | 14 | $18,660 |
| Streets and Highways | 29 | $166,842 | $69,038 | 0 | $0 |
| Police - Other | 23 | $146,555 | $76,463 | 0 | $0 |
| Health | 23 | $150,494 | $78,519 | 5 | $596 |
| Sewerage | 18 | $118,932 | $79,288 | 0 | $0 |
| Local Libraries | 17 | $91,550 | $64,624 | 24 | $43,867 |
| Fire - Other | 17 | $150,306 | $106,098 | 0 | $0 |
| Parks and Recreation | 14 | $104,359 | $89,451 | 1 | $1,067 |
| Solid Waste Management | 11 | $57,228 | $62,431 | 0 | $0 |
| Housing and Community Development (Local) | 7 | $37,260 | $63,874 | 1 | $1,178 |
| Judicial and Legal | 5 | $40,497 | $97,193 | 4 | $10,704 |
| Welfare | 5 | $32,205 | $77,292 | 2 | $2,572 |
| Totals for Government | 2,845 | $19,841,116 | $83,688 | 500 | $583,239 |
Brockton government finances - Expenditure in 2021 (per resident):
- Current Operations - Elementary and Secondary Education: $273,380,000 ($2607.94)
General - Other: $50,095,000 ($477.89)
Local Fire Protection: $25,369,000 ($242.01)
Police Protection: $25,086,000 ($239.31)
Sewerage: $15,732,000 ($150.08)
Water Utilities: $15,604,000 ($148.86)
Regular Highways: $7,124,000 ($67.96)
Financial Administration: $4,951,000 ($47.23)
Central Staff Services: $3,059,000 ($29.18)
Parks and Recreation: $2,492,000 ($23.77)
Libraries: $2,403,000 ($22.92)
General Public Buildings: $2,245,000 ($21.42)
Protective Inspection and Regulation - Other: $1,216,000 ($11.60)
Judicial and Legal Services: $1,147,000 ($10.94)
Parking Facilities: $938,000 ($8.95)
Health - Other: $927,000 ($8.84)
Public Welfare - Other: $868,000 ($8.28)
Natural Resources - Other: $8,000 ($0.08)
- General - Interest on Debt: $5,736,000 ($54.72)
- Intergovernmental to Local - Other - Elementary and Secondary Education: $5,807,000 ($55.40)
Other - Health - Other: $151,000 ($1.44)
Other - Central Staff Services: $37,000 ($0.35)
- Intergovernmental to State - Transit Utilities: $2,547,000 ($24.30)
General - Other: $235,000 ($2.24)
- Other Capital Outlay - Elementary and Secondary Education: $12,229,000 ($116.66)
General - Other: $3,183,000 ($30.36)
Regular Highways: $2,382,000 ($22.72)
Water Utilities: $884,000 ($8.43)
Local Fire Protection: $774,000 ($7.38)
Sewerage: $631,000 ($6.02)
Police Protection: $180,000 ($1.72)
Central Staff Services: $176,000 ($1.68)
Libraries: $63,000 ($0.60)
Protective Inspection and Regulation - Other: $14,000 ($0.13)
Parks and Recreation: $12,000 ($0.11)
General Public Building: $11,000 ($0.10)
Financial Administration: $8,000 ($0.08)
- Total Salaries and Wages: $168,050,000 ($1603.13)
- Water Utilities - Interest on Debt: $436,000 ($4.16)
Brockton government finances - Revenue in 2021 (per resident):
- Charges - Sewerage: $19,280,000 ($183.92)
Other: $10,398,000 ($99.19)
Elementary and Secondary Education School Lunch: $4,232,000 ($40.37)
Parks and Recreation: $1,753,000 ($16.72)
Parking Facilities: $684,000 ($6.53)
Elementary and Secondary Education School Tuition and Transportation: $535,000 ($5.10)
Sea and Inland Port Facilities: $129,000 ($1.23)
- Federal Intergovernmental - Other: $39,442,000 ($376.26)
- Local Intergovernmental - Education: $72,000 ($0.69)
- Miscellaneous - General Revenue - Other: $2,386,000 ($22.76)
Donations From Private Sources: $996,000 ($9.50)
Fines and Forfeits: $448,000 ($4.27)
Interest Earnings: $204,000 ($1.95)
- Revenue - Water Utilities: $21,125,000 ($201.52)
- State Intergovernmental - Education: $226,249,000 ($2158.33)
General Local Government Support: $22,657,000 ($216.14)
Other: $4,391,000 ($41.89)
Highways: $2,470,000 ($23.56)
Public Welfare: $556,000 ($5.30)
Housing and Community Development: $129,000 ($1.23)
- Tax - Property: $166,042,000 ($1583.98)
Other License: $4,603,000 ($43.91)
Other Selective Sales: $2,189,000 ($20.88)
Brockton government finances - Debt in 2021 (per resident):
- Long Term Debt - Beginning Outstanding - Unspecified Public Purpose: $164,002,000 ($1564.52)
Outstanding Unspecified Public Purpose: $160,449,000 ($1530.62)
Retired Unspecified Public Purpose: $19,018,000 ($181.42)
Issue, Unspecified Public Purpose: $15,466,000 ($147.54)
- Short Term Debt Outstanding - End of Fiscal Year: $19,376,000 ($184.84)
Beginning: $15,289,000 ($145.85)
Brockton government finances - Cash and Securities in 2021 (per resident):
- Bond Funds - Cash and Securities: $14,820,000 ($141.38)
- Other Funds - Cash and Securities: $128,301,000 ($1223.94)
5.54% of this county's 2020 resident taxpayers moved to other counties in 2021 ($85,482 average adjusted gross income)
| Here: | 5.54% |
| Massachusetts average: | 7.18% |
0.01% of residents moved to foreign countries ($80 average AGI)
Plymouth County: 0.01% Massachusetts average: 0.02%
Top counties to which taxpayers relocated from this county between 2020 and 2021:
| to Bristol County, MA | |
| to Norfolk County, MA | |
| to Suffolk County, MA |
| Businesses in Brockton, MA | ||||
| Name | Count | Name | Count | |
|---|---|---|---|---|
| 7-Eleven | 3 | Mazda | 1 | |
| AT&T | 1 | McDonald's | 4 | |
| Ace Hardware | 1 | Men's Wearhouse | 1 | |
| Advance Auto Parts | 4 | Motherhood Maternity | 1 | |
| Aeropostale | 1 | New Balance | 1 | |
| American Eagle Outfitters | 1 | Nike | 8 | |
| AutoZone | 3 | Nissan | 1 | |
| Bath & Body Works | 1 | Old Navy | 1 | |
| Blockbuster | 1 | Payless | 2 | |
| Burger King | 1 | Penske | 1 | |
| CVS | 7 | PetSmart | 1 | |
| Catherines | 1 | Popeyes | 1 | |
| Chevrolet | 1 | Quality | 1 | |
| Circle K | 2 | RadioShack | 3 | |
| Dairy Queen | 2 | Rite Aid | 1 | |
| Domino's Pizza | 2 | SAS Shoes | 1 | |
| Dunkin Donuts | 19 | Sears | 2 | |
| Fashion Bug | 1 | Shaw's | 2 | |
| FedEx | 12 | Sprint Nextel | 2 | |
| Finish Line | 1 | Staples | 1 | |
| Firestone Complete Auto Care | 1 | Starbucks | 1 | |
| GNC | 2 | Stop & Shop | 2 | |
| GameStop | 2 | Subway | 3 | |
| Goodwill | 2 | Super 8 | 1 | |
| H&R Block | 6 | T-Mobile | 4 | |
| Home Depot | 1 | Taco Bell | 2 | |
| Honda | 1 | Toyota | 1 | |
| Hot Topic | 1 | Toys"R"Us | 2 | |
| Hyundai | 1 | U-Haul | 3 | |
| Jones New York | 1 | UPS | 12 | |
| KFC | 1 | Vans | 2 | |
| Kmart | 1 | Victoria's Secret | 1 | |
| LensCrafters | 1 | Volkswagen | 1 | |
| Little Caesars Pizza | 1 | Walgreens | 5 | |
| Lowe's | 1 | Walmart | 1 | |
| Macy's | 1 | Wendy's | 2 | |
| Marriott | 1 | YMCA | 6 | |
| Marshalls | 1 | |||
Strongest AM radio stations in Brockton:
- WBET (1460 AM; 5 kW; BROCKTON, MA; Owner: KJI BROADCASTING, LLC)
- WBZ (1030 AM; 50 kW; BOSTON, MA; Owner: INFINITY BROADCASTING OPERATIONS, INC.)
- WMSX (1410 AM; 1 kW; BROCKTON, MA; Owner: ANASTOS MEDIA GROUP, INC.)
- WEEI (850 AM; 50 kW; BOSTON, MA; Owner: ENTERCOM BOSTON LICENSE, LLC)
- WRKO (680 AM; 50 kW; BOSTON, MA; Owner: ENTERCOM BOSTON LICENSE, LLC)
- WKOX (1200 AM; 50 kW; FRAMINGHAM, MA; Owner: CAPSTAR TX LIMITED PARTNERSHIP)
- WWZN (1510 AM; 50 kW; BOSTON, MA; Owner: ROSE CITY RADIO CORPORATION)
- WBIX (1060 AM; 40 kW; NATICK, MA; Owner: LANGER BROADCASTING CORPORATION)
- WALE (990 AM; 50 kW; GREENVILLE, RI; Owner: NORTH AMERICAN BROADCASTING CO., INC.)
- WAMG (890 AM; 25 kW; DEDHAM, MA; Owner: MEGA COMMUNICATIONS OF DEDHAM LICENSEE, LLC)
- WUNR (1600 AM; 20 kW; BROOKLINE, MA; Owner: CHAMPION BROADCASTING SYSTEMS, INC.)
- WRCA (1330 AM; 25 kW; WALTHAM, MA; Owner: WRCA LICENSE, LLC)
- WCRN (830 AM; 50 kW; WORCESTER, MA; Owner: CARTER BROADCASTING CORPORATION)
Strongest FM radio stations in Brockton:
- WBOT (97.7 FM; BROCKTON, MA; Owner: RADIO ONE LICENSES, LLC)
- WXKS-FM (107.9 FM; MEDFORD, MA; Owner: AMFM RADIO LICENSES, L.L.C.)
- WBMX (98.5 FM; BOSTON, MA; Owner: INFINITY RADIO OPERATIONS INC.)
- WBOS (92.9 FM; BROOKLINE, MA; Owner: GREATER BOSTON RADIO, INC.)
- WMJX (106.7 FM; BOSTON, MA; Owner: GREATER BOSTON RADIO, INC.)
- WJMN (94.5 FM; BOSTON, MA; Owner: AMFM RADIO LICENSES, L.L.C.)
- WCRB (102.5 FM; WALTHAM, MA; Owner: CHARLES RIVER BROADCASTING WCRB LICE)
- WTKK (96.9 FM; BOSTON, MA; Owner: GREATER BOSTON RADIO, INC.)
- WROR-FM (105.7 FM; FRAMINGHAM, MA; Owner: GREATER BOSTON RADIO, INC.)
- WGBH (89.7 FM; BOSTON, MA; Owner: WGBH EDUCATIONAL FOUNDATION)
- WBUR-FM (90.9 FM; BOSTON, MA; Owner: TRUSTEES OF BOSTON UNIVERSITY)
- WODS (103.3 FM; BOSTON, MA; Owner: INFINITY BROADCASTING OPERATIONS, INC.)
- WWBB (101.5 FM; PROVIDENCE, RI; Owner: CLEAR CHANNEL BROADCASTING LICENSES, INC.)
- WBCN (104.1 FM; BOSTON, MA; Owner: HEMISPHERE BROADCASTING CORPORATION)
- WZLX (100.7 FM; BOSTON, MA; Owner: INFINITY BROADCASTING CORPORATION OF BOSTON)
- W267AI (101.3 FM; BOSTON, MA; Owner: MCC BROADCASTING COMPANY, INC.)
- WERS (88.9 FM; BOSTON, MA; Owner: EMERSON COLLEGE)
- WSHL-FM (91.3 FM; EASTON, MA; Owner: STONEHILL COLLEGE, INC.)
- WHRB (95.3 FM; CAMBRIDGE, MA; Owner: HARVARD RADIO BROADCASTING CO., INC.)
- WRPS (88.3 FM; ROCKLAND, MA; Owner: ROCKLAND PUBLIC SCHOOLS)
TV broadcast stations around Brockton:
- WWDP (Channel 46; NORWELL, MA; Owner: NORWELL TELEVISION, LLC)
- WCVB-TV (Channel 5; BOSTON, MA; Owner: WCVB HEARST-ARGYLE TV, INC.)
- WGBH-TV (Channel 2; BOSTON, MA; Owner: WGBH EDUCATIONAL FOUNDATION)
- WHDH-TV (Channel 7; BOSTON, MA; Owner: WHDH-TV)
- WMFP (Channel 62; LAWRENCE, MA; Owner: WSAH LICENSE, INC.)
- WSBK-TV (Channel 38; BOSTON, MA; Owner: VIACOM INC.)
- WLVI-TV (Channel 56; CAMBRIDGE, MA; Owner: WLVI, INC.)
- WBZ-TV (Channel 4; BOSTON, MA; Owner: VIACOM INC.)
- WGBX-TV (Channel 44; BOSTON, MA; Owner: WGBH EDUCATIONAL FOUNDATION)
- WFXT (Channel 25; BOSTON, MA; Owner: FOX TELEVISION STATIONS INC.)
- WBPX (Channel 68; BOSTON, MA; Owner: PAXSON BOSTON-68 LICENSE, INC.)
- WLNE-TV (Channel 6; NEW BEDFORD, MA; Owner: FREEDOM BROADCASTING OF SOUTHERN NEW ENGLAND, INC.)
- WPRI-TV (Channel 12; PROVIDENCE, RI; Owner: TVL BROADCASTING OF RHODE ISLAND, LLC)
- W40BO (Channel 40; BOSTON, MA; Owner: PAXSON COMMUNICATIONS LPTV, INC.)
- WNAC-TV (Channel 64; PROVIDENCE, RI; Owner: WNAC, LLC)
- WTMU-LP (Channel 32; BOSTON, MA; Owner: ZGS BOSTON, INC.)
- WCEA-LP (Channel 58; BOSTON, MA; Owner: CHANNEL 19 TV CORPORATION)
- WJAR (Channel 10; PROVIDENCE, RI; Owner: OUTLET BROADCASTING, INC.)
- WSBE-TV (Channel 36; PROVIDENCE, RI; Owner: RHODE ISLAND PUBLIC TELECOM. AUTHORITY)
- WLWC (Channel 28; NEW BEDFORD, MA; Owner: C-28 FCC LICENSEE SUBSIDIARY, LLC)
- WUTF (Channel 66; MARLBOROUGH, MA; Owner: TELEFUTURA BOSTON LLC)
- WUNI (Channel 27; WORCESTER, MA; Owner: ENTRAVISION HOLDINGS, LLC)
- WPXQ (Channel 69; BLOCK ISLAND, RI; Owner: OCEAN STATE TELEVISION, L.L.C.)
Medal of Honor Recipients
Medal of Honor Recipient born in Brockton: Gordon M. Craig.
- National Bridge Inventory (NBI) Statistics
- 37Number of bridges
- 184ft / 55.7mTotal length
- $48,960,000Total costs
- 676,464Total average daily traffic
- 40,703Total average daily truck traffic
- 1,245,236Total future (year 2031) average daily traffic
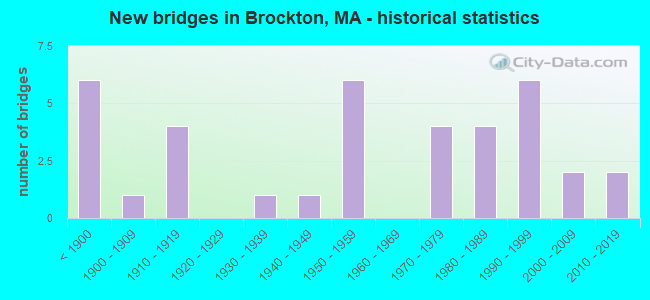
- New bridges - historical statistics
- 6Before 1900
- 11900-1909
- 41910-1919
- 11930-1939
- 11940-1949
- 61950-1959
- 41970-1979
- 41980-1989
- 61990-1999
- 22000-2009
- 22010-2019
FCC Registered Private Land Mobile Towers: 2 (See the full list of FCC Registered Private Land Mobile Towers in Brockton, MA)
FCC Registered Broadcast Land Mobile Towers: 32 (See the full list of FCC Registered Broadcast Land Mobile Towers)
FCC Registered Microwave Towers: 25 (See the full list of FCC Registered Microwave Towers in this town)
FCC Registered Paging Towers: 2 (See the full list of FCC Registered Paging Towers)
FCC Registered Amateur Radio Licenses: 134 (See the full list of FCC Registered Amateur Radio Licenses in Brockton)
FAA Registered Aircraft: 10 (See the full list of FAA Registered Aircraft in Brockton)
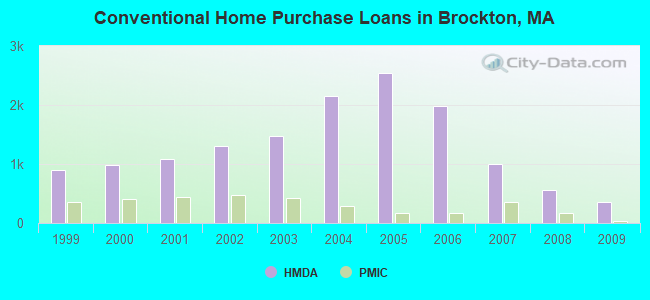
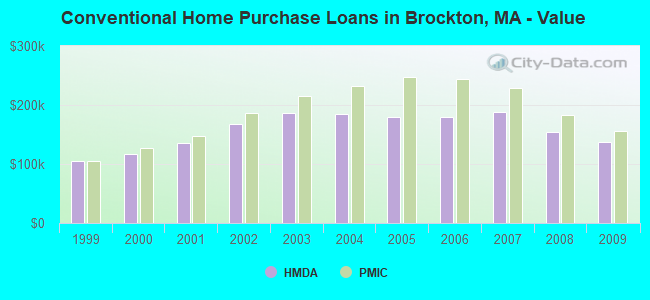
| Home Mortgage Disclosure Act Aggregated Statistics For Year 2009 (Based on 21 full tracts) | ||||||||||||||
| A) FHA, FSA/RHS & VA Home Purchase Loans | B) Conventional Home Purchase Loans | C) Refinancings | D) Home Improvement Loans | E) Loans on Dwellings For 5+ Families | F) Non-occupant Loans on < 5 Family Dwellings (A B C & D) | G) Loans On Manufactured Home Dwelling (A B C & D) | ||||||||
|---|---|---|---|---|---|---|---|---|---|---|---|---|---|---|
| Number | Average Value | Number | Average Value | Number | Average Value | Number | Average Value | Number | Average Value | Number | Average Value | Number | Average Value | |
| LOANS ORIGINATED | 430 | $180,137 | 364 | $137,712 | 967 | $176,597 | 63 | $73,683 | 20 | $644,300 | 136 | $139,331 | 2 | $112,500 |
| APPLICATIONS APPROVED, NOT ACCEPTED | 45 | $160,978 | 43 | $124,651 | 120 | $189,817 | 10 | $56,800 | 1 | $225,000 | 21 | $112,238 | 0 | $0 |
| APPLICATIONS DENIED | 141 | $170,163 | 134 | $122,612 | 634 | $199,009 | 81 | $67,395 | 0 | $0 | 85 | $135,647 | 2 | $152,000 |
| APPLICATIONS WITHDRAWN | 70 | $185,957 | 43 | $137,465 | 298 | $205,070 | 15 | $117,000 | 2 | $339,000 | 17 | $307,412 | 0 | $0 |
| FILES CLOSED FOR INCOMPLETENESS | 18 | $177,000 | 27 | $145,704 | 121 | $195,322 | 9 | $64,889 | 2 | $358,500 | 15 | $180,800 | 0 | $0 |
Detailed mortgage data for all 21 tracts in Brockton, MA
| Private Mortgage Insurance Companies Aggregated Statistics For Year 2009 (Based on 20 full tracts) | ||||||
| A) Conventional Home Purchase Loans | B) Refinancings | C) Non-occupant Loans on < 5 Family Dwellings (A & B) | ||||
|---|---|---|---|---|---|---|
| Number | Average Value | Number | Average Value | Number | Average Value | |
| LOANS ORIGINATED | 34 | $156,059 | 17 | $202,941 | 1 | $146,000 |
| APPLICATIONS APPROVED, NOT ACCEPTED | 17 | $185,706 | 13 | $230,385 | 0 | $0 |
| APPLICATIONS DENIED | 11 | $136,909 | 4 | $190,000 | 0 | $0 |
| APPLICATIONS WITHDRAWN | 4 | $148,250 | 1 | $192,000 | 0 | $0 |
| FILES CLOSED FOR INCOMPLETENESS | 1 | $143,000 | 2 | $230,000 | 0 | $0 |
2002 - 2018 National Fire Incident Reporting System (NFIRS) incidents
- Fire incident types reported to NFIRS in Brockton, MA
- 3,56855.3%Structure Fires
- 1,68926.2%Outside Fires
- 87413.5%Mobile Property/Vehicle Fires
- 3215.0%Other
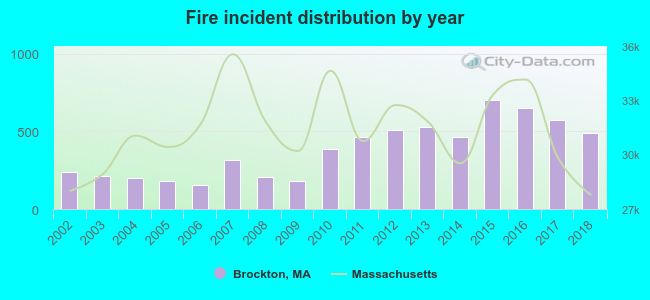 Based on the data from the years 2002 - 2018 the average number of fire incidents per year is 380. The highest number of fires - 701 took place in 2015, and the least - 153 in 2006. The data has an increasing trend.
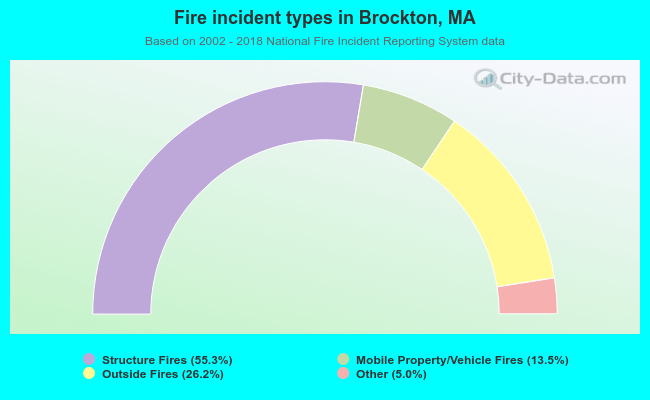 When looking into fire subcategories, the most incidents belonged to: Structure Fires (55.3%), and Outside Fires (26.2%).
Fire-safe hotels and motels in Brockton, Massachusetts:
- Bestern Carlton House, 1005 Belmont St, Brockton, Massachusetts 02301 , Phone: (508) 588-3333, Fax: (508) 588-3333
- Holiday Inn Express Boston Brockton, 405 Westgate Dr, Brockton, Massachusetts 02301 , Phone: (508) 588-6300, Fax: (508) 580-4384
- Country Inn & Suites By Carlson, 50 Christy's Dr, Brockton, Massachusetts 02301 , Phone: (508) 559-0099, Fax: (508) 559-0094
| Most common first names in Brockton, MA among deceased individuals | ||
| Name | Count | Lived (average) |
|---|---|---|
| Mary | 1,078 | 80.5 years |
| John | 1,020 | 73.6 years |
| Joseph | 618 | 74.8 years |
| William | 570 | 72.6 years |
| James | 477 | 69.6 years |
| George | 461 | 74.3 years |
| Robert | 458 | 66.4 years |
| Helen | 398 | 79.8 years |
| Margaret | 392 | 79.6 years |
| Edward | 340 | 72.0 years |
| Most common last names in Brockton, MA among deceased individuals | ||
| Last name | Count | Lived (average) |
|---|---|---|
| Johnson | 227 | 77.2 years |
| Smith | 201 | 77.1 years |
| Murphy | 174 | 74.8 years |
| Anderson | 137 | 78.0 years |
| Sullivan | 129 | 75.7 years |
| Brown | 92 | 76.0 years |
| Williams | 90 | 72.9 years |
| Nelson | 80 | 78.7 years |
| Burke | 78 | 79.0 years |
| Martin | 70 | 77.0 years |
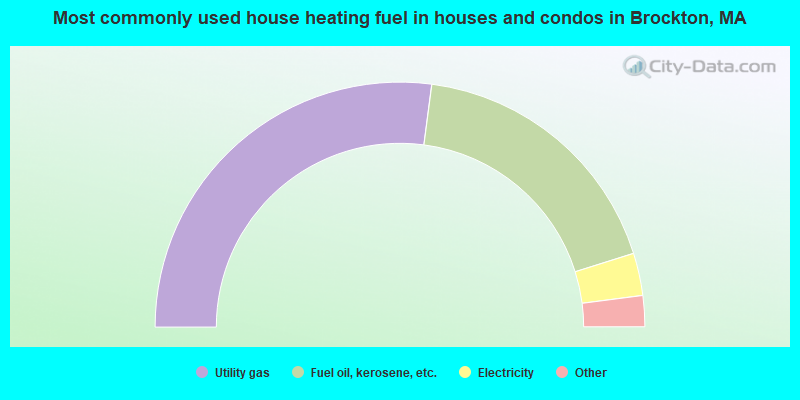
- 54.1%Utility gas
- 36.1%Fuel oil, kerosene, etc.
- 5.6%Electricity
- 2.5%Bottled, tank, or LP gas
- 0.7%Wood
- 0.6%Other fuel
- 0.3%No fuel used
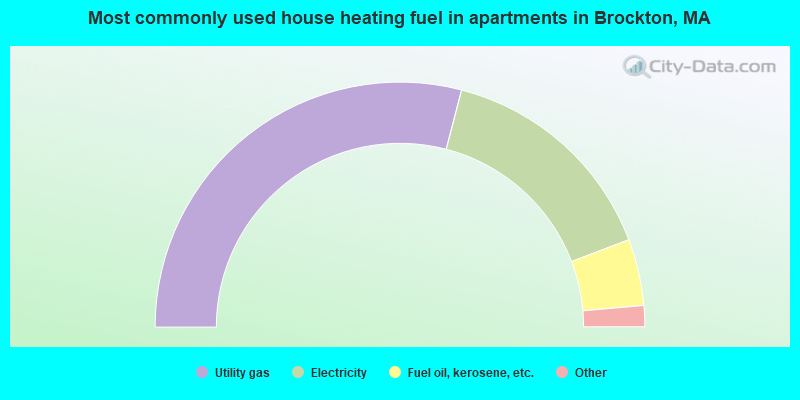
- 58.1%Utility gas
- 30.3%Electricity
- 8.8%Fuel oil, kerosene, etc.
- 1.7%Bottled, tank, or LP gas
- 1.1%No fuel used
Brockton compared to Massachusetts state average:
- Unemployed percentage below state average.
- Black race population percentage significantly above state average.
- Foreign-born population percentage above state average.
Brockton on our top lists:
- #2 on the list of "Top 101 cities with the highest average wind speeds (population 50,000+)"
- #3 on the list of "Top 101 cities with largest percentage of males in occupations: office and administrative support occupations (population 50,000+)"
- #4 on the list of "Top 101 cities with largest percentage of males in industries: health care and social assistance (population 50,000+)"
- #5 on the list of "Top 101 cities with the least people having professional degrees (population 50,000+)"
- #9 on the list of "Top 101 cities with the most residents born in Western Africa (population 500+)"
- #13 on the list of "Top 101 cities with the lowest percentage of workers working at home, population 50,000+"
- #18 on the list of "Top 101 cities with the highest number of assaults per 100,000 residents, excludes tourist destinations and others with a lot of outsiders visiting based on city industries data (population 50,000+)"
- #21 on the list of "Top 101 cities with largest percentage of females in occupations: healthcare support occupations (population 50,000+)"
- #22 on the list of "Top 101 cities with the smallest precipitation differences during a year (population 50,000+)"
- #23 on the list of "Top 101 cities with the smallest house values disparities (population 50,000+)"
- #26 on the list of "Top 101 cities with the lowest maximum monthly sunshine amount (population 50,000+)"
- #30 on the list of "Top 101 cities with the most residents born in Africa (population 500+)"
- #33 on the list of "Top 101 cities with largest percentage of females in occupations: sales and related occupations (population 50,000+)"
- #33 on the list of "Top 101 cities with the smallest racial income disparities between White and Black householders (with at least 2,000 householders)"
- #35 on the list of "Top 101 cities with largest percentage of females in industries: health care and social assistance (population 50,000+)"
- #43 on the list of "Top 101 cities with the most residents born in Haiti (population 500+)"
- #49 on the list of "Top 101 cities with largest percentage of males in occupations: health technologists and technicians (population 50,000+)"
- #53 on the list of "Top 101 cities with largest percentage of males in occupations: building and grounds cleaning and maintenance occupations (population 50,000+)"
- #54 on the list of "Top 101 cities with the smallest sunshine amount differences during a year (population 50,000+)"
- #55 on the list of "Top 101 cities with the highest percentage of single-parent households, population 50,000+"
- #18 on the list of "Top 101 counties with the highest percentage of residents that visited a dentist within the past year"
- #24 on the list of "Top 101 counties with the highest percentage of residents that smoked 100+ cigarettes in their lives"
- #35 on the list of "Top 101 counties with the largest decrease in the number of births per 1000 residents 2000-2006 to 2007-2013 (pop 50,000+)"
- #39 on the list of "Top 101 counties with the lowest percentage of residents that keep firearms around their homes"
- #39 on the list of "Top 101 counties with the lowest number of infant deaths per 1000 residents 2007-2013 (pop. 50,000+)"

|
|
Total of 105 patent applications in 2008-2024.