Estimated zip code population in 2022: 26,894 Zip code population in 2010: 26,956 Zip code population in 2000: 26,041
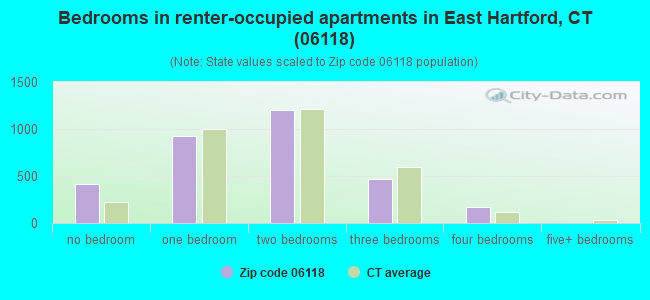
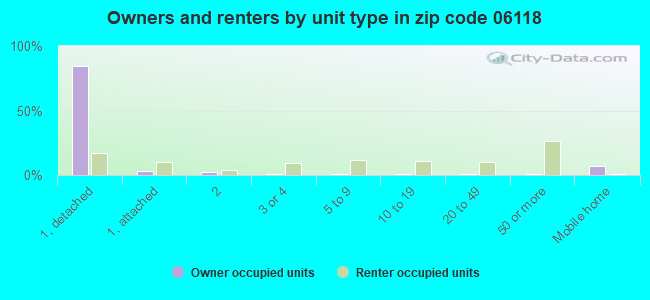
Houses and condos: 11,549 Renter-occupied apartments: 3,153
% of renters here:
29%
State:
34%
March 2022 cost of living index in zip code 06118: 103.3 (near average, U.S. average is 100)
Land area: 9.9 sq. mi. Water area: 0.3 sq. mi.
Population density: 2,715 people per square mile
(average).
OSM Map
Google Map
MSN Map
OSM Map
General Map
Google Map
MSN Map
OSM Map
Google Map
MSN Map
OSM Map
Google Map
MSN Map
Please wait while loading the map...
Real estate property taxes paid for housing units in 2022:
This zip code:
2.5% ($5,308)
Connecticut:
1.8% ($6,189)
Median real estate property taxes paid for housing units with mortgages in 2022: $5,352 (2.4%) Median real estate property taxes paid for housing units with no mortgage in 2022: $5,193 (2.6%)
Averages for the 2020 tax year for zip code 06118, filed in 2021:
Average Adjusted Gross Income (AGI) in 2020: $51,573 (Individual Income Tax Returns)
Here:
$51,573
State:
$105,931
Salary/wage: $46,685 (reported on 84.4% of returns)
Here:
$46,685
State:
$83,540
(% of AGI for various income ranges: 1081.9% for AGIs below $25k, 3460.1% for AGIs $25k-50k, 6301.6% for AGIs $50k-75k, 8770.5% for AGIs $75k-100k, 16098.1% for AGIs $100k-200k, 45888.6% for AGIs over 200k)
Taxable interest for individuals: $909 (reported on 20.9% of returns)
This zip code:
$909
Connecticut:
$3,402
(% of AGI for various income ranges: 11.3% for AGIs below $25k, 12.3% for AGIs $25k-50k, 18.9% for AGIs $50k-75k, 40.0% for AGIs $75k-100k, 75.6% for AGIs $100k-200k, 530.0% for AGIs over 200k)
Ordinary dividends: $3,334 (reported on 11.6% of returns)
Here:
$3,334
State:
$12,683
(% of AGI for various income ranges: 11.1% for AGIs below $25k, 14.6% for AGIs $25k-50k, 32.3% for AGIs $50k-75k, 62.0% for AGIs $75k-100k, 191.2% for AGIs $100k-200k, 2237.1% for AGIs over 200k)
Net capital gain/loss in AGI: +$6,027 (reported on 9.5% of returns)
Here:
+$6,027
State:
+$44,158
(% of AGI for various income ranges: 1.8% for AGIs below $25k, 10.7% for AGIs $25k-50k, 31.9% for AGIs $50k-75k, 88.6% for AGIs $75k-100k, 310.7% for AGIs $100k-200k, 4767.1% for AGIs over 200k)
Profit/loss from business: +$7,425 (reported on 12.0% of returns)
Here:
+$7,425
State:
+$22,988
(% of AGI for various income ranges: 74.2% for AGIs below $25k, 71.5% for AGIs $25k-50k, 77.1% for AGIs $50k-75k, 88.2% for AGIs $75k-100k, 384.1% for AGIs $100k-200k, 2137.1% for AGIs over 200k)
Taxable individual retirement arrangement distribution: $12,953 (reported on 7.3% of returns)
06118:
$12,953
Connecticut:
$22,031
(% of AGI for various income ranges: 42.4% for AGIs below $25k, 59.0% for AGIs $25k-50k, 109.7% for AGIs $50k-75k, 189.6% for AGIs $75k-100k, 462.1% for AGIs $100k-200k, 2117.1% for AGIs over 200k)
Self-employed (Keogh) retirement plans: $13,033 (reported on 0.2% of returns)
06118:
$13,033
Connecticut:
$29,016
(% of AGI for various income ranges: 35.5% for AGIs $75k-100k)
Total itemized deductions: $22,875 (reported on 8.8% of returns)
Here:
$22,875
State:
$37,613
(% of AGI for various income ranges: 41.1% for AGIs below $25k, 115.3% for AGIs $25k-50k, 379.3% for AGIs $50k-75k, 638.5% for AGIs $75k-100k, 830.8% for AGIs $100k-200k, 1678.6% for AGIs over 200k)
Charity contributions: $5,025 (reported on 6.5% of returns)
Here:
$5,025
State:
$13,557
(% of AGI for various income ranges: 1.9% for AGIs below $25k, 13.2% for AGIs $25k-50k, 48.8% for AGIs $50k-75k, 87.5% for AGIs $75k-100k, 200.2% for AGIs $100k-200k, 521.4% for AGIs over 200k)
Taxes paid: $8,553 (reported on 8.8% of returns)
06118:
$8,553
State:
$9,096
(% of AGI for various income ranges: 10.9% for AGIs below $25k, 39.1% for AGIs $25k-50k, 157.0% for AGIs $50k-75k, 260.5% for AGIs $75k-100k, 292.3% for AGIs $100k-200k, 417.1% for AGIs over 200k)
Earned income credit: $2,114 (reported on 17.1% of returns)
Here:
$2,114
State:
$2,059
(% of AGI for various income ranges: 86.3% for AGIs below $25k, 59.6% for AGIs $25k-50k, 0.6% for AGIs $50k-75k)
Percentage of individuals using paid preparers for their 2020 taxes: 93.2%
Here:
93%
State:
93%
(% for various income ranges: 92.3% for AGIs below $25k, 94.3% for AGIs $25k-50k, 93.4% for AGIs $50k-75k, 93.1% for AGIs $75k-100k, 93.0% for AGIs $100k-200k, 88.9% for AGIs over 200k)
Averages for the 2012 tax year for zip code 06118, filed in 2013:
Average Adjusted Gross Income (AGI) in 2012: $46,238 (Individual Income Tax Returns)
Here:
$46,238
State:
$93,290
Salary/wage: $42,758 (reported on 83.9% of returns)
Here:
$42,758
State:
$73,117
(% of AGI for various income ranges: 70.4% for AGIs below $25k, 81.5% for AGIs $25k-50k, 79.6% for AGIs $50k-75k, 79.2% for AGIs $75k-100k, 77.6% for AGIs $100k-200k, 59.1% for AGIs over 200k)
Taxable interest for individuals: $702 (reported on 38.5% of returns)
This zip code:
$702
Connecticut:
$2,530
(% of AGI for various income ranges: 1.0% for AGIs below $25k, 0.4% for AGIs $25k-50k, 0.6% for AGIs $50k-75k, 0.4% for AGIs $75k-100k, 0.7% for AGIs $100k-200k, 0.9% for AGIs over 200k)
Ordinary dividends: $2,686 (reported on 15.5% of returns)
Here:
$2,686
State:
$10,909
(% of AGI for various income ranges: 1.5% for AGIs below $25k, 0.5% for AGIs $25k-50k, 0.6% for AGIs $50k-75k, 0.8% for AGIs $75k-100k, 1.0% for AGIs $100k-200k, 2.7% for AGIs over 200k)
Net capital gain/loss in AGI: +$2,166 (reported on 9.9% of returns)
Here:
+$2,166
State:
+$34,090
(% of AGI for various income ranges: 0.1% for AGIs $25k-50k, 0.1% for AGIs $50k-75k, 0.2% for AGIs $75k-100k, 1.1% for AGIs $100k-200k, 3.3% for AGIs over 200k)
Profit/loss from business: +$9,333 (reported on 9.8% of returns)
Here:
+$9,333
State:
+$22,741
(% of AGI for various income ranges: 5.7% for AGIs below $25k, 1.7% for AGIs $25k-50k, 1.2% for AGIs $50k-75k, 1.0% for AGIs $75k-100k, 2.5% for AGIs $100k-200k)
Taxable individual retirement arrangement distribution: $10,351 (reported on 9.9% of returns)
06118:
$10,351
Connecticut:
$19,976
(% of AGI for various income ranges: 3.2% for AGIs below $25k, 1.7% for AGIs $25k-50k, 2.0% for AGIs $50k-75k, 1.8% for AGIs $75k-100k, 2.5% for AGIs $100k-200k, 3.4% for AGIs over 200k)
Self-employment retirement plans: $9,300 (reported on 0.2% of returns)
06118:
$9,300
Connecticut:
$24,004
Total itemized deductions: $18,404 (24% of AGI, reported on 37.3% of returns)
Here:
$18,404
State:
$33,239
Here:
24.5% of AGI
State:
18.9% of AGI
(% of AGI for various income ranges: 9.8% for AGIs below $25k, 11.6% for AGIs $25k-50k, 16.9% for AGIs $50k-75k, 17.5% for AGIs $75k-100k, 16.3% for AGIs $100k-200k, 13.9% for AGIs over 200k)
Charity contributions: $2,047 (reported on 28.7% of returns)
Here:
$2,047
State:
$4,947
(% of AGI for various income ranges: 0.6% for AGIs below $25k, 0.9% for AGIs $25k-50k, 1.3% for AGIs $50k-75k, 1.5% for AGIs $75k-100k, 1.6% for AGIs $100k-200k, 1.9% for AGIs over 200k)
Taxes paid: $8,640 (reported on 37.2% of returns)
06118:
$8,640
State:
$17,397
(% of AGI for various income ranges: 4.6% for AGIs below $25k, 4.5% for AGIs $25k-50k, 7.4% for AGIs $50k-75k, 8.3% for AGIs $75k-100k, 8.7% for AGIs $100k-200k, 8.0% for AGIs over 200k)
Earned income credit: $2,057 (reported on 17.8% of returns)
Here:
$2,057
State:
$2,053
(% of AGI for various income ranges: 5.9% for AGIs below $25k, 0.9% for AGIs $25k-50k)
Percentage of individuals using paid preparers for their 2012 taxes: 49.8%
Here:
50%
State:
55%
(% for various income ranges: 45.0% for AGIs below $25k, 49.2% for AGIs $25k-50k, 54.3% for AGIs $50k-75k, 54.9% for AGIs $75k-100k, 56.9% for AGIs $100k-200k, 60.0% for AGIs over 200k)
Averages for the 2004 tax year for zip code 06118, filed in 2005:
Average Adjusted Gross Income (AGI) in 2004: $40,608 (Individual Income Tax Returns)
Here:
$40,608
State:
$73,265
Salary/wage: $38,556 (reported on 83.8% of returns)
Here:
$38,556
State:
$62,030
(% of AGI for various income ranges: 87.8% for AGIs below $10k, 72.6% for AGIs $10k-25k, 82.8% for AGIs $25k-50k, 79.8% for AGIs $50k-75k, 82.9% for AGIs $75k-100k, 74.1% for AGIs over 100k)
Taxable interest for individuals: $1,011 (reported on 52.6% of returns)
This zip code:
$1,011
Connecticut:
$2,287
(% of AGI for various income ranges: 4.0% for AGIs below $10k, 2.4% for AGIs $10k-25k, 1.2% for AGIs $25k-50k, 1.1% for AGIs $50k-75k, 0.9% for AGIs $75k-100k, 1.3% for AGIs over 100k)
Taxable dividends: $1,756 (reported on 21.6% of returns)
Here:
$1,756
State:
$5,735
(% of AGI for various income ranges: 2.1% for AGIs below $10k, 1.0% for AGIs $10k-25k, 0.6% for AGIs $25k-50k, 1.0% for AGIs $50k-75k, 0.7% for AGIs $75k-100k, 1.4% for AGIs over 100k)
Net capital gain/loss: +$4,596 (reported on 14.4% of returns)
Here:
+$4,596
State:
+$23,694
(% of AGI for various income ranges: 2.5% for AGIs below $10k, 0.2% for AGIs $10k-25k, 0.3% for AGIs $25k-50k, 0.7% for AGIs $50k-75k, 1.2% for AGIs $75k-100k, 5.7% for AGIs over 100k)
Profit/loss from business: +$8,369 (reported on 10.2% of returns)
Here:
+$8,369
State:
+$20,783
(% of AGI for various income ranges: 2.8% for AGIs below $10k, 3.0% for AGIs $10k-25k, 1.9% for AGIs $25k-50k, 1.6% for AGIs $50k-75k, 1.6% for AGIs $75k-100k, 3.0% for AGIs over 100k)
IRA payment deduction: $2,981 (reported on 2.0% of returns)
06118:
$2,981
Connecticut:
$3,216
(% of AGI for various income ranges: 0.2% for AGIs $10k-25k, 0.2% for AGIs $25k-50k, 0.2% for AGIs $50k-75k, 0.1% for AGIs $75k-100k, 0.1% for AGIs over 100k)
Self-employed pension: $6,636 (reported on 0.4% of returns)
Here:
$6,636
Connecticut:
$17,335
(% of AGI for various income ranges: 0.5% for AGIs below $10k, 0.1% for AGIs $50k-75k, 0.2% for AGIs over 100k)
Total itemized deductions: $15,883 (25% of AGI, reported on 38.3% of returns)
Here:
$15,883
State:
$24,919
Here:
24.8% of AGI
State:
18.6% of AGI
(% of AGI for various income ranges: 13.0% for AGIs below $10k, 10.8% for AGIs $10k-25k, 15.2% for AGIs $25k-50k, 15.8% for AGIs $50k-75k, 16.3% for AGIs $75k-100k, 14.9% for AGIs over 100k)
Charity contributions deductions: $1,915 (3% of AGI, reported on 33.5% of returns)
Here:
$1,915
State:
$3,762
Here:
2.9% of AGI
State:
2.7% of AGI
(% of AGI for various income ranges: 0.5% for AGIs below $10k, 0.8% for AGIs $10k-25k, 1.2% for AGIs $25k-50k, 1.7% for AGIs $50k-75k, 1.9% for AGIs $75k-100k, 2.2% for AGIs over 100k)
Total tax: $4,967 (reported on 78.2% of returns)
06118:
$4,967
State:
$15,148
(% of AGI for various income ranges: 2.2% for AGIs below $10k, 4.1% for AGIs $10k-25k, 7.3% for AGIs $25k-50k, 9.6% for AGIs $50k-75k, 10.7% for AGIs $75k-100k, 15.4% for AGIs over 100k)
Earned income credit: $1,561 (reported on 13.0% of returns)
Here:
$1,561
State:
$1,570
Percentage of individuals using paid preparers for their 2004 taxes: 55.1%
Here:
55%
State:
59%
(% for various income ranges: 46.9% for AGIs below $10k, 57.0% for AGIs $10k-25k, 55.3% for AGIs $25k-50k, 57.3% for AGIs $50k-75k, 59.2% for AGIs $75k-100k, 58.5% for AGIs over 100k)
Likely homosexual households (counted as self-reported same-sex unmarried-partner households)
Lesbian couples: 0.1% of all households
Gay men: 0.0% of all households
Household received Food Stamps/SNAP in the past 12 months: 1,653 Household did not receive Food Stamps/SNAP in the past 12 months: 9,336
Women who had a birth in the past 12 months: 490 (197 now married, 314 unmarried) Women who did not have a birth in the past 12 months: 6,070 (2,118 now married, 3,960 unmarried)
Housing units in zip code 06118 with a mortgage: 5,290 (476 second mortgage, 15 home equity loan, 192 both second mortgage and home equity loan) Houses without a mortgage: 172
Median monthly owner costs for units with a mortgage: $1,684 Median monthly owner costs for units without a mortgage: $877
Residents with income below the poverty level in 2022:
This zip code:
10.5%
Whole state:
9.8%
Residents with income below 50% of the poverty level in 2022:
This zip code:
5.7%
Whole state:
4.8%
Median number of rooms in houses and condos:
Here:
5.9
State:
6.5
Median number of rooms in apartments:
Here:
3.9
State:
4.0
Notable locations in this zip code not listed on our city pages
Notable locations in zip code 06118: Hale Music Shell (A), South End Senior Citizens Center (B), Penney Memorial Library (C), Hockanum Branch Library (D), Pratt and Whitney Fire Department (E), East Hartford Fire Department Station 6 (F), East Hartford Fire Department Station 5 (G). Display/hide their locations on the map
Shopping Centers: Silver Lane Plaza Shopping Center (1), Somerset Square Shopping Center (2), Charter Oak Mall Shopping Center (3), 467 Main Street Shopping Center (4), East Hartford Shopping Center (5). Display/hide their locations on the map
Churches in zip code 06118 include: Faith Church (A), Saint Christophers Church (B), Temple Beth Tefilah (C), Our Lady of Peace Church (D). Display/hide their locations on the map
Parks in zip code 06118 include: Elizabeth Shea Park (1), Doctor Richard E Gorman Park (2), Goodwin Playground (3), Hockanum Park (4), Nicholas Forum Park (5), Veterans Memorial Park (6), Keeney Cove Marsh State Wildlife Area (7). Display/hide their locations on the map
In group quarters: 146 (-1 institutionalized population)
Size of family households: 2,800 2-persons, 2,255 3-persons, 1,130 4-persons, 609 5-persons, 207 6-persons, 84 7-or-more-persons
Size of nonfamily households: 3,181 1-person, 650 2-persons, 33 3-persons
2,554 married couples with children.
2,387 single-parent households (430 men, 1,957 women).
64.6% of residents of 06118 zip code speak English at home.
24.3% of residents speak Spanish at home (76% very well, 6% well, 11% not well, 7% not at all).
7.3% of residents speak other Indo-European language at home (64% very well, 20% well, 10% not well, 7% not at all).
2.5% of residents speak Asian or Pacific Island language at home (41% very well, 24% well, 20% not well, 15% not at all).
2.1% of residents speak other language at home (80% very well, 12% well, 7% not well).
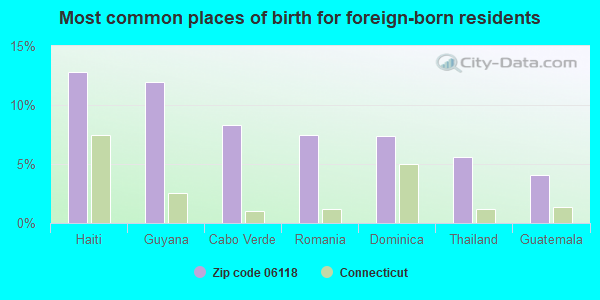
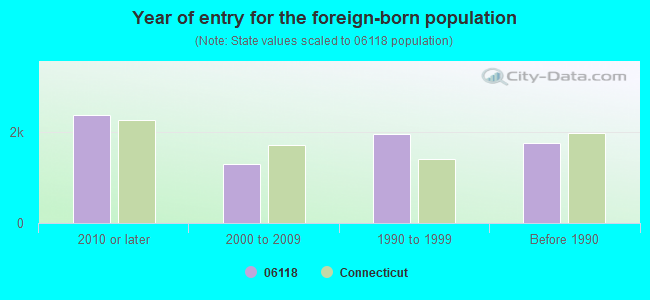
Foreign born population: 4,957 (18.4%) (64.8% of them are naturalized citizens)
Facilities with environmental interests located in this zip code:
GOVERNOR WILLIAM PITKIN SCHOOL (330 HILLS STREET in EAST HARTFORD, CT)
(Geographic Names Information System) (National Center for Education Statistics) - STATE ID-20 Organizations: EAST HARTFORD SCHOOL DISTRICT (SCHOOL DISTRICT)
Alternative names: GOVERNOR WM. PITKIN SCHOOL
HOCKANUM SCHOOL (191 MAIN STREET in EAST HARTFORD, CT)
AIR MONITORING SITE (Airborne pollution emission tracking) (National Center for Education Statistics) - STATE ID-5 Organizations: EAST HARTFORD SCHOOL DISTRICT (SCHOOL DISTRICT)
DR. THOMAS S. O'CONNELL SCHOOL (301 MAY ROAD in EAST HARTFORD, CT)
(National Center for Education Statistics) - STATE ID-10 Organizations: EAST HARTFORD SCHOOL DISTRICT (SCHOOL DISTRICT)
EAST HARTFORD/GLASTONBURY ELEMENTARY MAGNET SCHOOL (305 MAY ROAD in EAST HARTFORD, CT)
(National Center for Education Statistics) - STATE ID-1 Organizations: CAPITOL REGION EDUCATION COUNCIL (SCHOOL DISTRICT)
CONNECTICUT LIGHT & POWER CO POLE #75 (19 SAUNDERS ST in E HARTFORD, CT)
(Integrated Compliance Information System) - ICIS-01-2000-0211, FORMAL ENFORCEMENT ACTION
COMPONENT FINISHING INC (339 MAIN ST. in E HARTFORD, CT)
(Resource Conservation and Recovery Act (tracking hazardous waste)) TRI REPORTER (Tracking of toxic chemicals releasing facilities) Business SIC classification: ELECTROPLATING, PLATING, POLISHING, ANODIZING, AND COLORING Organizations: VIGGIANO ANTHONY,FRED & DAVID (CONTACT/OWNER)
Alternative names: COMPONENT FINISHING (E. HARTFO, COMPONENTS FINISHING INC
EXXON CO USA 38471 (2 SILVER LN in EAST HARTFORD, CT)
AIR MINOR (AIRS/AFS) Business SIC classification: NONCLASSIFIABLE ESTABLISHMENTS
FIVE STAR CLNRS (832 SILVER LN in EAST HARTFORD, CT)
Small Quantity Generators, between 100 kg and 1000 kg of hazardous waste/month (Resource Conservation and Recovery Act (tracking hazardous waste)) - notification Organizations: DINESH PATEL (CONTACT/OWNER)
GOV. WILLIAM PITKIN (330 HILL ST. in EAST HARTFORD, CT)
COMPLIANCE ACTIVITY (Tracking inspections of insecticide, fungicide, and rodenticide, and toxic substances)
Housing units lacking complete plumbing facilities: 1.5% Housing units lacking complete kitchen facilities: 0.9%
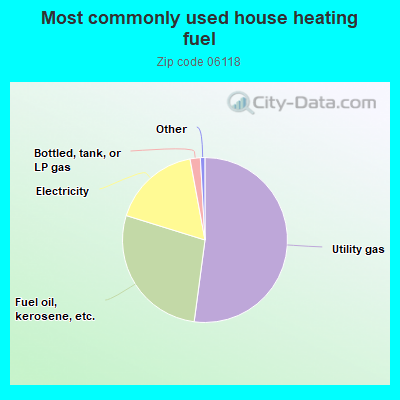
52.1%Utility gas
27.7%Fuel oil, kerosene, etc.
17.3%Electricity
2.0%Bottled, tank, or LP gas
Population in 1990: 26,754.
Place of birth for U.S.-born residents:
This state: 14,872
Northeast: 2,600
Midwest: 551
South: 1,177
West: 307
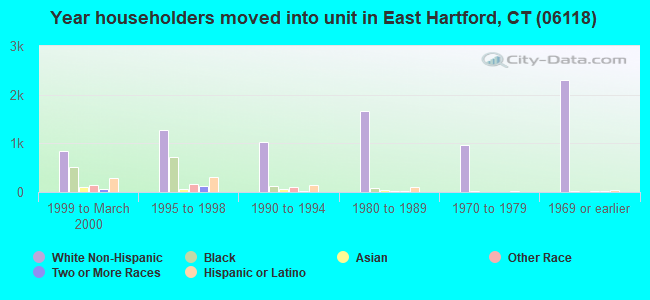
64% of the 06118 zip code residents lived in the same house 5 years ago. Out of people who lived in different houses, 81% lived in this county. Out of people who lived in different counties, 50% lived in Connecticut.
92% of the 06118 zip code residents lived in the same house 1 year ago. Out of people who lived in different houses, 48% moved from this county. Out of people who lived in different houses, 9% moved from different county within same state. Out of people who lived in different houses, 16% moved from different state. Out of people who lived in different houses, 23% moved from abroad.
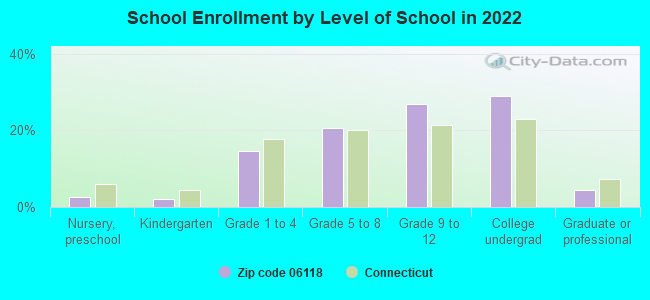
Private vs. public school enrollment:
Students in private schools in grades 1 to 8 (elementary and middle school): 236
Here:
10.3%
Connecticut:
9.5%
Students in private schools in grades 9 to 12 (high school): 14
Here:
0.8%
Connecticut:
12.9%
Students in private undergraduate colleges: 375
Here:
20.2%
Connecticut:
35.5%
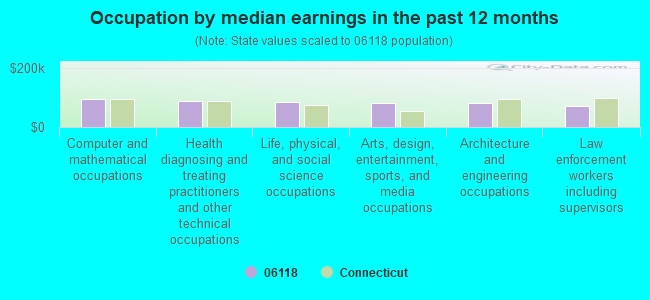
Occupation by median earnings in the past 12 months ($)
92,663Computer and mathematical occupations
88,171Health diagnosing and treating practitioners and other technical occupations
83,725Life, physical, and social science occupations
82,373Arts, design, entertainment, sports, and media occupations
81,840Architecture and engineering occupations
70,775Law enforcement workers including supervisors
Companies with federal contracts located in this zip code (EAST HARTFORD, CT):
UNITED TECHNOLOGIES CORPORATIO (400 MAIN STREET) : $594,102,722 in 911 contractsfrom 1999 to 2006
Contracts for Gas Turbines and Jet Engines, Non-Aircraft; and Components, Gas Turbines and Jet Engines, Aircraft; Prime Moving, and Components, Aeronautics and Space Technology -- Basic Research (R&D), Maintenance, Repair and Rebuilding of Equipment -- Engines, Turbines, and Components, and moreby Navy, Air Force, NASA, Defense Logistics Agency, and others Signed by year:2000: -$2,157,707; 2001: $8,906,290; 2002: $2,383,598; 2003: $211,663,326; 2004: $11,100,843; 2005: $309,121,886; 2006: $52,984,641.
Biggest contracts:
$206,664,729 with Navy for Gas Turbines and Jet Engines, Non-Aircraft; and Components. Signed on 2003-05-06. Completion date: 2003-09-30.
$39,950,925 with Air Force for Gas Turbines and Jet Engines, Aircraft; Prime Moving, and Components. Signed on 2005-09-30. Completion date: 2007-12-31.
$32,459,238, same as above.Signed on 2005-01-10. Completion date: 2006-12-31.
$27,976,401, same as above.Signed on 2005-09-30. Completion date: 2007-12-31.
CABRERA SERVICES, INC (473 SILVER LANE; small business) : $60,224,383 in 371 contractsfrom 2000 to 2006
Contracts for Architect - Engineer Services (including landscaping, interior layout, and designing), Other Architect and Engineering Services, Demolition of Structures or Facilities (Other than Buildings), Development of Environmental Impact Statements and Assessments, and moreby Air Force, Army, U.S. Army Corps of Engineers - civil program financing only, Navy, and others Signed by year:2000: $3,193,974; 2001: $3,485,257; 2002: $7,410,545; 2003: $7,360,716; 2004: $13,018,794; 2005: $19,471,758; 2006: $6,283,339.
Biggest contracts:
$2,769,197 with Air Force for Architect - Engineer Services (including landscaping, interior layout, and designing). Taking place in CA. Signed on 2005-07-06. Completion date: 2006-07-31.
$2,754,579, same as above.Signed on 2005-06-24. Completion date: 2006-11-30.
$2,075,086 with Army for Other Architect and Engineering Services. Taking place in MD. Signed on 2004-09-30. Completion date: 2004-09-27.
$1,442,893 with Army for Demolition of Structures or Facilities (Other than Buildings). Signed on 2005-04-22. Completion date: 2009-09-28.
UNITED TECHNOLOGIES CORPORATIO (411 SILVER LN) : $17,361,596 in 71 contractsfrom 1999 to 2006
Contracts for Defense Ships -- Basic Research (R&D), Other Sciences Not Elsewhere Classified -- Operational Systems Development (R&D), Coal -- Engineering Development (R&D), Other Defense -- Advanced Development (R&D), and moreby Navy, Army, ENERGY, Department of, NASA, and others Signed by year:2000: $3,309,312; 2001: $2,387,451; 2002: $1,809,968; 2003: $2,272,844; 2004: $1,610,613; 2005: $2,985,811; 2006: $1,598,997.
Biggest contracts:
$1,499,434 with Navy for Defense Ships -- Basic Research (R&D). Signed on 2001-05-01. Completion date: 2002-09-30.
$1,412,063 with Army for Other Sciences Not Elsewhere Classified -- Operational Systems Development (R&D). Signed on 2005-06-29. Completion date: 2009-07-30.
$1,000,000 with ENERGY, Department of for Coal -- Engineering Development (R&D). Signed on 2000-01-15. Completion date: 2001-03-15.
$998,000 with Navy for Other Defense -- Advanced Development (R&D). Signed on 2004-05-27. Completion date: 2005-04-27.
RIVERA, DONNA (515 FORBES ST; small business) : $48,452 in 3 contractsfrom 2003 to 2004
$40,000 with Army for Other Social Services. Signed on 2003-02-03. Completion date: 2004-02-02.
$7,872, same as above.Signed on 2004-01-30. Completion date: 2004-02-02.
$580, same as above.Signed on 2003-08-04. Completion date: 2004-02-02.
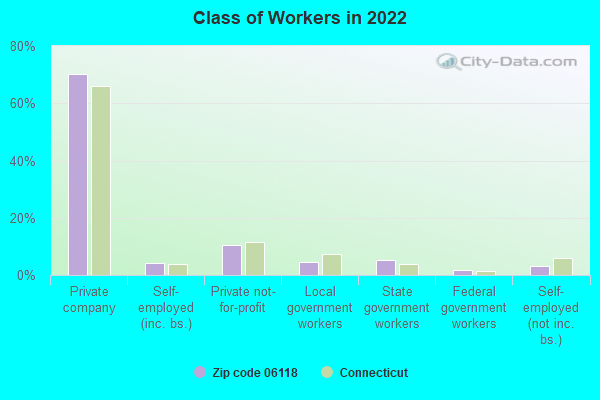
Top industries in this zip code by the number of employees in 2005:
Administrative and Support and Waste Management and Remediation Services: Janitorial Services (500-999 employees: 1 establishment, 1-4 employees: 4 establishments)
Health Care and Social Assistance: Offices of Physicians (except Mental Health Specialists) (100-249: 1, 10-19: 1, 5-9: 2, 1-4: 4)
Health Care and Social Assistance: Home Health Care Services (100-249: 1, 5-9: 1, 1-4: 1)
Other Services (except Public Administration): Commercial and Industrial Machinery and Equipment (except Automotive and Electronic) Repair and Maintenance (100-249: 1)
Administrative and Support and Waste Management and Remediation Services: Employment Placement Agencies (100-249: 1)
Management of Companies and Enterprises: Corporate, Subsidiary, and Regional Managing Offices (100-249: 1)
Health Care and Social Assistance: Nursing Care Facilities (100-249: 1)
People in group quarters in 2010:
130 people in nursing facilities/skilled-nursing facilities
81 people in other noninstitutional facilities
27 people in emergency and transitional shelters (with sleeping facilities) for people experiencing homelessness
19 people in group homes intended for adults
5 people in residential treatment centers for juveniles (non-correctional)
People in group quarters in 2000:
173 people in nursing homes
39 people in other noninstitutional group quarters
10 people in homes for the mentally retarded
2 people in religious group quarters
Fatal accident statistics in 2014:
Fatal accident count: 1
Vehicles involved in fatal accidents: 2
Fatal accidents caused by drunken drivers: 0
Fatalities: 1
Persons involved in fatal accidents: 2
Pedestrians involved in fatal accidents: 0
Fatal accident statistics in 2013:
Fatal accident count: 4
Vehicles involved in fatal accidents: 4
Fatal accidents caused by drunken drivers: 1
Fatalities: 5
Persons involved in fatal accidents: 10
Pedestrians involved in fatal accidents: 1
Home Mortgage Disclosure Act Aggregated Statistics For Year 2009 (Based on 7 full and 6 partial tracts)
A) FHA, FSA/RHS & VA Home Purchase Loans
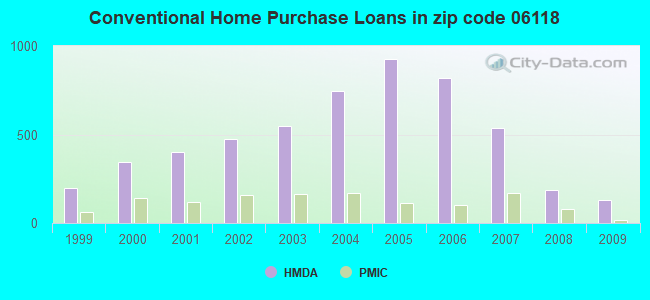
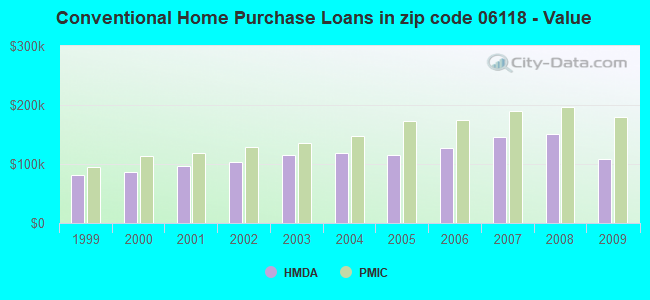
B) Conventional Home Purchase Loans
C) Refinancings
D) Home Improvement Loans
F) Non-occupant Loans on < 5 Family Dwellings (A B C & D)
G) Loans On Manufactured Home Dwelling (A B C & D)
Number
Average Value
Number
Average Value
Number
Average Value
Number
Average Value
Number
Average Value
Number
Average Value
LOANS ORIGINATED
364
$162,031
130
$108,826
659
$146,868
87
$42,252
25
$123,063
24
$26,852
APPLICATIONS APPROVED, NOT ACCEPTED
16
$171,946
15
$110,191
90
$157,899
18
$25,458
8
$136,910
3
$35,233
APPLICATIONS DENIED
78
$155,343
31
$92,509
425
$157,837
76
$49,162
13
$113,872
9
$52,561
APPLICATIONS WITHDRAWN
31
$157,999
23
$140,146
181
$173,550
10
$86,785
4
$116,988
0
$0
FILES CLOSED FOR INCOMPLETENESS
7
$145,851
9
$104,616
58
$169,712
4
$36,500
4
$132,480
2
$12,995
Aggregated Statistics For Year 2008 (Based on 7 full and 6 partial tracts)
A) FHA, FSA/RHS & VA Home Purchase Loans
B) Conventional Home Purchase Loans
C) Refinancings
D) Home Improvement Loans
E) Loans on Dwellings For 5+ Families
F) Non-occupant Loans on < 5 Family Dwellings (A B C & D)
G) Loans On Manufactured Home Dwelling (A B C & D)
Number
Average Value
Number
Average Value
Number
Average Value
Number
Average Value
Number
Average Value
Number
Average Value
Number
Average Value
LOANS ORIGINATED
235
$171,693
184
$150,959
499
$139,040
174
$31,253
0
$0
27
$136,001
16
$32,177
APPLICATIONS APPROVED, NOT ACCEPTED
14
$177,319
30
$142,143
113
$150,864
26
$65,798
0
$0
7
$200,130
10
$32,646
APPLICATIONS DENIED
42
$181,581
81
$119,004
576
$173,233
136
$24,243
5
$169,080
9
$142,020
17
$31,005
APPLICATIONS WITHDRAWN
17
$180,352
20
$132,043
178
$165,906
10
$78,705
0
$0
5
$157,216
2
$12,995
FILES CLOSED FOR INCOMPLETENESS
2
$178,480
12
$122,500
43
$142,037
5
$168,892
0
$0
0
$0
3
$25,023
Aggregated Statistics For Year 2007 (Based on 7 full and 6 partial tracts)
A) FHA, FSA/RHS & VA Home Purchase Loans
B) Conventional Home Purchase Loans
C) Refinancings
D) Home Improvement Loans
E) Loans on Dwellings For 5+ Families
F) Non-occupant Loans on < 5 Family Dwellings (A B C & D)
G) Loans On Manufactured Home Dwelling (A B C & D)
Number
Average Value
Number
Average Value
Number
Average Value
Number
Average Value
Number
Average Value
Number
Average Value
Number
Average Value
LOANS ORIGINATED
144
$184,538
537
$146,380
831
$133,516
287
$47,879
3
$497,097
47
$173,524
28
$56,155
APPLICATIONS APPROVED, NOT ACCEPTED
10
$184,637
67
$157,253
239
$156,896
51
$64,953
0
$0
6
$113,677
2
$53,715
APPLICATIONS DENIED
28
$188,834
193
$138,284
937
$156,099
221
$44,809
1
$7,500,000
38
$143,412
23
$44,529
APPLICATIONS WITHDRAWN
12
$162,502
38
$169,490
354
$150,319
39
$54,711
1
$7,600,000
12
$162,115
0
$0
FILES CLOSED FOR INCOMPLETENESS
2
$197,980
18
$148,568
65
$176,108
7
$89,490
0
$0
1
$84,550
2
$25,125
Aggregated Statistics For Year 2006 (Based on 7 full and 6 partial tracts)
A) FHA, FSA/RHS & VA Home Purchase Loans
B) Conventional Home Purchase Loans
C) Refinancings
D) Home Improvement Loans
E) Loans on Dwellings For 5+ Families
F) Non-occupant Loans on < 5 Family Dwellings (A B C & D)
G) Loans On Manufactured Home Dwelling (A B C & D)
Number
Average Value
Number
Average Value
Number
Average Value
Number
Average Value
Number
Average Value
Number
Average Value
Number
Average Value
LOANS ORIGINATED
166
$182,008
817
$126,704
1,169
$127,478
387
$52,864
5
$2,037,076
65
$106,920
18
$34,403
APPLICATIONS APPROVED, NOT ACCEPTED
11
$162,586
113
$130,158
288
$144,354
36
$44,180
0
$0
8
$72,364
1
$47,000
APPLICATIONS DENIED
17
$164,314
273
$128,243
845
$139,904
238
$53,050
3
$223,530
33
$110,242
9
$30,623
APPLICATIONS WITHDRAWN
6
$170,355
109
$119,950
649
$143,579
55
$47,184
2
$59,180
15
$122,308
2
$27,725
FILES CLOSED FOR INCOMPLETENESS
4
$203,312
39
$142,866
92
$179,961
18
$85,398
0
$0
2
$135,265
0
$0
Aggregated Statistics For Year 2005 (Based on 7 full and 6 partial tracts)
A) FHA, FSA/RHS & VA Home Purchase Loans
B) Conventional Home Purchase Loans
C) Refinancings
D) Home Improvement Loans
E) Loans on Dwellings For 5+ Families
F) Non-occupant Loans on < 5 Family Dwellings (A B C & D)
G) Loans On Manufactured Home Dwelling (A B C & D)
Number
Average Value
Number
Average Value
Number
Average Value
Number
Average Value
Number
Average Value
Number
Average Value
Number
Average Value
LOANS ORIGINATED
184
$164,653
925
$115,194
1,265
$126,177
321
$48,062
2
$3,025,000
58
$102,852
22
$48,531
APPLICATIONS APPROVED, NOT ACCEPTED
13
$175,842
106
$113,796
244
$130,609
52
$46,747
0
$0
12
$102,547
0
$0
APPLICATIONS DENIED
14
$178,139
260
$109,731
859
$138,143
283
$52,275
2
$77,775
25
$84,812
5
$44,892
APPLICATIONS WITHDRAWN
11
$165,108
197
$119,887
855
$138,386
66
$107,022
0
$0
39
$122,096
1
$15,000
FILES CLOSED FOR INCOMPLETENESS
0
$0
56
$117,941
92
$142,601
8
$55,238
0
$0
3
$56,360
0
$0
Aggregated Statistics For Year 2004 (Based on 7 full and 6 partial tracts)
A) FHA, FSA/RHS & VA Home Purchase Loans
B) Conventional Home Purchase Loans
C) Refinancings
D) Home Improvement Loans
E) Loans on Dwellings For 5+ Families
F) Non-occupant Loans on < 5 Family Dwellings (A B C & D)
G) Loans On Manufactured Home Dwelling (A B C & D)
Number
Average Value
Number
Average Value
Number
Average Value
Number
Average Value
Number
Average Value
Number
Average Value
Number
Average Value
LOANS ORIGINATED
153
$147,103
744
$117,830
1,376
$115,343
228
$43,574
5
$1,935,054
67
$107,434
11
$87,488
APPLICATIONS APPROVED, NOT ACCEPTED
8
$151,028
87
$110,926
305
$124,896
56
$52,382
0
$0
16
$100,839
4
$58,762
APPLICATIONS DENIED
21
$173,942
198
$109,437
770
$114,638
201
$36,492
2
$126,810
30
$109,910
25
$57,490
APPLICATIONS WITHDRAWN
15
$141,659
99
$120,342
904
$129,558
58
$56,572
0
$0
10
$89,660
2
$62,380
FILES CLOSED FOR INCOMPLETENESS
1
$142,000
15
$88,680
105
$133,051
10
$37,487
0
$0
2
$168,055
0
$0
Aggregated Statistics For Year 2003 (Based on 7 full and 6 partial tracts)
A) FHA, FSA/RHS & VA Home Purchase Loans
B) Conventional Home Purchase Loans
C) Refinancings
D) Home Improvement Loans
F) Non-occupant Loans on < 5 Family Dwellings (A B C & D)
Number
Average Value
Number
Average Value
Number
Average Value
Number
Average Value
Number
Average Value
LOANS ORIGINATED
227
$133,405
547
$115,911
2,269
$108,861
153
$28,375
63
$90,780
APPLICATIONS APPROVED, NOT ACCEPTED
15
$117,167
107
$122,936
377
$109,056
37
$39,925
11
$79,233
APPLICATIONS DENIED
19
$127,203
126
$102,785
891
$107,812
120
$30,430
29
$83,038
APPLICATIONS WITHDRAWN
16
$111,137
65
$123,262
698
$119,596
41
$38,765
24
$85,540
FILES CLOSED FOR INCOMPLETENESS
0
$0
22
$137,135
67
$117,516
3
$32,040
5
$93,828
Aggregated Statistics For Year 2002 (Based on 7 full and 6 partial tracts)
A) FHA, FSA/RHS & VA Home Purchase Loans
B) Conventional Home Purchase Loans
C) Refinancings
D) Home Improvement Loans
E) Loans on Dwellings For 5+ Families
F) Non-occupant Loans on < 5 Family Dwellings (A B C & D)
Number
Average Value
Number
Average Value
Number
Average Value
Number
Average Value
Number
Average Value
Number
Average Value
LOANS ORIGINATED
327
$115,640
473
$103,429
1,169
$100,151
145
$26,466
3
$167,953
48
$81,801
APPLICATIONS APPROVED, NOT ACCEPTED
12
$104,091
55
$115,848
225
$101,294
46
$22,385
0
$0
14
$72,626
APPLICATIONS DENIED
46
$114,849
99
$82,158
580
$93,533
124
$18,929
0
$0
16
$85,542
APPLICATIONS WITHDRAWN
11
$126,139
48
$96,172
383
$102,540
39
$28,143
0
$0
1
$105,000
FILES CLOSED FOR INCOMPLETENESS
4
$112,715
17
$106,699
75
$101,688
0
$0
0
$0
7
$92,587
Aggregated Statistics For Year 2001 (Based on 7 full and 6 partial tracts)
A) FHA, FSA/RHS & VA Home Purchase Loans
B) Conventional Home Purchase Loans
C) Refinancings
D) Home Improvement Loans
E) Loans on Dwellings For 5+ Families
F) Non-occupant Loans on < 5 Family Dwellings (A B C & D)
Number
Average Value
Number
Average Value
Number
Average Value
Number
Average Value
Number
Average Value
Number
Average Value
LOANS ORIGINATED
312
$110,646
402
$95,944
929
$95,353
172
$21,701
5
$2,048,904
57
$59,689
APPLICATIONS APPROVED, NOT ACCEPTED
14
$99,856
40
$81,662
125
$89,466
40
$19,560
0
$0
4
$51,148
APPLICATIONS DENIED
19
$116,935
86
$75,471
570
$77,076
154
$16,398
0
$0
16
$63,878
APPLICATIONS WITHDRAWN
19
$104,496
24
$93,078
281
$83,995
38
$29,209
2
$337,895
19
$83,939
FILES CLOSED FOR INCOMPLETENESS
1
$100,000
3
$106,353
75
$106,841
3
$10,637
0
$0
2
$88,000
Aggregated Statistics For Year 2000 (Based on 7 full and 6 partial tracts)
A) FHA, FSA/RHS & VA Home Purchase Loans
B) Conventional Home Purchase Loans
C) Refinancings
D) Home Improvement Loans
E) Loans on Dwellings For 5+ Families
F) Non-occupant Loans on < 5 Family Dwellings (A B C & D)
Number
Average Value
Number
Average Value
Number
Average Value
Number
Average Value
Number
Average Value
Number
Average Value
LOANS ORIGINATED
339
$99,884
347
$87,134
351
$67,212
161
$21,830
5
$6,050,922
25
$64,519
APPLICATIONS APPROVED, NOT ACCEPTED
20
$95,199
57
$95,523
60
$70,832
48
$21,325
0
$0
8
$50,872
APPLICATIONS DENIED
38
$100,086
111
$76,433
398
$70,130
166
$26,428
1
$4,000,000
9
$62,440
APPLICATIONS WITHDRAWN
10
$73,666
36
$95,978
139
$61,654
35
$39,738
0
$0
4
$110,738
FILES CLOSED FOR INCOMPLETENESS
4
$66,248
8
$72,074
115
$100,266
6
$66,333
0
$0
3
$69,777
Aggregated Statistics For Year 1999 (Based on 4 full and 3 partial tracts)
A) FHA, FSA/RHS & VA Home Purchase Loans
B) Conventional Home Purchase Loans
C) Refinancings
D) Home Improvement Loans
E) Loans on Dwellings For 5+ Families
F) Non-occupant Loans on < 5 Family Dwellings (A B C & D)
2002 - 2018 National Fire Incident Reporting System (NFIRS) incidents
According to the data from the years 2002 - 2018 the average number of fire incidents per year is 59. The highest number of reported fires - 85 took place in 2018, and the least - 34 in 2003. The data has a rising trend.
When looking into fire subcategories, the most reports belonged to: Structure Fires (40.0%), and Outside Fires (38.7%).
Fire incident types reported to NFIRS in Zip Code 06118


 Nearest zip codes: 06108, 06114, 06103, 06120, 06109, 06033.


 According to the data from the years 2002 - 2018 the average number of fire incidents per year is 59. The highest number of reported fires - 85 took place in 2018, and the least - 34 in 2003. The data has a rising trend.
 When looking into fire subcategories, the most reports belonged to: Structure Fires (40.0%), and Outside Fires (38.7%).