East Hartford, Connecticut
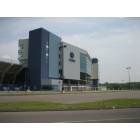
East Hartford: Rentschler Field

East Hartford: EAST HARTFORD, CT - FIRST CONGERGATIONAL CHURCH
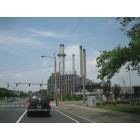
East Hartford: Pratt & Whitney along Main Street
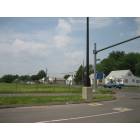
East Hartford: Silver Lane at the entrance to Rentschler Field
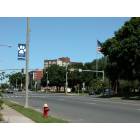
East Hartford: East Hartford-Downtown Main Street
East Hartford: East Hartford City Hall

East Hartford: East Hartford-Huskyville-Rentschler Stadium
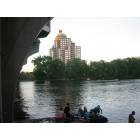
East Hartford: Riverpoint Condos from the Hartford side of the Connecticut River
- add
your
Submit your own pictures of this place and show them to the world
- OSM Map
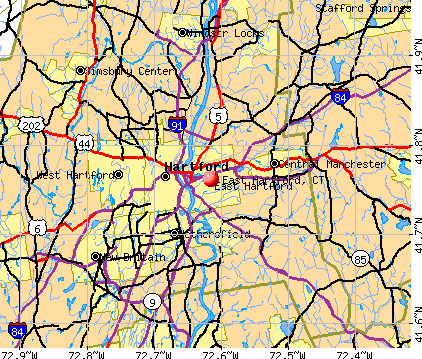
- General Map
- Google Map
- MSN Map
Population change since 2000: +3.4%
| Males: 25,124 | |
| Females: 26,128 |
| Median resident age: | 37.8 years |
| Connecticut median age: | 40.9 years |
Zip codes: 06042, 06108, 06118.
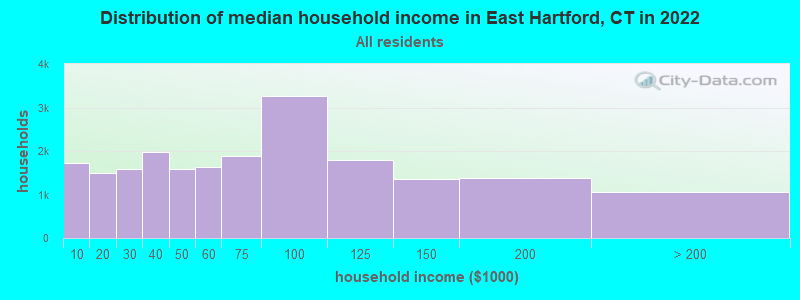
East Hartford Zip Code Map| East Hartford: | $62,974 |
| CT: | $88,429 |
Estimated per capita income in 2022: $32,244 (it was $21,763 in 2000)
East Hartford CDP income, earnings, and wages data
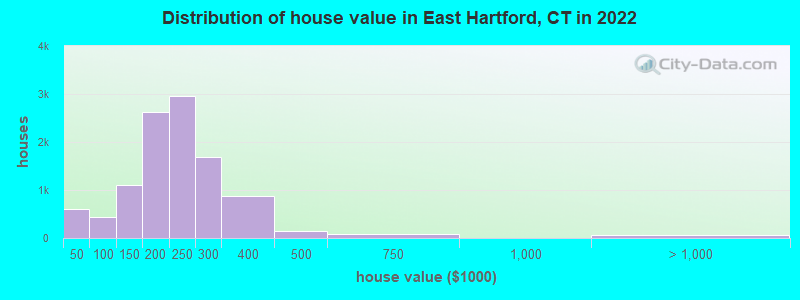
Estimated median house or condo value in 2022: $216,129 (it was $110,700 in 2000)
| East Hartford: | $216,129 |
| CT: | $347,200 |
Mean prices in 2022: all housing units: $218,310; detached houses: $232,416; townhouses or other attached units: $184,880; in 2-unit structures: $187,098; in 3-to-4-unit structures: $144,272; in 5-or-more-unit structures: $150,026; mobile homes: $127,161
Median gross rent in 2022: $1,151.
(11.3% for White Non-Hispanic residents, 14.6% for Black residents, 14.3% for Hispanic or Latino residents, 100.0% for Native Hawaiian and other Pacific Islander residents, 13.8% for other race residents, 9.7% for two or more races residents)
Detailed information about poverty and poor residents in East Hartford, CT


Compare current foreclosures in East Hartford, CT:
| Photo | Address | Area | Beds / Baths | Price | Details |
|---|---|---|---|---|---|

|
#1
Northbrook Ct # 9
East Hartford, CT 06108
|
1,130 sq. feet
|
2 baths 2 beds |
show details | |

|
#2
Ferncrest Dr
East Hartford, CT 06118
|
1,890 sq. feet
|
3 baths 4 beds |
show details | |

|
#3
Bell Ct Apt C1
East Hartford, CT 06108
|
890 sq. feet
|
1 baths 2 beds |
show details | |

|
#4
Hollister Dr
East Hartford, CT 06118
|
1,300 sq. feet
|
1 baths 3 beds |
show details | |

|
#5
Higbie Dr
East Hartford, CT 06108
|
1,081 sq. feet
|
2 baths 2 beds |
show details | |

|
#6
Whiting Rd
East Hartford, CT 06118
|
1,500 sq. feet
|
1 baths 3 beds |
show details | |

|
#7
Summerset Dr
East Hartford, CT 06118
|
1,869 sq. feet
|
2 baths 3 beds |
show details | |

|
#8
Park Ave
East Hartford, CT 06108
|
609 sq. feet
|
1 baths 1 beds |
show details | |

|
#9
Mulcahy Dr
East Hartford, CT 06118
|
1,703 sq. feet
|
1 baths 3 beds |
show details | |

|
#10
Northbrook C 9
East Hartford, CT 06108
|
1,130 sq. feet
|
1 baths 2 beds |
show details |
| Photo | Address | Area | Beds / Baths | Price | Details |
|---|---|---|---|---|---|

|
#11
Stanley St
East Hartford, CT 06108
|
1,262 sq. feet
|
1 baths 3 beds |
show details | |

|
#12
Hillcrest Rd
East Hartford, CT 06108
|
1,882 sq. feet
|
1 baths 4 beds |
show details | |

|
#13
Kenyon Pl
East Hartford, CT 06108
|
1,265 sq. feet
|
2 baths 3 beds |
show details | |

|
#14
Mckee St
East Hartford, CT 06108
|
1,480 sq. feet
|
1 baths 3 beds |
show details | |

|
#15
Taylor St
East Hartford, CT 06118
|
1,066 sq. feet
|
2 baths 3 beds |
show details | |

|
#16
Chester St
East Hartford, CT 06108
|
1,344 sq. feet
|
2 baths 3 beds |
show details | |

|
#17
Taylor St
East Hartford, CT 06118
|
1,510 sq. feet
|
2 baths 3 beds |
show details | |

|
#18
Leverich Dr
East Hartford, CT 06108
|
1,977 sq. feet
|
1 baths 3 beds |
show details | |

|
#19
Saunders St
East Hartford, CT 06108
|
1,870 sq. feet
|
3 baths 4 beds |
show details | |

|
#20
Forest St
East Hartford, CT 06118
|
1,040 sq. feet
|
2 baths 3 beds |
show details |
| Photo | Address | Area | Beds / Baths | Price | Details |
|---|---|---|---|---|---|

|
#21
Landers Rd
East Hartford, CT 06118
|
1,008 sq. feet
|
2 baths 3 beds |
show details | |

|
#22
Heron Rd
East Hartford, CT 06118
|
1,238 sq. feet
|
1 baths 3 beds |
show details | |

|
#23
Burnham St
East Hartford, CT 06108
|
1,278 sq. feet
|
2 baths 3 beds |
show details | |

|
#24
Howard Ct
East Hartford, CT 06108
|
748 sq. feet
|
1 baths 2 beds |
show details | |

|
#25
Forbes St
East Hartford, CT 06118
|
1,274 sq. feet
|
1 baths 3 beds |
show details | |

|
#26
Forbes St
East Hartford, CT 06118
|
1,765 sq. feet
|
1 baths 3 beds |
show details | |

|
#27
Burke St
East Hartford, CT 06118
|
1,058 sq. feet
|
1 baths 3 beds |
show details | |

|
#28
Terry Rd
East Hartford, CT 06108
|
1,470 sq. feet
|
2 baths 3 beds |
show details | |

|
#29
College Dr
East Hartford, CT 06108
|
1,735 sq. feet
|
2 baths 3 beds |
show details | |

|
#30
Colgate Ln
East Hartford, CT 06108
|
- sq. feet
|
- baths - beds |
show details |
| Photo | Address | Area | Beds / Baths | Price | Details |
|---|---|---|---|---|---|

|
#31
Burnside Ave Apt C5
East Hartford, CT 06108
|
- sq. feet
|
- baths - beds |
show details | |

|
#32
Burnside Ave Apt C2
East Hartford, CT 06108
|
- sq. feet
|
- baths - beds |
show details | |

|
#33
Ensign St
East Hartford, CT 06118
|
- sq. feet
|
- baths - beds |
show details | |

|
#34
Beacon Hill Rd
East Hartford, CT 06108
|
- sq. feet
|
- baths - beds |
show details | |

|
#35
Roberts St # D
East Hartford, CT 06108
|
- sq. feet
|
- baths - beds |
show details | |

|
#36
Ranney St
East Hartford, CT 06108
|
- sq. feet
|
- baths - beds |
show details | |

|
#37
Burnside Ave
East Hartford, CT 06108
|
- sq. feet
|
- baths - beds |
show details | |

|
Check over 1 million property listings on Foreclosure.com!
|
browse all offers | |||


- 19,97039.0%Hispanic
- 15,99931.3%White alone
- 12,04023.5%Black alone
- 1,8203.6%Two or more races
- 1,6703.3%Asian alone
- 2970.6%Other race alone
- 510.10%American Indian alone
- 510.10%Native Hawaiian and Other
Pacific Islander alone
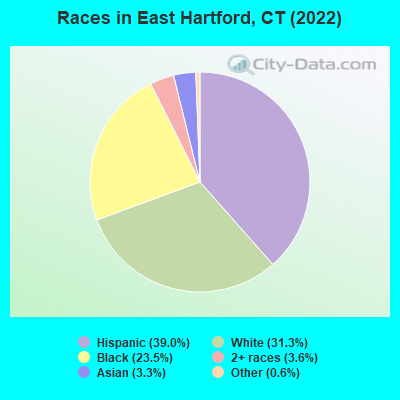
Races in East Hartford detailed stats: ancestries, foreign born residents, place of birth
According to our research of Connecticut and other state lists, there were 151 registered sex offenders living in East Hartford, Connecticut as of April 26, 2024.
The ratio of all residents to sex offenders in East Hartford is 335 to 1.
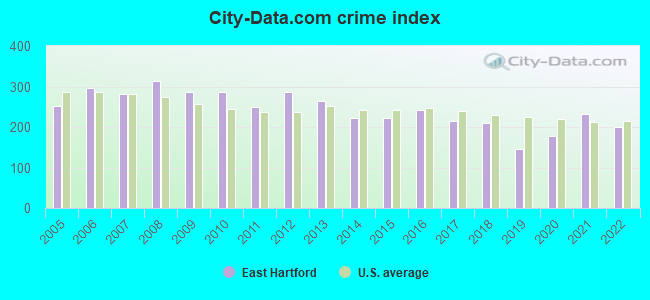
The City-Data.com crime index weighs serious crimes and violent crimes more heavily. Higher means more crime, U.S. average is 246.1. It adjusts for the number of visitors and daily workers commuting into cities.
- means the value is smaller than the state average.- means the value is about the same as the state average.
- means the value is bigger than the state average.
- means the value is much bigger than the state average.
Crime rate in East Hartford detailed stats: murders, rapes, robberies, assaults, burglaries, thefts, arson
Full-time law enforcement employees in 2021, including police officers: 156 (118 officers - 101 male; 17 female).
| Officers per 1,000 residents here: | 2.39 |
| Connecticut average: | 2.10 |
 Recent articles from our blog. Our writers, many of them Ph.D. graduates or candidates, create easy-to-read articles on a wide variety of topics.

Latest news from East Hartford, CT collected exclusively by city-data.com from local newspapers, TV, and radio stations
East Hartford, CT City Guides:
Ancestries: Jamaican (6.3%), Italian (3.8%), Irish (2.9%), Ghanaian (2.5%), French Canadian (2.4%), American (2.2%).
Current Local Time: EST time zone
Incorporated on 10/1783
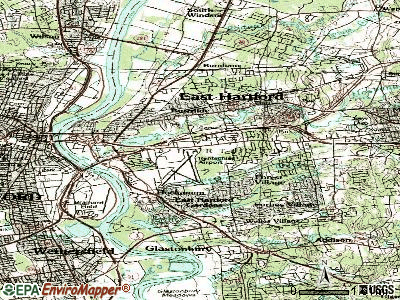
Elevation: 60 feet
Land area: 18.0 square miles.
Population density: 2,844 people per square mile (average).
10,381 residents are foreign born (11.9% Latin America, 2.8% Europe, 2.1% Asia).
| This place: | 20.3% |
| Connecticut: | 15.0% |
Median real estate property taxes paid for housing units with mortgages in 2022: $5,266 (2.4%)
Median real estate property taxes paid for housing units with no mortgage in 2022: $5,338 (2.6%)
Nearest city with pop. 50,000+: Hartford, CT  (3.8 miles , pop. 121,578).
Nearest city with pop. 200,000+: North Hempstead, NY (87.3 miles , pop. 222,611).
Nearest city with pop. 1,000,000+: Bronx, NY (91.0 miles , pop. 1,332,650).
Nearest cities:
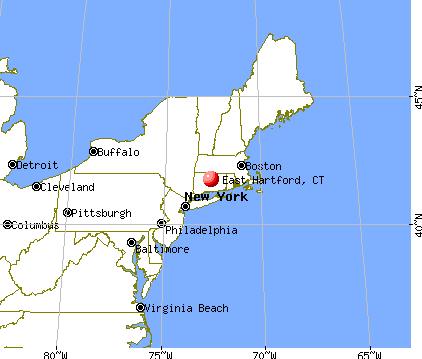
), ), ), Latitude: 41.76 N, Longitude: 72.62 W
Daytime population change due to commuting: +2,154 (+4.2%)
Workers who live and work in this place: 6,047 (23.5%)
Area code commonly used in this area: 860

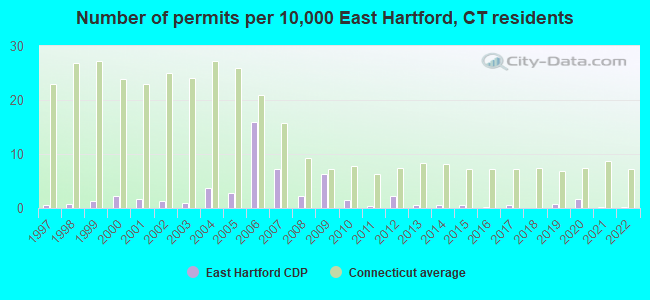
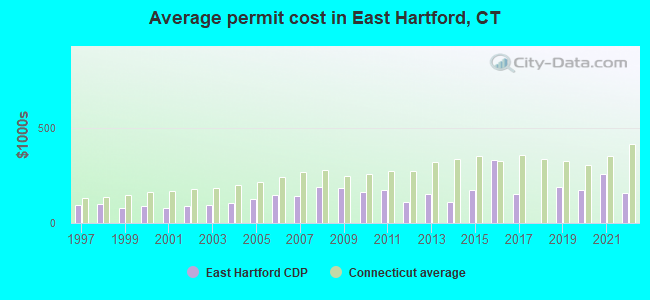
Single-family new house construction building permits:
- 2022: 1 building, cost: $160,000
- 2021: 1 building, cost: $258,000
- 2020: 8 buildings, average cost: $174,600
- 2019: 4 buildings, average cost: $187,500
- 2017: 3 buildings, average cost: $151,700
- 2016: 1 building, cost: $330,000
- 2015: 3 buildings, average cost: $175,000
- 2014: 3 buildings, average cost: $112,400
- 2013: 3 buildings, average cost: $150,700
- 2012: 11 buildings, average cost: $109,100
- 2011: 2 buildings, average cost: $174,600
- 2010: 7 buildings, average cost: $161,800
- 2009: 31 buildings, average cost: $181,600
- 2008: 11 buildings, average cost: $190,100
- 2007: 36 buildings, average cost: $143,500
- 2006: 79 buildings, average cost: $148,800
- 2005: 14 buildings, average cost: $125,700
- 2004: 18 buildings, average cost: $103,600
- 2003: 5 buildings, average cost: $93,100
- 2002: 6 buildings, average cost: $88,300
- 2001: 8 buildings, average cost: $80,500
- 2000: 11 buildings, average cost: $90,900
- 1999: 6 buildings, average cost: $80,500
- 1998: 4 buildings, average cost: $97,800
- 1997: 3 buildings, average cost: $96,800
| Here: | 4.0% |
| Connecticut: | 3.9% |
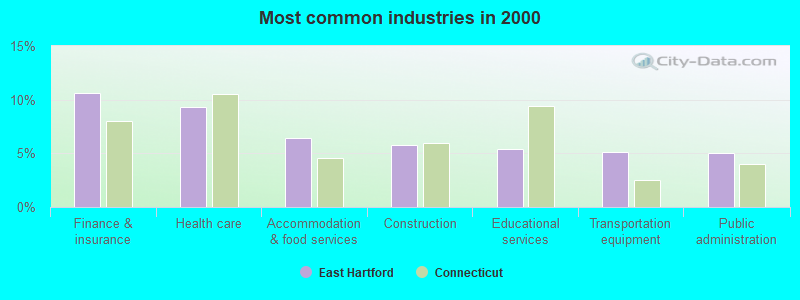
- Finance & insurance (10.6%)
- Health care (9.3%)
- Accommodation & food services (6.4%)
- Construction (5.8%)
- Educational services (5.4%)
- Transportation equipment (5.1%)
- Public administration (5.0%)
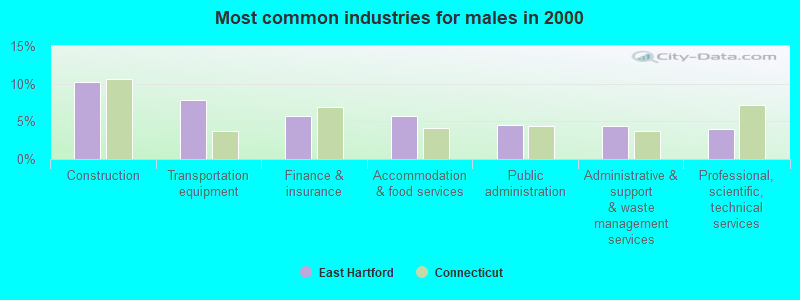
- Construction (10.2%)
- Transportation equipment (7.8%)
- Finance & insurance (5.8%)
- Accommodation & food services (5.7%)
- Public administration (4.5%)
- Administrative & support & waste management services (4.4%)
- Professional, scientific, technical services (4.0%)
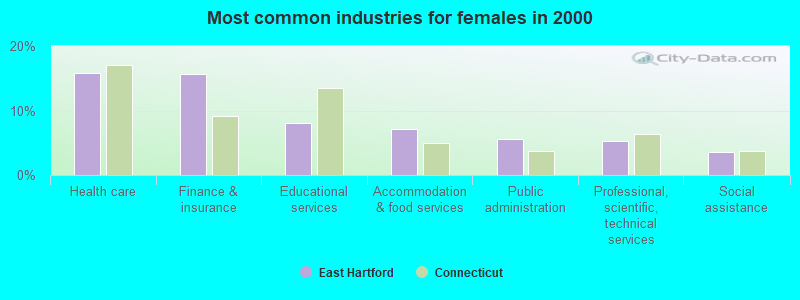
- Health care (15.9%)
- Finance & insurance (15.6%)
- Educational services (8.0%)
- Accommodation & food services (7.1%)
- Public administration (5.6%)
- Professional, scientific, technical services (5.3%)
- Social assistance (3.5%)
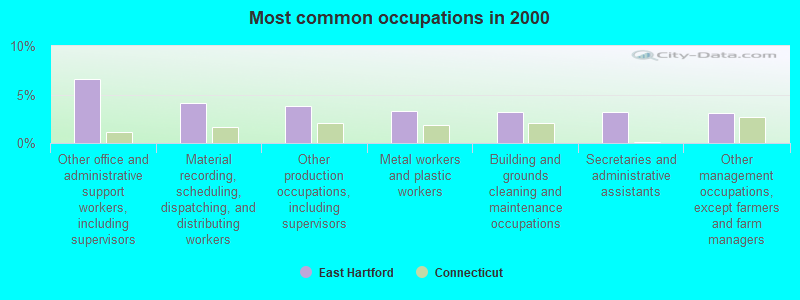
- Other office and administrative support workers, including supervisors (6.6%)
- Material recording, scheduling, dispatching, and distributing workers (4.1%)
- Other production occupations, including supervisors (3.8%)
- Metal workers and plastic workers (3.3%)
- Building and grounds cleaning and maintenance occupations (3.2%)
- Secretaries and administrative assistants (3.2%)
- Other management occupations, except farmers and farm managers (3.1%)
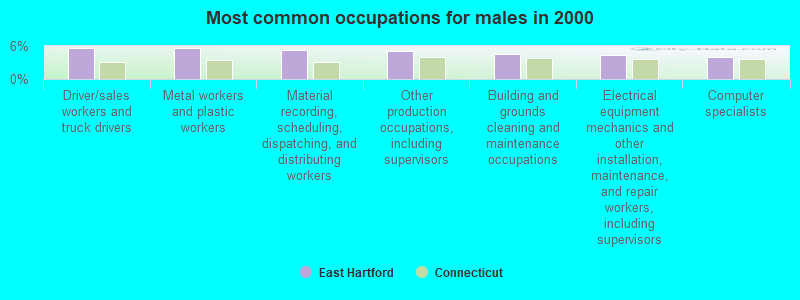
- Driver/sales workers and truck drivers (5.7%)
- Metal workers and plastic workers (5.7%)
- Material recording, scheduling, dispatching, and distributing workers (5.2%)
- Other production occupations, including supervisors (5.1%)
- Building and grounds cleaning and maintenance occupations (4.5%)
- Electrical equipment mechanics and other installation, maintenance, and repair workers, including supervisors (4.3%)
- Computer specialists (3.9%)
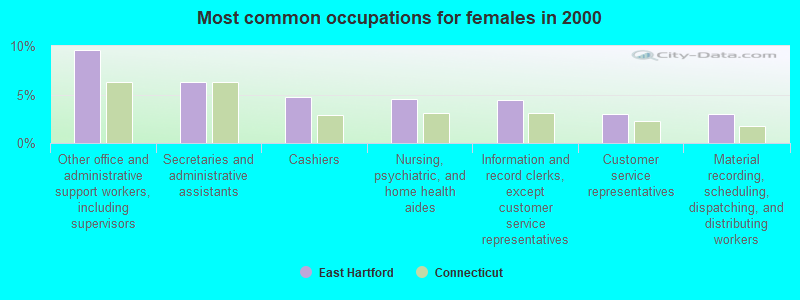
- Other office and administrative support workers, including supervisors (9.6%)
- Secretaries and administrative assistants (6.3%)
- Cashiers (4.7%)
- Nursing, psychiatric, and home health aides (4.5%)
- Information and record clerks, except customer service representatives (4.4%)
- Customer service representatives (3.0%)
- Material recording, scheduling, dispatching, and distributing workers (3.0%)
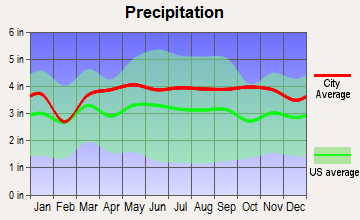
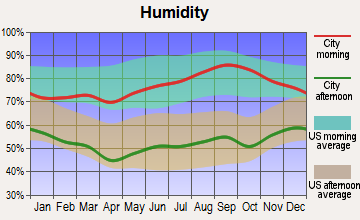
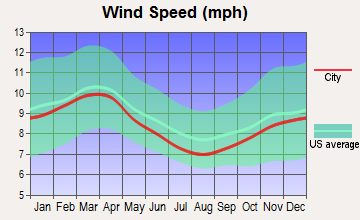
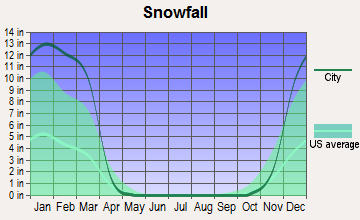
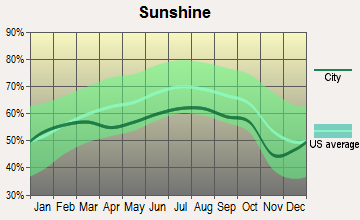
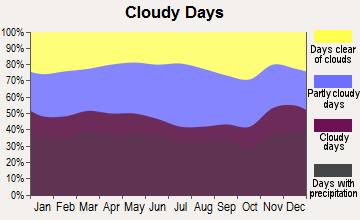
Average climate in East Hartford, Connecticut
Based on data reported by over 4,000 weather stations

(lower is better)
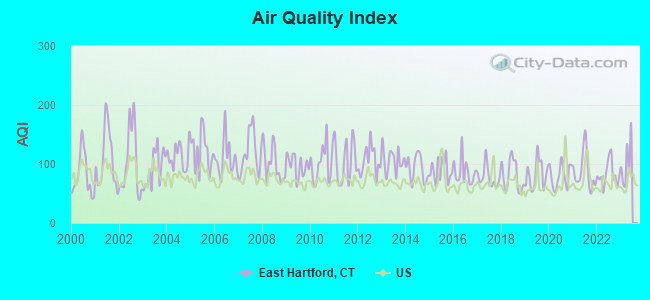
Air Quality Index (AQI) level in 2022 was 82.0. This is about average.
| City: | 82.0 |
| U.S.: | 72.6 |
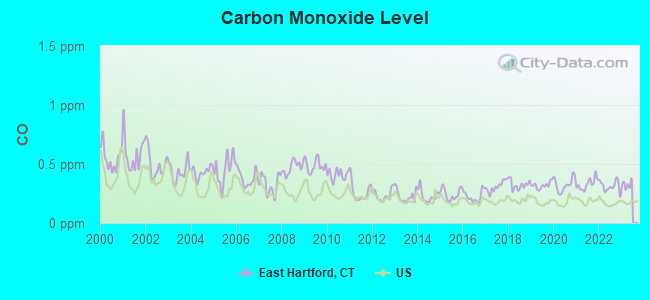
Carbon Monoxide (CO) [ppm] level in 2022 was 0.312. This is worse than average. Closest monitor was 1.8 miles away from the city center.
| City: | 0.312 |
| U.S.: | 0.251 |
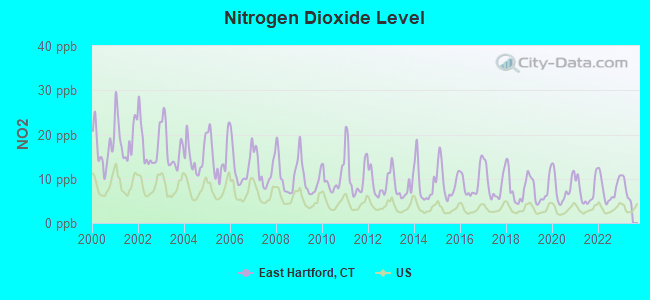
Nitrogen Dioxide (NO2) [ppb] level in 2022 was 7.64. This is significantly worse than average. Closest monitor was 1.8 miles away from the city center.
| City: | 7.64 |
| U.S.: | 5.11 |
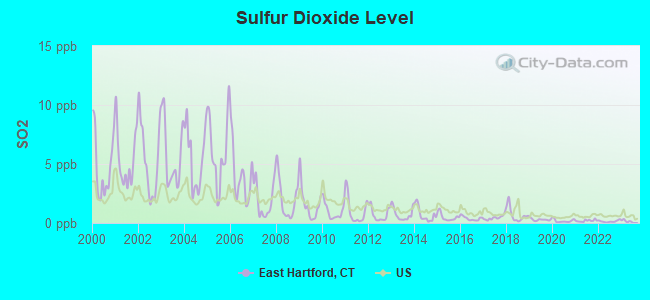
Sulfur Dioxide (SO2) [ppb] level in 2022 was 0.141. This is significantly better than average. Closest monitor was 1.8 miles away from the city center.
| City: | 0.141 |
| U.S.: | 1.515 |
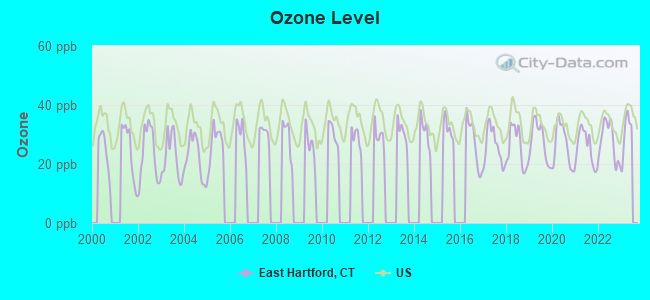
Ozone [ppb] level in 2022 was 27.8. This is about average. Closest monitor was 1.8 miles away from the city center.
| City: | 27.8 |
| U.S.: | 33.3 |
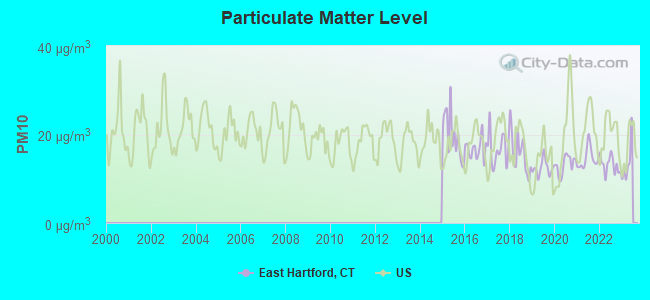
Particulate Matter (PM10) [µg/m3] level in 2022 was 13.1. This is significantly better than average. Closest monitor was 1.6 miles away from the city center.
| City: | 13.1 |
| U.S.: | 19.2 |
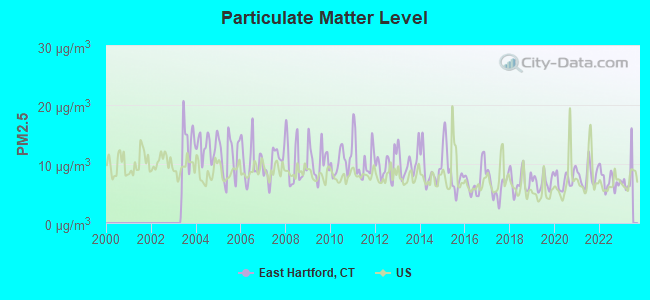
Particulate Matter (PM2.5) [µg/m3] level in 2022 was 7.16. This is about average. Closest monitor was 1.6 miles away from the city center.
| City: | 7.16 |
| U.S.: | 8.11 |
Tornado activity:
East Hartford-area historical tornado activity is slightly above Connecticut state average. It is 19% smaller than the overall U.S. average.
On 10/3/1979, a category F4 (max. wind speeds 207-260 mph) tornado 8.7 miles away from the East Hartford place center killed 3 people and injured 500 people and caused between $50,000,000 and $500,000,000 in damages.
On 7/10/1989, a category F4 tornado 30.2 miles away from the place center injured 40 people and caused between $50,000,000 and $500,000,000 in damages.
Earthquake activity:
East Hartford-area historical earthquake activity is significantly above Connecticut state average. It is 71% smaller than the overall U.S. average.On 10/7/1983 at 10:18:46, a magnitude 5.3 (5.1 MB, 5.3 LG, 5.1 ML, Class: Moderate, Intensity: VI - VII) earthquake occurred 175.0 miles away from East Hartford center
On 4/20/2002 at 10:50:47, a magnitude 5.3 (5.3 ML, Depth: 3.0 mi) earthquake occurred 197.9 miles away from East Hartford center
On 4/20/2002 at 10:50:47, a magnitude 5.2 (5.2 MB, 4.2 MS, 5.2 MW, 5.0 MW) earthquake occurred 196.6 miles away from the city center
On 1/19/1982 at 00:14:42, a magnitude 4.7 (4.5 MB, 4.7 MD, 4.5 LG, Class: Light, Intensity: IV - V) earthquake occurred 130.9 miles away from the city center
On 10/16/2012 at 23:12:25, a magnitude 4.7 (4.7 ML, Depth: 10.0 mi) earthquake occurred 161.4 miles away from East Hartford center
On 8/23/2011 at 17:51:04, a magnitude 5.8 (5.8 MW, Depth: 3.7 mi) earthquake occurred 388.2 miles away from East Hartford center
Magnitude types: regional Lg-wave magnitude (LG), body-wave magnitude (MB), duration magnitude (MD), local magnitude (ML), surface-wave magnitude (MS), moment magnitude (MW)
Natural disasters:
The number of natural disasters in Hartford County (24) is greater than the US average (15).Major Disasters (Presidential) Declared: 13
Emergencies Declared: 11
Causes of natural disasters: Storms: 7, Hurricanes: 5, Floods: 4, Snowstorms: 4, Blizzards: 3, Snows: 3, Tropical Storms: 2, Winter Storms: 2, Snowfall: 1, Tornado: 1, Wind: 1 (Note: some incidents may be assigned to more than one category).
Main business address for: FARMSTEAD TELEPHONE GROUP INC (WHOLESALE-ELECTRONIC PARTS & EQUIPMENT, NEC).
Hospitals and medical centers in East Hartford:
Heliports located in East Hartford:
Amtrak stations near East Hartford:
- 4 miles: HARTFORD (1 UNION PLACE) . Services: ticket office, partially wheelchair accessible, enclosed waiting area, public restrooms, public payphones, full-service food facilities, snack bar, vending machines, ATM, paid short-term parking, paid long-term parking, call for car rental service, taxi stand, intercity bus service, public transit connection.
- 7 miles: WINDSOR (41 CENTRAL ST.) . Services: enclosed waiting area, public restrooms, public payphones, free short-term parking, call for car rental service, call for taxi service, public transit connection.
- 12 miles: WINDSOR LOCKS (S. MAIN ST. (RTE. 159)) . Services: public payphones, free short-term parking, free long-term parking, call for car rental service, call for taxi service, public transit connection.
Colleges/Universities in East Hartford:
- Goodwin College (Full-time enrollment: 3,017; Location: One Riverside Drive; Private, not-for-profit; Website: www.goodwin.edu)
- Stone Academy-East Hartford (Full-time enrollment: 283; Location: 745 Burnside Avenue; Private, for-profit; Website: www.stoneacademy.com)
- Marinello Schools of Beauty-East Hartford (Full-time enrollment: 177; Location: 1000 Main St; Private, for-profit; Website: www.marinello.com)
Other colleges/universities with over 2000 students near East Hartford:
- Manchester Community College (about 3 miles; Manchester, CT; Full-time enrollment: 4,667)
- Capital Community College (about 3 miles; Hartford, CT; FT enrollment: 2,609)
- Trinity College (about 4 miles; Hartford, CT; FT enrollment: 2,355)
- University of Hartford (about 6 miles; West Hartford, CT; FT enrollment: 6,398)
- Central Connecticut State University (about 10 miles; New Britain, CT; FT enrollment: 9,989)
- Tunxis Community College (about 15 miles; Farmington, CT; FT enrollment: 2,787)
- Wesleyan University (about 15 miles; Middletown, CT; FT enrollment: 3,517)
Public high schools in East Hartford:
- EAST HARTFORD HIGH SCHOOL (Students: 1,829, Location: 869 FORBES STREET, Grades: 9-12)
- WOODLAND SCHOOL (Students: 163, Location: 110 LONG HILL DRIVE, Grades: 1-12)
- STEVENS ALTERNATE HIGH SCHOOL (Students: 3, Location: 40 BUTTERNUT DRIVE, Grades: 9-12)
- JOHN J. ALLISON POLARIS CENTER (Location: 474 SCHOOL STREET, Grades: 7-12)
- LINCOLN ACADEMY REGIONAL INTERDISTRICT COLLABORATI (Location: 474 SCHOOL ST., Grades: 8-12)
- CONNECTICUT IB ACADEMY (Location: 857 FORBES STREET, Grades: 9-12)
- CONNECTICUT RIVER ACADEMY (Location: ONE RIVERSIDE DRIVE, Grades: 9-12)
Private high school in East Hartford:
Biggest public elementary/middle schools in East Hartford:
- EAST HARTFORD MIDDLE SCHOOL (Students: 1,160, Location: 777 BURNSIDE AVENUE, Grades: 6-8)
- TWO RIVERS MAGNET MIDDLE SCHOOL (Students: 558, Location: 337 EAST RIVER DRIVE, Grades: 6-8)
- ROBERT J. O'BRIEN SCHOOL (Students: 504, Location: 52 FARM DRIVE, Grades: KG-6)
- DR. FRANKLIN H. MAYBERRY SCHOOL (Students: 490, Location: 101 GREAT HILL ROAD, Grades: KG-5)
- DR. JOHN A. LANGFORD SCHOOL (Students: 405, Location: 61 ALPS DRIVE, Grades: KG-6)
- GOVERNOR WILLIAM PITKIN SCHOOL (Students: 401, Location: 330 HILLS STREET, Grades: KG-5)
- HOCKANUM SCHOOL (Students: 378, Location: 191 MAIN STREET, Grades: PK-5)
- DR. THOMAS S. O'CONNELL SCHOOL (Students: 374, Location: 301 MAY ROAD, Grades: KG-6)
- JOSEPH O. GOODWIN SCHOOL (Students: 373, Location: 1235 FORBES STREET, Grades: KG-6)
- ANNA E. NORRIS SCHOOL (Students: 362, Location: 40 REMINGTON ROAD, Grades: KG-5)
Private elementary/middle school in East Hartford:
Points of interest:
Notable locations in East Hartford: East Hartford Golf Course (A), Prestige Industrial Park (B), Hale Music Shell (C), Easton Orchard (D), Wickham Memorial Library (E), South End Senior Citizens Center (F), Penney Memorial Library (G), Hockanum Branch Library (H), Engine Company 15 Fire Station (I), Raymond Memorial Library (J), North End Senior Citizens Center (K), Pratt and Whitney Fire Department (L), East Hartford Fire Department Station 2 (M), East Hartford Fire Department Station 1 (N), East Hartford Fire Department Station 6 (O), East Hartford Fire Department Station 5 (P), East Hartford Fire Department Station 3 Headquarters (Q). Display/hide their locations on the map
Shopping Centers: School Street Square Shopping Center (1), Silver Lane Plaza Shopping Center (2), Somerset Square Shopping Center (3), Charter Oak Mall Shopping Center (4), Powder Mill Shopping Center (5), Bicentennial Square Shopping Center (6), 467 Main Street Shopping Center (7), Kings Plaza Shopping Center (8), Founders Plaza Shopping Center (9). Display/hide their locations on the map
Main business address in East Hartford: FARMSTEAD TELEPHONE GROUP INC (A). Display/hide its location on the map
Churches in East Hartford include: Faith Church (A), Saint Christophers Church (B), Saint Isaac Jogues Church (C), Salvation Army New Life Center (D), South Congregational Church (E), Temple Beth Tefilah (F), Truth Baptist Church (G), Fellowship for Love and Wisdom Church (H), First Congregational Church of East Hartford (I). Display/hide their locations on the map
Cemeteries: Center Cemetery (1), Saint Marys Cemetery (2), Old South Cemetery (3), Hockanum Cemetery (4), Hillside Cemetery (5). Display/hide their locations on the map
Lakes and reservoirs: Hills Pond (A), Wickham Reservoir (B), Hockanum River Reservoir (C). Display/hide their locations on the map
Streams, rivers, and creeks: Pewterpot Brook (A), Podunk River (B), Willow Brook (C), Goodwin Brook (D), Hockanum River (E). Display/hide their locations on the map
Parks in East Hartford include: Center Park (1), Corneluis McAuliffe Park (2), Elizabeth Shea Park (3), North End Park (4), Riverside Park (5), Doctor Richard E Gorman Park (6), Dwyer Park (7), Goodwin Playground (8), Hockanum Park (9). Display/hide their locations on the map
Tourist attractions: Historical Society of East Hartford Inc (Museums; 307 Burnside Avenue), Irish-American Community Center (Cultural Attractions- Events- & Facilities; Venice Place), Self Service Sales Corporation (Amusement & Theme Parks; 12 Cedar Street).
Hotels: Sheraton Hartford Hotel (100 East River Drive), Wellesley Inn & Suites (333 Roberts Street), J T Ashleys (363 Roberts Street), Days Inn East Hartford CT (333 Roberts Street), Econo Lodge East Hartford (490 Main Street), Madison Motor Inn (393 Main Street), Church Corners Inn (860 Main Street).
Courts: Connecticut State - Judicial Branch- Appellate Court- Support Enforcement Division- (287 Main), Judicial Information Technology Division (99 East River Drive), Judicial Branch - Judge Support Services- Support Enforcement Division- Director- Appellate C (287 Main Street Floor 3), Judicial Branch - Statewide Grievance Bar Counsel (287 Main Street Floor 3).
Birthplace of: Diane Venora - Actress, Gérard Ouellet - Politician, John A. Gurley - Politician, Lawrence Brainerd - Politician, Mary Cadorette - Actor.
Drinking water stations with addresses in East Hartford and their reported violations in the past:
WALDEN APARTMENTS (Population served: 276, Groundwater):Past health violations:Past monitoring violations:
- MCL, Monthly (TCR) - In OCT-2009, Contaminant: Coliform. Follow-up actions: St Public Notif requested (NOV-02-2009), St Violation/Reminder Notice (NOV-02-2009), St Compliance achieved (DEC-31-2009)
- MCL, Monthly (TCR) - In AUG-2009, Contaminant: Coliform. Follow-up actions: St Public Notif requested (SEP-03-2009), St Public Notif received (SEP-28-2009), St Compliance achieved (SEP-30-2009)
- Follow-up Or Routine LCR Tap M/R - In OCT-01-2013, Contaminant: Lead and Copper Rule. Follow-up actions: St Public Notif requested (MAY-01-2014), St Violation/Reminder Notice (MAY-01-2014), St Public Notif received (MAY-06-2014)
- Water Quality Parameter M/R - Between JAN-2004 and DEC-2006, Contaminant: Lead and Copper Rule. Follow-up actions: St Compliance achieved (APR-05-2007), St Violation/Reminder Notice (MAR-19-2009)
- 6 routine major monitoring violations
| This place: | 2.5 people |
| Connecticut: | 2.5 people |
| This place: | 63.9% |
| Whole state: | 66.3% |
| This place: | 8.4% |
| Whole state: | 6.6% |
Likely homosexual households (counted as self-reported same-sex unmarried-partner households)
- Lesbian couples: 0.4% of all households
- Gay men: 0.3% of all households
People in group quarters in East Hartford in 2010:
- 455 people in nursing facilities/skilled-nursing facilities
- 199 people in other noninstitutional facilities
- 41 people in group homes intended for adults
- 35 people in emergency and transitional shelters (with sleeping facilities) for people experiencing homelessness
- 5 people in group homes for juveniles (non-correctional)
- 5 people in residential treatment centers for juveniles (non-correctional)
People in group quarters in East Hartford in 2000:
- 590 people in nursing homes
- 76 people in other noninstitutional group quarters
- 33 people in homes for the mentally retarded
- 7 people in training schools for juvenile delinquents
- 4 people in religious group quarters
Banks with branches in East Hartford (2011 data):
- Webster Bank, National Association: East Hartford Branch at 1085 Main Street, branch established on 1950/07/03; East Hartford Branch at 1491 Silver Lane, branch established on 1975/07/19. Info updated 2008/12/23: Bank assets: $18,674.3 mil, Deposits: $13,861.5 mil, headquarters in Waterbury, CT, positive income, Commercial Lending Specialization, 167 total offices, Holding Company: Webster Financial Corporation
- First Niagara Bank, National Association: East Hartford Branch at 1065 Main Street, branch established on 2001/08/31; East Hartford Silver Lane Branch at 950 Silver Lane, branch established on 2001/12/17. Info updated 2011/06/09: Bank assets: $32,750.6 mil, Deposits: $19,595.4 mil, headquarters in Buffalo, NY, positive income, Commercial Lending Specialization, 351 total offices, Holding Company: First Niagara Financial Group, Inc.
- Bank of America, National Association: School Street Square Branch at 303 Ellington Road And School Street, branch established on 1964/11/02; East Hartford Branch at 805 Main Street, branch established on 1956/02/14. Info updated 2009/11/18: Bank assets: $1,451,969.3 mil, Deposits: $1,077,176.8 mil, headquarters in Charlotte, NC, positive income, 5782 total offices, Holding Company: Bank Of America Corporation
- Sovereign Bank, National Association: Silver Lane Branch at 934 Silver Lane, branch established on 1965/11/20. Info updated 2012/01/31: Bank assets: $78,146.9 mil, Deposits: $48,042.9 mil, headquarters in Wilmington, DE, positive income, Commercial Lending Specialization, 718 total offices, Holding Company: Banco Santander, S.A.
- Wells Fargo Bank, National Association: East Hartford Branch at 18 Main Street, branch established on 2010/07/01. Info updated 2011/04/05: Bank assets: $1,161,490.0 mil, Deposits: $905,653.0 mil, headquarters in Sioux Falls, SD, positive income, 6395 total offices, Holding Company: Wells Fargo & Company
- People's United Bank: East Hartford Stop And Shop Branch at 940 Silver Lane, branch established on 1996/06/30. Info updated 2012/02/16: Bank assets: $27,319.3 mil, Deposits: $20,835.4 mil, headquarters in Bridgeport, CT, positive income, Commercial Lending Specialization, 374 total offices
- TD Bank, National Association: East Hartford Branch at 29 Main Street, branch established on 1970/04/18. Info updated 2010/10/04: Bank assets: $188,912.6 mil, Deposits: $153,149.8 mil, headquarters in Wilmington, DE, positive income, 1314 total offices, Holding Company: Toronto-Dominion Bank, The
For population 15 years and over in East Hartford:

- Never married: 43.6%
- Now married: 38.8%
- Separated: 1.3%
- Widowed: 4.5%
- Divorced: 11.7%
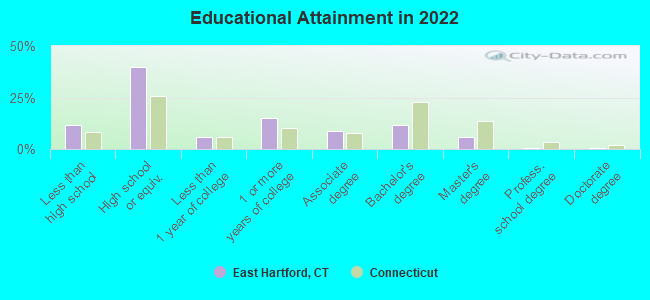
For population 25 years and over in East Hartford:
- High school or higher: 88.1%
- Bachelor's degree or higher: 18.1%
- Graduate or professional degree: 6.9%
- Unemployed: 5.1%
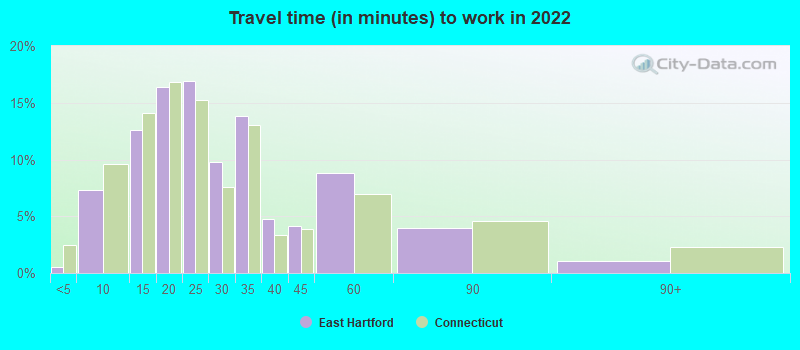
- Mean travel time to work (commute): 19.1 minutes
| Here: | 11.8 |
| Connecticut average: | 12.6 |
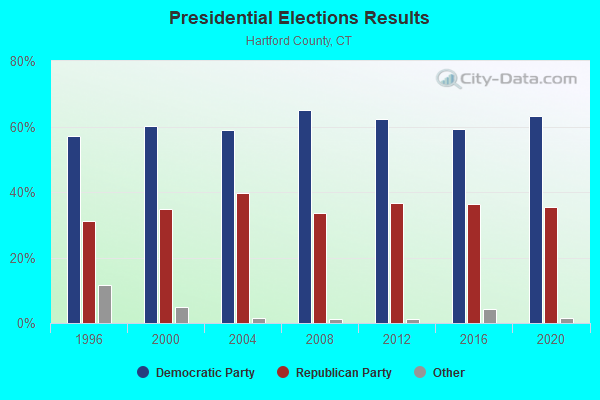
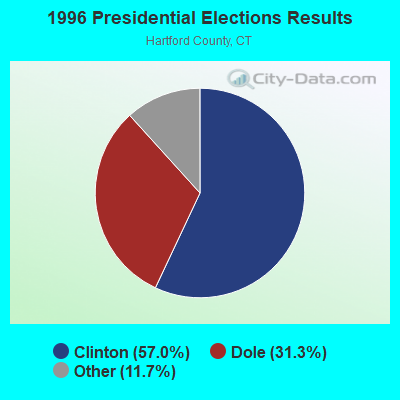
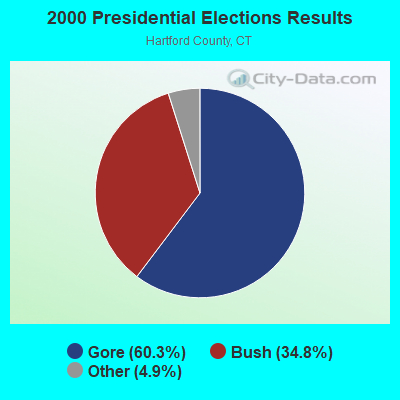
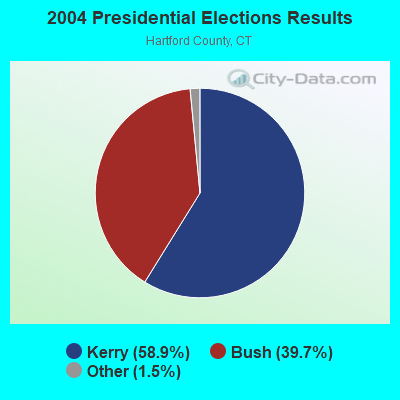
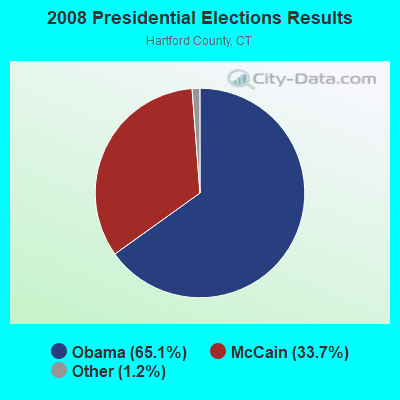
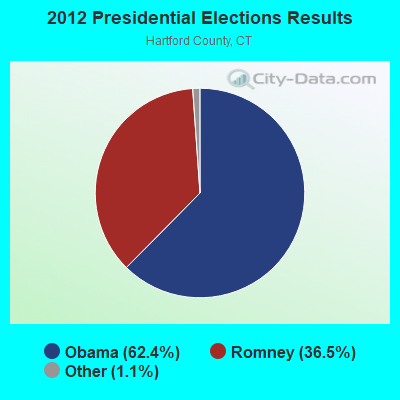
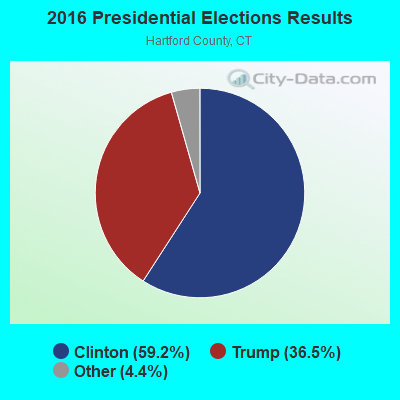
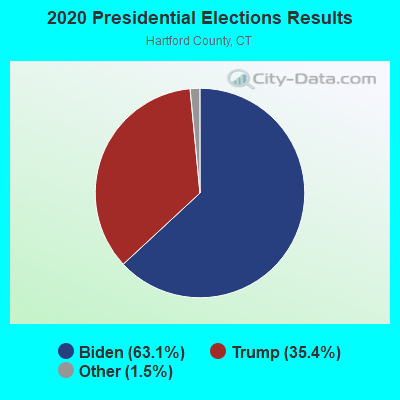
Graphs represent county-level data. Detailed 2008 Election Results
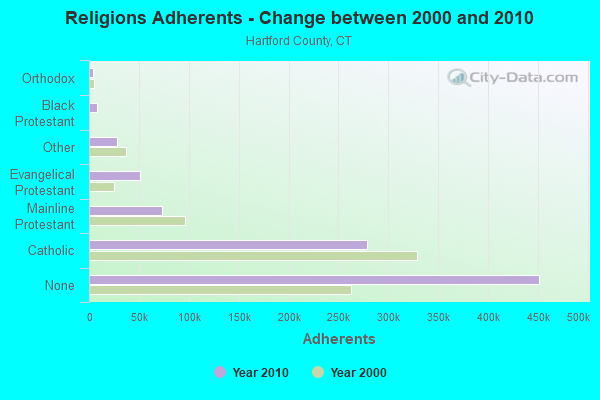
Religion statistics for East Hartford, CT (based on Hartford County data)
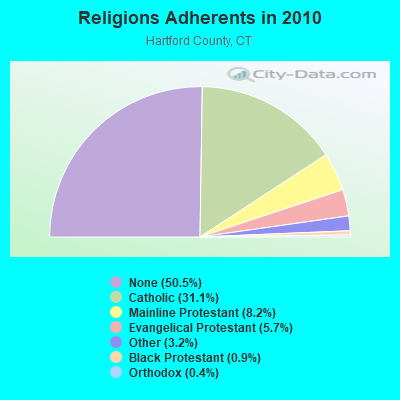
| Religion | Adherents | Congregations |
|---|---|---|
| Catholic | 278,203 | 100 |
| Mainline Protestant | 73,522 | 183 |
| Evangelical Protestant | 50,619 | 214 |
| Other | 28,183 | 94 |
| Black Protestant | 8,446 | 26 |
| Orthodox | 3,665 | 13 |
| None | 451,376 | - |
Food Environment Statistics:
| Here: | 2.46 / 10,000 pop. |
| Connecticut: | 2.21 / 10,000 pop. |
| Hartford County: | 0.06 / 10,000 pop. |
| Connecticut: | 0.07 / 10,000 pop. |
| Hartford County: | 1.05 / 10,000 pop. |
| Connecticut: | 1.02 / 10,000 pop. |
| Here: | 2.32 / 10,000 pop. |
| Connecticut: | 2.27 / 10,000 pop. |
| Hartford County: | 8.63 / 10,000 pop. |
| Connecticut: | 9.19 / 10,000 pop. |
| This county: | 7.4% |
| State: | 7.3% |
| This county: | 22.1% |
| State: | 21.5% |
| Hartford County: | 16.0% |
| Connecticut: | 15.8% |
Health and Nutrition:
| Here: | 49.4% |
| Connecticut: | 50.0% |
| East Hartford: | 46.8% |
| Connecticut: | 47.5% |
| This city: | 28.8 |
| Connecticut: | 28.7 |
| This city: | 20.6% |
| Connecticut: | 20.9% |
| This city: | 11.8% |
| State: | 10.5% |
| This city: | 6.8 |
| Connecticut: | 6.8 |
| Here: | 34.2% |
| Connecticut: | 34.2% |
| East Hartford: | 55.3% |
| Connecticut: | 56.4% |
| This city: | 78.9% |
| Connecticut: | 78.9% |
More about Health and Nutrition of East Hartford, CT Residents
4.94% of this county's 2021 resident taxpayers lived in other counties in 2020 ($69,891 average adjusted gross income)
| Here: | 4.94% |
| Connecticut average: | 5.79% |
0.04% of residents moved from foreign countries ($102 average AGI)
Hartford County: 0.04% Connecticut average: 0.02%
Top counties from which taxpayers relocated into this county between 2020 and 2021:
| from New Haven County, CT | |
| from Tolland County, CT | |
| from Middlesex County, CT |
5.15% of this county's 2020 resident taxpayers moved to other counties in 2021 ($92,529 average adjusted gross income)
| Here: | 5.15% |
| Connecticut average: | 5.82% |
0.03% of residents moved to foreign countries ($235 average AGI)
Hartford County: 0.03% Connecticut average: 0.02%
Top counties to which taxpayers relocated from this county between 2020 and 2021:
| to Tolland County, CT | |
| to New Haven County, CT | |
| to Middlesex County, CT |
| Businesses in East Hartford, CT | ||||
| Name | Count | Name | Count | |
|---|---|---|---|---|
| 7-Eleven | 2 | Holiday Inn | 1 | |
| Advance Auto Parts | 1 | KFC | 1 | |
| Audi | 1 | McDonald's | 1 | |
| Burger King | 1 | New Balance | 1 | |
| Burlington Coat Factory | 1 | Nike | 2 | |
| CVS | 2 | PetSmart | 1 | |
| Chevrolet | 1 | Pizza Hut | 1 | |
| Comfort Inn | 1 | Quiznos | 1 | |
| DHL | 1 | Ramada | 1 | |
| Dairy Queen | 1 | Rite Aid | 2 | |
| Domino's Pizza | 1 | Staples | 1 | |
| Dunkin Donuts | 3 | Stop & Shop | 1 | |
| Econo Lodge | 1 | Taco Bell | 1 | |
| FedEx | 10 | U-Haul | 2 | |
| Ford | 1 | UPS | 8 | |
| H&R Block | 3 | Vans | 1 | |
| Haworth | 1 | Walgreens | 2 | |
| Hilton | 1 | YMCA | 1 | |
Strongest AM radio stations in East Hartford:
- WTIC (1080 AM; 50 kW; HARTFORD, CT; Owner: INFINITY RADIO OPERATIONS INC.)
- WDRC (1360 AM; 5 kW; HARTFORD, CT; Owner: BUCKLEY BROADCASTING CORPORATION)
- WNNZ (640 AM; 50 kW; WESTFIELD, MA; Owner: CLEAR CHANNEL BROADCASTING LICENSES, INC.)
- WNEZ (1230 AM; 1 kW; MANCHESTER, CT; Owner: MEGA COMMUNICATIONS OF MANCHESTER LICENSEE LLC)
- WLAT (910 AM; 5 kW; NEW BRITAIN, CT; Owner: MEGA COMMUNICATIONS OF NEW BRITAIN LICENSEE, LLC)
- WPOP (1410 AM; 5 kW; HARTFORD, CT; Owner: CAPSTAR TX LIMITED PARTNERSHIP)
- WDZK (1550 AM; 5 kW; BLOOMFIELD, CT; Owner: ABC, INC.)
- WCRN (830 AM; 50 kW; WORCESTER, MA; Owner: CARTER BROADCASTING CORPORATION)
- WRYM (840 AM; 1 kW; NEW BRITAIN, CT)
- WALE (990 AM; 50 kW; GREENVILLE, RI; Owner: NORTH AMERICAN BROADCASTING CO., INC.)
- WVNE (760 AM; daytime; 25 kW; LEICESTER, MA; Owner: BLOUNT MASSCOM, INC.)
- WMRD (1150 AM; 2 kW; MIDDLETOWN, CT; Owner: CROSSROADS COMMUNICATIONS, INC.)
- WFAN (660 AM; 50 kW; NEW YORK, NY; Owner: INFINITY BROADCASTING OPERATIONS, INC.)
Strongest FM radio stations in East Hartford:
- WRCH (100.5 FM; NEW BRITAIN, CT; Owner: INFINITY RADIO OPERATIONS INC.)
- WTIC-FM (96.5 FM; HARTFORD, CT; Owner: INFINITY RADIO OPERATIONS INC.)
- WWUH (91.3 FM; WEST HARTFORD, CT; Owner: UNIVERSITY OF HARTFORD)
- WCCC-FM (106.9 FM; HARTFORD, CT; Owner: MARLIN BROADCASTING, LLC)
- WWYZ (92.5 FM; WATERBURY, CT; Owner: CAPSTAR TX LIMITED PARTNERSHIP)
- WKSS (95.7 FM; HARTFORD-MERIDEN, CT; Owner: CAPSTAR TX LIMITED PARTNERSHIP)
- WHCN (105.9 FM; HARTFORD, CT; Owner: CAPSTAR TX LIMITED PARTNERSHIP)
- WZMX (93.7 FM; HARTFORD, CT; Owner: INFINITY RADIO OPERATIONS INC.)
- WMRQ (104.1 FM; WATERBURY, CT; Owner: CAPSTAR TX LIMITED PARTNERSHIP)
- WPKT (90.5 FM; MERIDEN, CT; Owner: CONNECTICUT PUBLIC BROADCASTING, INC)
- WDRC-FM (102.9 FM; HARTFORD, CT; Owner: BUCKLEY BROADCASTING CORPORATION)
- WRTC-FM (89.3 FM; HARTFORD, CT; Owner: TRUSTEES OF TRINITY COLLEGE)
- WKCI-FM (101.3 FM; HAMDEN, CT; Owner: CLEAR CHANNEL BROADCASTING LICENSES, INC.)
- WAQY (102.1 FM; SPRINGFIELD, MA; Owner: SAGA COMMUNICATIONS OF NEW ENGLAND, LLC)
- WJMJ (88.9 FM; HARTFORD, CT; Owner: ST. THOMAS SEMINARY)
- WQTQ (89.9 FM; HARTFORD, CT; Owner: HARTFORD BOARD OF EDUCATION)
- WPLR (99.1 FM; NEW HAVEN, CT; Owner: COX RADIO, INC.)
- WHUS (91.7 FM; STORRS, CT; Owner: THE BD. OF TRUSTEES, THE UNIV. OF CT)
- WHYN-FM (93.1 FM; SPRINGFIELD, MA; Owner: CLEAR CHANNEL BROADCASTING LICENSES, INC.)
- WILI-FM (98.3 FM; WILLIMANTIC, CT; Owner: NUTMEG BROADCASTING COMPANY)
TV broadcast stations around East Hartford:
- WHTX-LP (Channel 10; HARTFORD, CT; Owner: ENTRAVISION HOLDINGS, LLC)
- WRDM-LP (Channel 13; HARTFORD, CT; Owner: ZGS HARTFORD, INC.)
- WMLD-LP (Channel 6; HARTFORD, CT; Owner: HARVARD BROADCASTING, INC.)
- WTIC-TV (Channel 61; HARTFORD, CT; Owner: TRIBUNE TELEVISION COMPANY)
- W11BJ (Channel 11; HARTFORD, CT; Owner: COMMUNICATIONS SITE MANAGEMENT LLC)
- WUVN (Channel 18; HARTFORD, CT; Owner: ENTRAVISION HOLDINGS, LLC)
- WTXX (Channel 20; WATERBURY, CT; Owner: WTXX INC.)
- WVIT (Channel 30; NEW BRITAIN, CT; Owner: OUTLET BROADCASTING, INC)
- WEDH (Channel 24; HARTFORD, CT; Owner: CONNECTICUT PUBLIC BROADCASTING, INC.)
- WFSB (Channel 3; HARTFORD, CT; Owner: MEREDITH CORPORATION)
- WHCT-LP (Channel 38; HARTFORD, CT; Owner: VENTURE TECHNOLOGIES GROUP, LLC)
- WHPX (Channel 26; NEW LONDON, CT; Owner: PAXSON HARTFORD LICENSE, INC.)
- WYDN (Channel 48; WORCESTER, MA; Owner: EDUCATIONAL PUBLIC TV CORPORATION)
- WTNH (Channel 8; NEW HAVEN, CT; Owner: WTNH BROADCASTING, INC.)
- WCTX (Channel 59; NEW HAVEN, CT; Owner: WTNH BROADCASTING, INC.)
- WEDY (Channel 65; NEW HAVEN, CT; Owner: CONNECTICUT PUBLIC BROADCASTING, INC.)
- WWLP (Channel 22; SPRINGFIELD, MA; Owner: WWLP BROADCASTING, LLC)
- WPXQ (Channel 69; BLOCK ISLAND, RI; Owner: OCEAN STATE TELEVISION, L.L.C.)
- WUTH-CA (Channel 47; HARTFORD, CT; Owner: ENTRAVISION HOLDINGS, LLC)
- WEDN (Channel 53; NORWICH, CT; Owner: CONNECTICUT PUBLIC BROADCASTING, INC.)
- National Bridge Inventory (NBI) Statistics
- 115Number of bridges
- 1,526ft / 465mTotal length
- $57,799,000Total costs
- 3,386,344Total average daily traffic
- 340,763Total average daily truck traffic
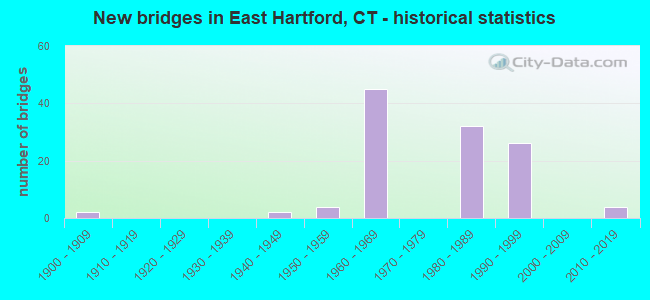
- New bridges - historical statistics
- 21900-1909
- 21940-1949
- 41950-1959
- 451960-1969
- 321980-1989
- 261990-1999
- 42010-2019
FCC Registered Private Land Mobile Towers: 1 (See the full list of FCC Registered Private Land Mobile Towers in East Hartford, CT)
FCC Registered Broadcast Land Mobile Towers: 25 (See the full list of FCC Registered Broadcast Land Mobile Towers)
FCC Registered Microwave Towers: 29 (See the full list of FCC Registered Microwave Towers in this town)
FCC Registered Paging Towers: 1 (See the full list of FCC Registered Paging Towers)
FCC Registered Maritime Coast & Aviation Ground Towers: 1 (See the full list of FCC Registered Maritime Coast & Aviation Ground Towers)
FCC Registered Amateur Radio Licenses: 196 (See the full list of FCC Registered Amateur Radio Licenses in East Hartford)
FAA Registered Aircraft: 14 (See the full list of FAA Registered Aircraft in East Hartford)
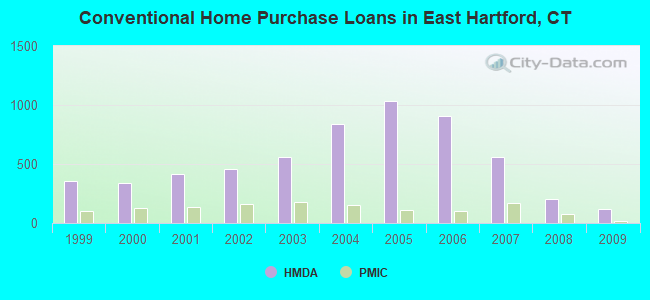
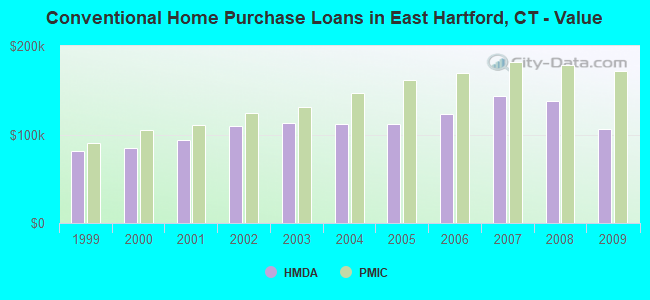
| Home Mortgage Disclosure Act Aggregated Statistics For Year 2009 (Based on 14 full tracts) | ||||||||||||||
| A) FHA, FSA/RHS & VA Home Purchase Loans | B) Conventional Home Purchase Loans | C) Refinancings | D) Home Improvement Loans | E) Loans on Dwellings For 5+ Families | F) Non-occupant Loans on < 5 Family Dwellings (A B C & D) | G) Loans On Manufactured Home Dwelling (A B C & D) | ||||||||
|---|---|---|---|---|---|---|---|---|---|---|---|---|---|---|
| Number | Average Value | Number | Average Value | Number | Average Value | Number | Average Value | Number | Average Value | Number | Average Value | Number | Average Value | |
| LOANS ORIGINATED | 326 | $156,831 | 117 | $106,573 | 599 | $145,983 | 79 | $36,949 | 3 | $2,579,333 | 30 | $115,867 | 14 | $26,714 |
| APPLICATIONS APPROVED, NOT ACCEPTED | 21 | $169,381 | 9 | $112,667 | 88 | $154,807 | 18 | $57,278 | 0 | $0 | 7 | $130,429 | 2 | $30,500 |
| APPLICATIONS DENIED | 69 | $153,681 | 30 | $98,067 | 462 | $155,610 | 82 | $37,073 | 0 | $0 | 25 | $114,640 | 6 | $46,667 |
| APPLICATIONS WITHDRAWN | 36 | $154,833 | 20 | $134,950 | 168 | $165,946 | 7 | $67,571 | 0 | $0 | 6 | $108,333 | 0 | $0 |
| FILES CLOSED FOR INCOMPLETENESS | 11 | $158,636 | 8 | $122,125 | 63 | $170,635 | 4 | $49,750 | 0 | $0 | 4 | $148,750 | 1 | $15,000 |
Detailed mortgage data for all 14 tracts in East Hartford, CT
| Private Mortgage Insurance Companies Aggregated Statistics For Year 2009 (Based on 14 full tracts) | ||||||
| A) Conventional Home Purchase Loans | B) Refinancings | C) Non-occupant Loans on < 5 Family Dwellings (A & B) | ||||
|---|---|---|---|---|---|---|
| Number | Average Value | Number | Average Value | Number | Average Value | |
| LOANS ORIGINATED | 18 | $171,833 | 11 | $168,909 | 0 | $0 |
| APPLICATIONS APPROVED, NOT ACCEPTED | 12 | $192,750 | 15 | $173,267 | 1 | $177,000 |
| APPLICATIONS DENIED | 3 | $122,667 | 4 | $167,500 | 1 | $84,000 |
| APPLICATIONS WITHDRAWN | 0 | $0 | 2 | $123,500 | 0 | $0 |
| FILES CLOSED FOR INCOMPLETENESS | 0 | $0 | 0 | $0 | 0 | $0 |
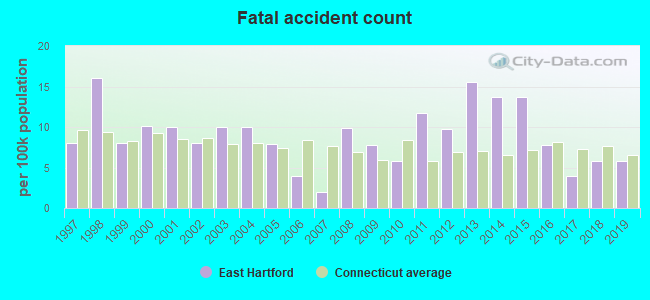
2004 - 2018 National Fire Incident Reporting System (NFIRS) incidents
- Fire incident types reported to NFIRS in East Hartford, CT
- 1,20442.9%Structure Fires
- 1,01936.3%Outside Fires
- 49617.7%Mobile Property/Vehicle Fires
- 873.1%Other
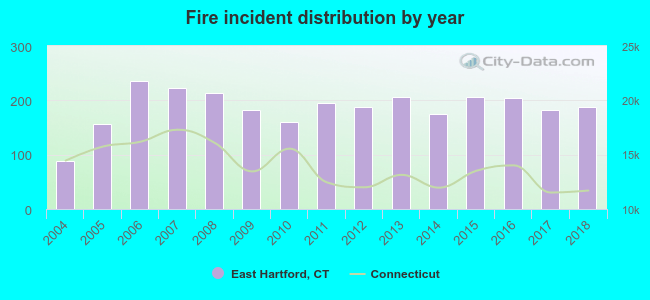 Based on the data from the years 2004 - 2018 the average number of fires per year is 187. The highest number of fires - 235 took place in 2006, and the least - 89 in 2004. The data has a growing trend.
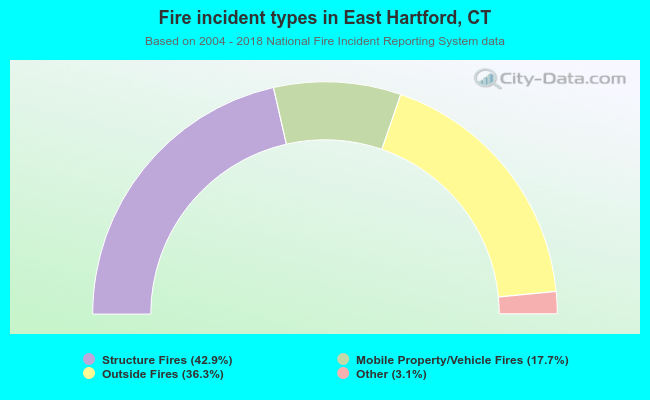 When looking into fire subcategories, the most incidents belonged to: Structure Fires (42.9%), and Outside Fires (36.3%).
Fire-safe hotels and motels in East Hartford, Connecticut:
- Holiday Inn-east, 363 Roberts St, East Hartford, Connecticut 06108 , Phone: (860) 528-9611
- Holiday Inn Hartford East, 100 E River Dr, East Hartford, Connecticut 06108 , Phone: (860) 528-9703, Fax: (860) 289-4728
- Hampton Inn & Suites East Hartford, 351 Pitkin St, East Hartford, Connecticut 06108 , Phone: (860) 282-2500, Fax: (860) 282-2500
- Comfort Inn & Suites, 333 Roberts St, East hartford, Connecticut 06118 , Phone: (860) 289-4950
| Most common first names in East Hartford, CT among deceased individuals | ||
| Name | Count | Lived (average) |
|---|---|---|
| John | 625 | 73.8 years |
| Mary | 596 | 81.0 years |
| Joseph | 453 | 74.4 years |
| William | 387 | 73.7 years |
| James | 268 | 73.4 years |
| Robert | 263 | 68.5 years |
| George | 241 | 74.5 years |
| Edward | 238 | 73.0 years |
| Helen | 236 | 79.5 years |
| Charles | 221 | 74.9 years |
| Most common last names in East Hartford, CT among deceased individuals | ||
| Last name | Count | Lived (average) |
|---|---|---|
| Johnson | 98 | 76.9 years |
| Smith | 81 | 74.5 years |
| Brown | 75 | 73.0 years |
| Anderson | 49 | 79.8 years |
| Miller | 48 | 72.5 years |
| Murphy | 46 | 78.1 years |
| Martin | 45 | 74.6 years |
| Sullivan | 40 | 75.8 years |
| Williams | 38 | 71.1 years |
| Clark | 37 | 75.5 years |
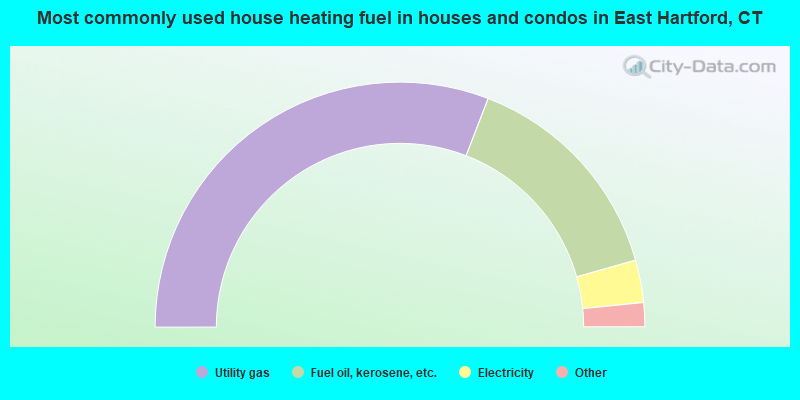
- 61.8%Utility gas
- 29.5%Fuel oil, kerosene, etc.
- 5.6%Electricity
- 2.1%Bottled, tank, or LP gas
- 0.5%Wood
- 0.5%Other fuel
- 0.1%No fuel used
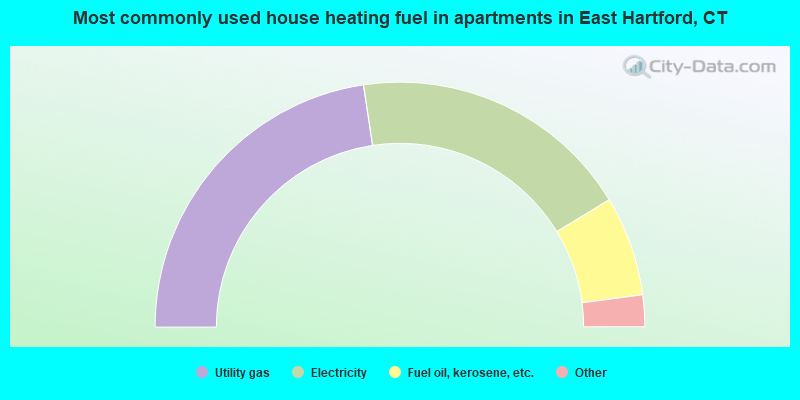
- 45.3%Utility gas
- 37.4%Electricity
- 13.2%Fuel oil, kerosene, etc.
- 3.1%Bottled, tank, or LP gas
- 0.8%No fuel used
- 0.1%Solar energy
East Hartford compared to Connecticut state average:
- Median house value below state average.
- Unemployed percentage below state average.
- Black race population percentage above state average.
- Hispanic race population percentage above state average.
- Length of stay since moving in significantly above state average.
- Percentage of population with a bachelor's degree or higher below state average.
East Hartford on our top lists:
- #17 on the list of "Top 101 cities with largest percentage of females in occupations: fire fighting and prevention workers including supervisors (population 50,000+)"
- #21 on the list of "Top 101 cities with the most residents born in Ghana (population 500+)"
- #27 on the list of "Top 101 cities with largest percentage of females in occupations: healthcare support occupations (population 50,000+)"
- #32 on the list of "Top 101 cities with the lowest percentage of workers working at home, population 50,000+"
- #35 on the list of "Top 101 cities with largest percentage of males in occupations: health technologists and technicians (population 50,000+)"
- #40 on the list of "Top 101 cities with the lowest maximum monthly sunshine amount (population 50,000+)"
- #41 on the list of "Top 101 cities with the largest city-data.com crime index increase from 2011 to 2012 (population 50,000+)"
- #42 on the list of "Top 101 cities with largest percentage of males in occupations: transportation occupations (population 50,000+)"
- #48 on the list of "Top 101 cities with the most residents born in Jamaica (population 500+)"
- #50 on the list of "Top 101 cities with largest percentage of females in occupations: community and social service occupations (population 50,000+)"
- #60 on the list of "Top 101 cities with largest percentage of females in industries: utilities (population 50,000+)"
- #61 on the list of "Top 100 most racially diverse cities (pop. 50,000+)"
- #62 on the list of "Top 101 cities with the smallest house values disparities (population 50,000+)"
- #65 on the list of "Top 101 cities with largest percentage of females in industries: finance and insurance (population 50,000+)"
- #71 on the list of "Top 101 cities with largest percentage of males in industries: wholesale trade (population 50,000+)"
- #73 on the list of "Top 101 cities with the lowest cost per building permit (population 50,000+)"
- #84 on the list of "Top 101 cities with largest percentage of males in occupations: community and social service occupations (population 50,000+)"
- #85 on the list of "Top 101 cities with the most residents born in United Kingdom (population 500+)"
- #85 on the list of "Top 101 cities with the most residents born in Yugoslavia (population 500+)"
- #85 on the list of "Top 101 cities with the most residents born in Asia, n.e.c. (population 500+)"
- #2 on the list of "Top 101 counties with highest percentage of residents voting for Obama (Democrat) in the 2012 Presidential Election"
- #17 on the list of "Top 101 counties with the most Catholic congregations"
- #19 on the list of "Top 101 counties with the lowest Particulate Matter (PM10) Annual air pollution readings in 2012 (µg/m3)"
- #24 on the list of "Top 101 counties with the highest percentage of residents that visited a dentist within the past year"
- #29 on the list of "Top 101 counties with the most Mainline Protestant congregations"

|
|
Total of 372 patent applications in 2008-2024.