Hartford, Connecticut

Hartford: Hartford in Fall
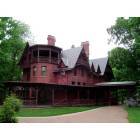
Hartford: Mark Twain's house

Hartford: The Bushnell Capitol building, Hartford, CT

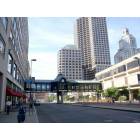
Hartford: hartford skyline 2

Hartford: In Bushnell Park looking at CityPlace and skyline

Hartford: Geese and goslings at the historic Cedar Hill Cemetery

Hartford: hartford-downtown-10/01/2005

Hartford: Frozen Park Pond
Hartford: HARTFORD, CT - TRUMBULL STREET

Hartford: In Bushnell Park looking at CityPlace and skyline

Hartford: The Central Business District skyline
- see
53
more - add
your
Submit your own pictures of this city and show them to the world
- OSM Map
- General Map
- Google Map
- MSN Map
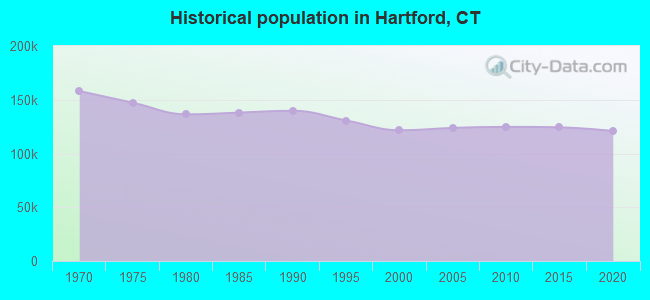
Population change since 2000: -0.7%
 |
| Males: 60,091 | |
| Females: 60,595 |
| Median resident age: | 32.4 years |
| Connecticut median age: | 40.9 years |
Zip codes: 06095, 06103, 06105, 06106, 06110, 06112, 06114, 06117, 06120, 06160.
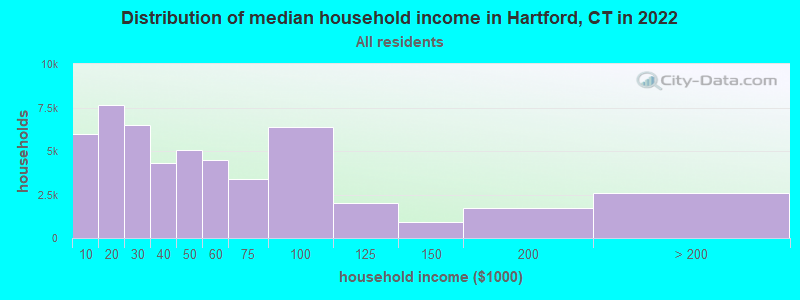
Hartford Zip Code Map| Hartford: | $41,529 |
| CT: | $88,429 |
Estimated per capita income in 2022: $27,000 (it was $13,428 in 2000)
Hartford city income, earnings, and wages data
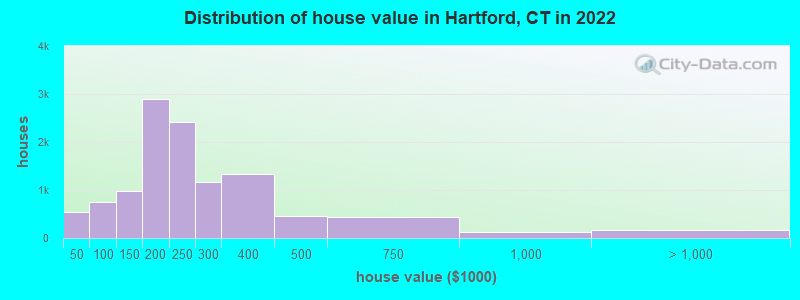
Estimated median house or condo value in 2022: $244,800 (it was $95,300 in 2000)
| Hartford: | $244,800 |
| CT: | $347,200 |
Mean prices in 2022: all housing units: $247,409; detached houses: $233,181; townhouses or other attached units: $243,845; in 2-unit structures: $299,257; in 3-to-4-unit structures: $276,150; in 5-or-more-unit structures: $166,656; mobile homes: $162,468
Median gross rent in 2022: $1,150.
(16.1% for White Non-Hispanic residents, 19.6% for Black residents, 38.3% for Hispanic or Latino residents, 17.5% for American Indian residents, 35.8% for other race residents, 25.6% for two or more races residents)
Detailed information about poverty and poor residents in Hartford, CT


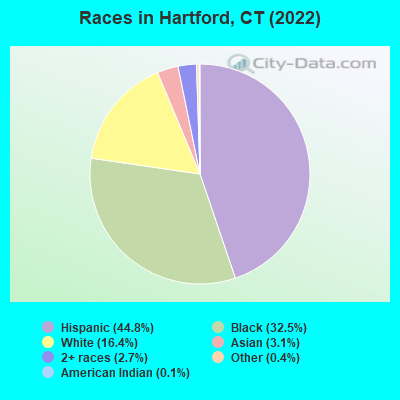
- 54,05044.8%Hispanic
- 39,24532.5%Black alone
- 19,83516.4%White alone
- 3,7113.1%Asian alone
- 3,2002.7%Two or more races
- 4610.4%Other race alone
- 1800.1%American Indian alone
Races in Hartford detailed stats: ancestries, foreign born residents, place of birth
According to our research of Connecticut and other state lists, there were 554 registered sex offenders living in Hartford, Connecticut as of April 27, 2024.
The ratio of all residents to sex offenders in Hartford is 223 to 1.
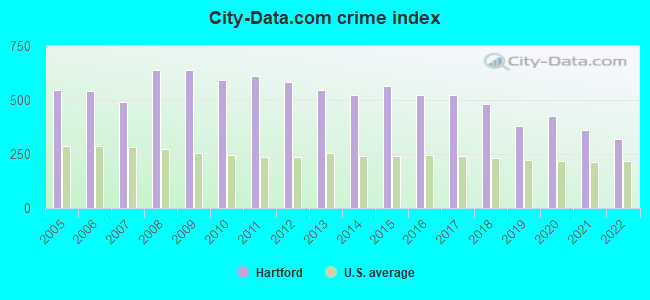
The City-Data.com crime index weighs serious crimes and violent crimes more heavily. Higher means more crime, U.S. average is 246.1. It adjusts for the number of visitors and daily workers commuting into cities.
- means the value is smaller than the state average.- means the value is about the same as the state average.
- means the value is bigger than the state average.
- means the value is much bigger than the state average.
Crime rate in Hartford detailed stats: murders, rapes, robberies, assaults, burglaries, thefts, arson
Full-time law enforcement employees in 2021, including police officers: 419 (395 officers - 339 male; 56 female).
| Officers per 1,000 residents here: | 3.26 |
| Connecticut average: | 2.10 |
 Recent articles from our blog. Our writers, many of them Ph.D. graduates or candidates, create easy-to-read articles on a wide variety of topics.

 | Hartford and North Hardford Area (0 replies) |
| Need a dermatologist specializing in adult acne (0 replies) |
Latest news from Hartford, CT collected exclusively by city-data.com from local newspapers, TV, and radio stations
Ancestries: Jamaican (12.8%), American (2.5%), Italian (1.8%), African (1.7%), Yugoslavian (1.1%).
Current Local Time: EST time zone
Incorporated on 05/1784
Elevation: 75 feet
Land area: 17.3 square miles.
Population density: 6,974 people per square mile (high).
26,918 residents are foreign born (16.2% Latin America).
| This city: | 22.1% |
| Connecticut: | 15.0% |
Median real estate property taxes paid for housing units with mortgages in 2022: $4,622 (1.8%)
Median real estate property taxes paid for housing units with no mortgage in 2022: $4,176 (1.9%)
Nearest city with pop. 200,000+: North Hempstead, NY  (85.0 miles , pop. 222,611).
Nearest city with pop. 1,000,000+: Bronx, NY (88.3 miles , pop. 1,332,650).
Nearest cities:
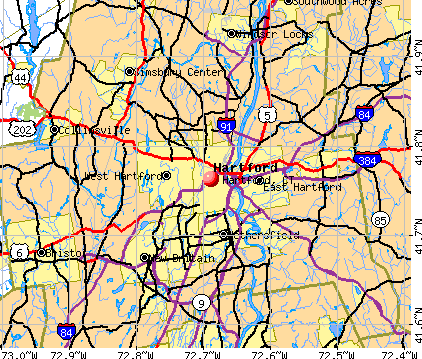
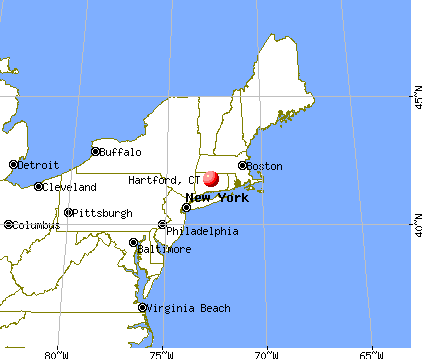
), ), Latitude: 41.76 N, Longitude: 72.69 W
Daytime population change due to commuting: +43,073 (+35.7%)
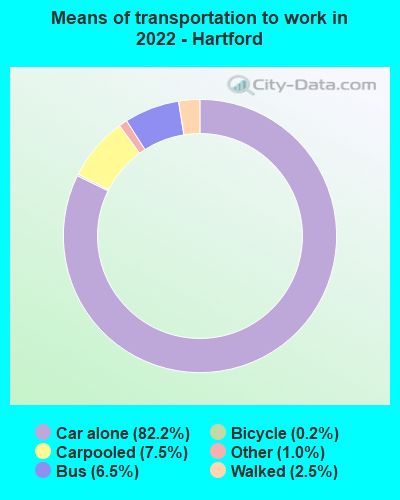
Workers who live and work in this city: 22,411 (41.5%)
Area codes: 860, 959

Detailed articles:
- Hartford: Introduction
- Hartford Basic Facts
- Hartford: Communications
- Hartford: Convention Facilities
- Hartford: Economy
- Hartford: Education and Research
- Hartford: Geography and Climate
- Hartford: Health Care
- Hartford: History
- Hartford: Municipal Government
- Hartford: Population Profile
- Hartford: Recreation
- Hartford: Transportation
Hartford tourist attractions:
- Bushnell Park, Hartford, CT - Hartford, Connecticut - Downtown Park Provides Setting for Activities and Boasts Only Municipal Park Art Gallery in All of State
- Hartford Marriott Downtown, CT - Hartford, Connecticut- Fully Equipped Luxury Hotel in Downtown of Connecticut Capital
- Mark Twain House, Hartford, CT - Hartford, Connecticut - Great American Author's Nineteenth Century Mansion Home Open to Visitors in Connecticut Capitol
- Elizabeth Park
- Connecticut State Library and State Archives
- Connecticut Science Center
- Connecticut State Capitol
- Connecticut Convention Center
- Connecticut Historical Society
- Christ Church Cathedral
- Cedar Hill Cemetery
- Cathedral of St Joseph
- Butler-McCook Homestead
- Bushnell Center for Performing Arts
- Goodwin Park
- Harriet Beecher Stowe Center
- Hartford Armory
- Hartford Children's Theatre
- Hartford Downtown Farmers' Market
- Hartford Police Museum
- Hartford Stage Company
- Isham-Terry House
- Mozzicato Caffe
- Museum of Connecticut History
- The Hartford Conservatory
- TheaterWorks
- Travelers Tower
- Wadsworth Atheneum, Hartford, CT - Hartford, Connecticut - Oldest Art Museum in US Hosts Varied Collection in Downtown Hartford
Hartford, Connecticut accommodation & food services, waste management - Economy and Business Data
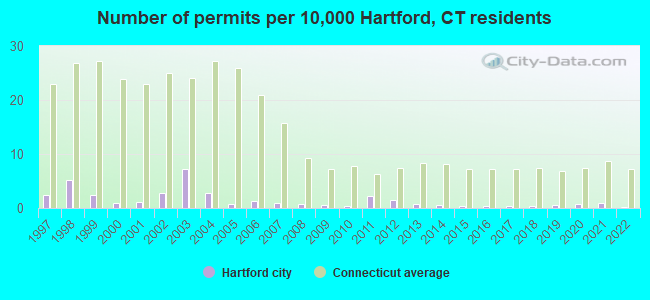
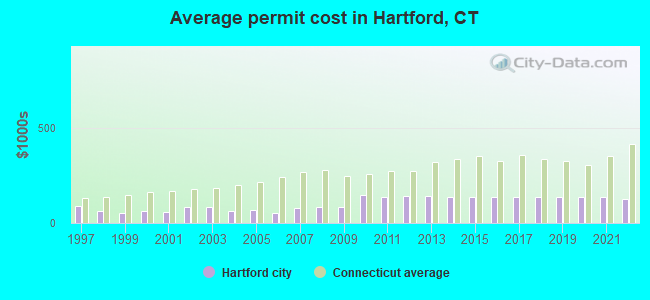
Single-family new house construction building permits:
- 2022: 2 buildings, average cost: $125,000
- 2021: 11 buildings, average cost: $134,500
- 2020: 10 buildings, average cost: $134,500
- 2019: 7 buildings, average cost: $134,500
- 2018: 5 buildings, average cost: $134,500
- 2017: 5 buildings, average cost: $134,500
- 2016: 5 buildings, average cost: $134,500
- 2015: 4 buildings, average cost: $134,500
- 2014: 7 buildings, average cost: $134,500
- 2013: 10 buildings, average cost: $141,300
- 2012: 18 buildings, average cost: $141,300
- 2011: 27 buildings, average cost: $135,600
- 2010: 4 buildings, average cost: $146,300
- 2009: 7 buildings, average cost: $85,700
- 2008: 8 buildings, average cost: $82,500
- 2007: 12 buildings, average cost: $80,000
- 2006: 15 buildings, average cost: $52,000
- 2005: 9 buildings, average cost: $69,300
- 2004: 33 buildings, average cost: $63,600
- 2003: 87 buildings, average cost: $82,800
- 2002: 34 buildings, average cost: $83,700
- 2001: 14 buildings, average cost: $60,100
- 2000: 11 buildings, average cost: $61,100
- 1999: 30 buildings, average cost: $52,600
- 1998: 64 buildings, average cost: $64,200
- 1997: 29 buildings, average cost: $89,000
| Here: | 4.0% |
| Connecticut: | 3.9% |
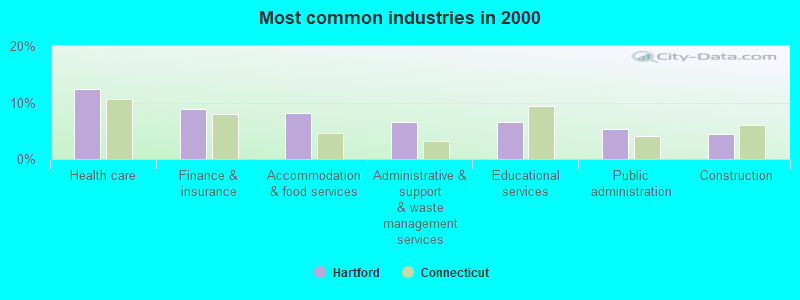
- Health care (12.3%)
- Finance & insurance (8.8%)
- Accommodation & food services (8.2%)
- Administrative & support & waste management services (6.6%)
- Educational services (6.6%)
- Public administration (5.4%)
- Construction (4.4%)
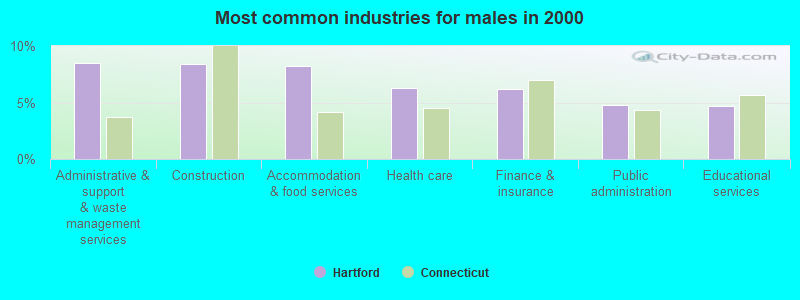
- Administrative & support & waste management services (8.5%)
- Construction (8.4%)
- Accommodation & food services (8.3%)
- Health care (6.3%)
- Finance & insurance (6.2%)
- Public administration (4.8%)
- Educational services (4.7%)
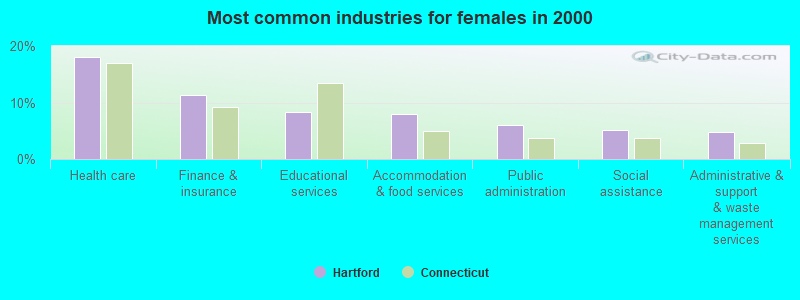
- Health care (18.1%)
- Finance & insurance (11.3%)
- Educational services (8.4%)
- Accommodation & food services (8.1%)
- Public administration (5.9%)
- Social assistance (5.2%)
- Administrative & support & waste management services (4.7%)
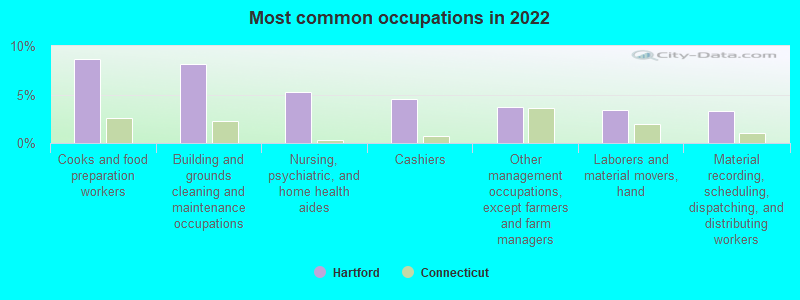
- Cooks and food preparation workers (8.7%)
- Building and grounds cleaning and maintenance occupations (8.1%)
- Nursing, psychiatric, and home health aides (5.3%)
- Cashiers (4.5%)
- Other management occupations, except farmers and farm managers (3.7%)
- Laborers and material movers, hand (3.4%)
- Material recording, scheduling, dispatching, and distributing workers (3.3%)
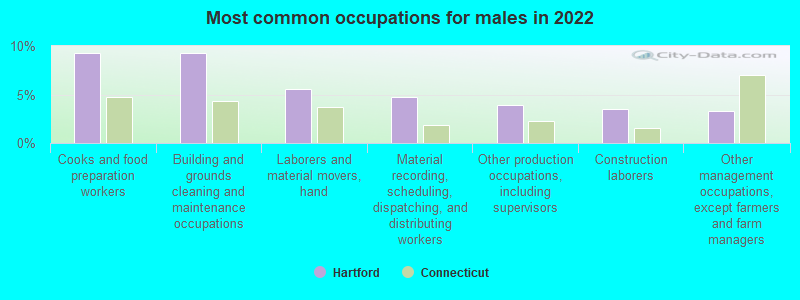
- Cooks and food preparation workers (9.3%)
- Building and grounds cleaning and maintenance occupations (9.3%)
- Laborers and material movers, hand (5.6%)
- Material recording, scheduling, dispatching, and distributing workers (4.7%)
- Other production occupations, including supervisors (3.9%)
- Construction laborers (3.5%)
- Other management occupations, except farmers and farm managers (3.3%)
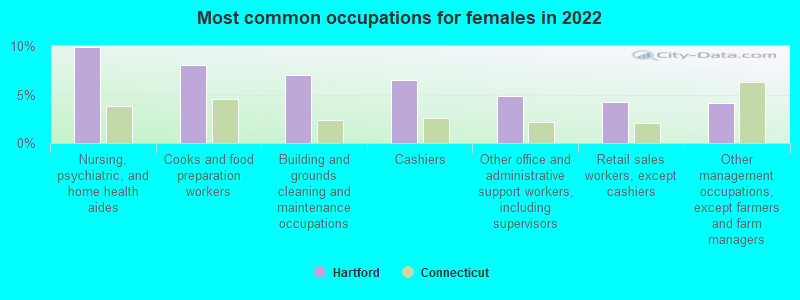
- Nursing, psychiatric, and home health aides (9.9%)
- Cooks and food preparation workers (8.0%)
- Building and grounds cleaning and maintenance occupations (7.0%)
- Cashiers (6.4%)
- Other office and administrative support workers, including supervisors (4.8%)
- Retail sales workers, except cashiers (4.3%)
- Other management occupations, except farmers and farm managers (4.1%)
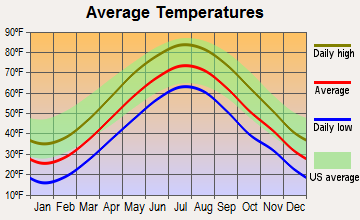
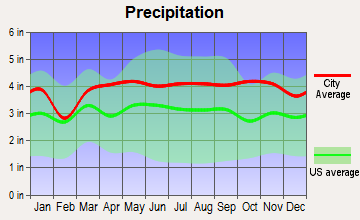
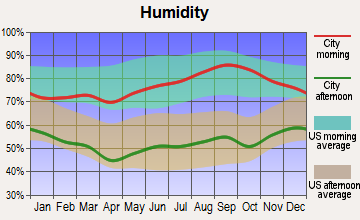
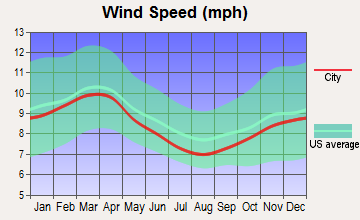
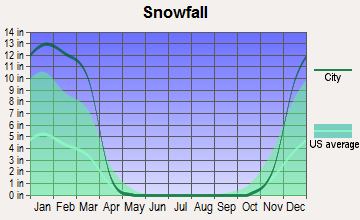
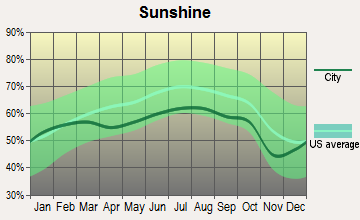
Average climate in Hartford, Connecticut
Based on data reported by over 4,000 weather stations
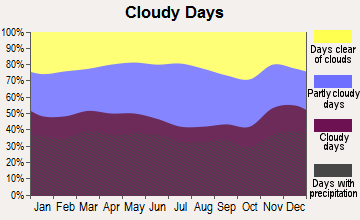
(lower is better)
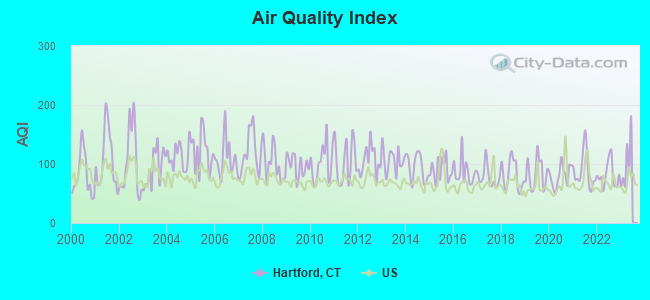
Air Quality Index (AQI) level in 2022 was 81.4. This is about average.
| City: | 81.4 |
| U.S.: | 72.6 |
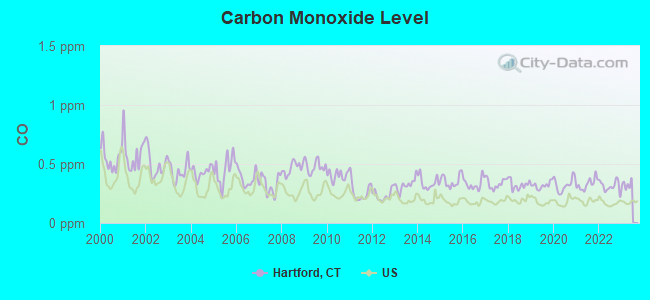
Carbon Monoxide (CO) [ppm] level in 2022 was 0.312. This is worse than average. Closest monitor was 0.4 miles away from the city center.
| City: | 0.312 |
| U.S.: | 0.251 |
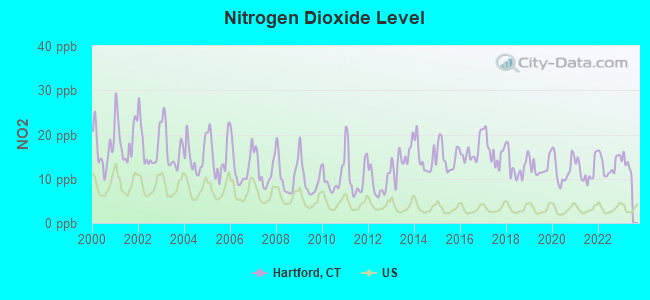
Nitrogen Dioxide (NO2) [ppb] level in 2022 was 13.2. This is significantly worse than average. Closest monitor was 0.4 miles away from the city center.
| City: | 13.2 |
| U.S.: | 5.1 |
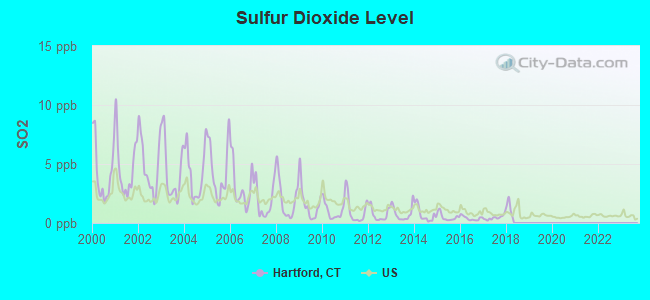
Sulfur Dioxide (SO2) [ppb] level in 2017 was 0.453. This is significantly better than average. Closest monitor was 0.4 miles away from the city center.
| City: | 0.453 |
| U.S.: | 1.515 |
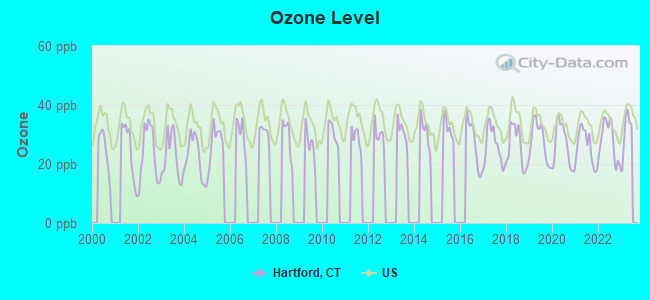
Ozone [ppb] level in 2022 was 27.9. This is about average. Closest monitor was 0.4 miles away from the city center.
| City: | 27.9 |
| U.S.: | 33.3 |
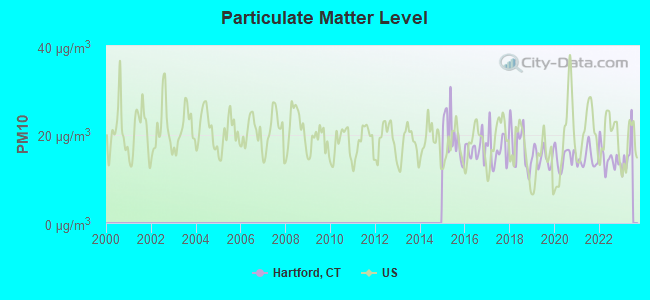
Particulate Matter (PM10) [µg/m3] level in 2022 was 14.6. This is better than average. Closest monitor was 0.8 miles away from the city center.
| City: | 14.6 |
| U.S.: | 19.2 |
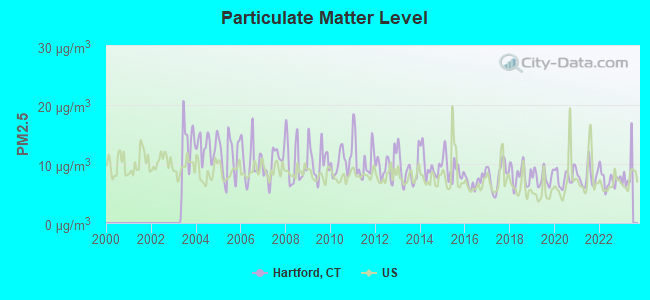
Particulate Matter (PM2.5) [µg/m3] level in 2022 was 7.37. This is about average. Closest monitor was 0.8 miles away from the city center.
| City: | 7.37 |
| U.S.: | 8.11 |
Tornado activity:
Hartford-area historical tornado activity is slightly above Connecticut state average. It is 18% smaller than the overall U.S. average.
On 10/3/1979, a category F4 (max. wind speeds 207-260 mph) tornado 8.2 miles away from the Hartford city center killed 3 people and injured 500 people and caused between $50,000,000 and $500,000,000 in damages.
On 7/10/1989, a category F4 tornado 28.6 miles away from the city center injured 40 people and caused between $50,000,000 and $500,000,000 in damages.
Earthquake activity:
Hartford-area historical earthquake activity is significantly above Connecticut state average. It is 70% smaller than the overall U.S. average.On 10/7/1983 at 10:18:46, a magnitude 5.3 (5.1 MB, 5.3 LG, 5.1 ML, Class: Moderate, Intensity: VI - VII) earthquake occurred 173.1 miles away from Hartford center
On 4/20/2002 at 10:50:47, a magnitude 5.3 (5.3 ML, Depth: 3.0 mi) earthquake occurred 196.9 miles away from the city center
On 4/20/2002 at 10:50:47, a magnitude 5.2 (5.2 MB, 4.2 MS, 5.2 MW, 5.0 MW) earthquake occurred 195.5 miles away from Hartford center
On 1/19/1982 at 00:14:42, a magnitude 4.7 (4.5 MB, 4.7 MD, 4.5 LG, Class: Light, Intensity: IV - V) earthquake occurred 132.3 miles away from Hartford center
On 10/16/2012 at 23:12:25, a magnitude 4.7 (4.7 ML, Depth: 10.0 mi) earthquake occurred 163.7 miles away from Hartford center
On 8/23/2011 at 17:51:04, a magnitude 5.8 (5.8 MW, Depth: 3.7 mi) earthquake occurred 385.5 miles away from the city center
Magnitude types: regional Lg-wave magnitude (LG), body-wave magnitude (MB), duration magnitude (MD), local magnitude (ML), surface-wave magnitude (MS), moment magnitude (MW)
Natural disasters:
The number of natural disasters in Hartford County (24) is greater than the US average (15).Major Disasters (Presidential) Declared: 13
Emergencies Declared: 11
Causes of natural disasters: Storms: 7, Hurricanes: 5, Floods: 4, Snowstorms: 4, Blizzards: 3, Snows: 3, Tropical Storms: 2, Winter Storms: 2, Snowfall: 1, Tornado: 1, Wind: 1 (Note: some incidents may be assigned to more than one category).
Main business address for: TRAVELERS INSURANCE CO (LIFE INSURANCE), PHOENIX COMPANIES INC/DE (LIFE INSURANCE), ING LIFE INSURANCE & ANNUITY CO (LIFE INSURANCE), HARTFORD FINANCIAL SERVICES GROUP INC/DE (INSURANCE AGENTS BROKERS & SERVICES), TRAVELERS LIFE & ANNUITY CO , TRAVELERS PROPERTY CASUALTY CORP (FIRE, MARINE & CASUALTY INSURANCE), AETNA INC /PA/ (HOSPITAL & MEDICAL SERVICE PLANS), UNITED TECHNOLOGIES CORP /DE/ (AIRCRAFT ENGINES & ENGINE PARTS) and 1 other public companies.
Hospitals in Hartford:
- CONNECTICUT CHILDRENS MEDICAL CENTER (Voluntary non-profit - Private, provides emergency services, 282 WASHINGTON STREET)
- HARTFORD HOSPITAL (Voluntary non-profit - Private, provides emergency services, 80 SEYMOUR STREET)
- HEALTHSOUTH CONNECTICUT SURGERY CENTER (81 GILLETT STREET)
- INSTITUTE OF LIVING (400 WASHINGTON ST)
- REHABILITATION HOSPITAL OF CONNECTICUT,THE (490 BLUE HILLS AVENUE)
- ST FRANCIS HOSPITAL & MEDICAL CENTER (Voluntary non-profit - Church, 114 WOODLAND STREET)
Nursing Homes in Hartford:
- AVERY NURSING HOME (705 NEW BRITAIN AVE)
- CHELSEA PLACE CARE CENTER (25 LORRAINE ST)
- ELLIS MANOR (210 GEORGE ST)
- HEBREW HOME AND HOSPITAL, ICF (615 TOWER AVE)
- LORRAINE MANOR (25 LORRAINE ST)
- NOBLE BLDG ICF (705 NEW BRITAIN AVE)
- PARK PLACE HEALTH CENTER (5 GREENWOOD ST)
- TRINITY HILL CARE CENTER (151 HILLSIDE AVE)
Dialysis Facilities in Hartford:
- FMC OF HARTFORD (3580 MAIN STREET, SUITE 3)
- HARTFORD DIALYSIS (675 TOWER AVENUE)
- HARTFORD HOSPITAL (80 SEYMOUR STREET, JB8)
Home Health Centers in Hartford:
- AVERY HEIGHTS HOME HEALTH AGENCY (705 NEW BRITAIN AVE)
- CARE-AT HOME INC (243 FARMINGTON AVE)
- MASONICARE PARTNERS HOME HEALTH AND HOSPICE, INC (95 WOODLAND ST)
- PRIMARY PREVENTION HOME CARE, LLC (60 GILLETT STREET, SUITE 200)
- URBAN NURSING AND COMMUNITY CARE, LLC (1229 ALBANY AVENUE)
- VNA HEALTH CARE, INC (103 WOODLAND STREET)
Airports and heliports located in Hartford:
- Hartford-Brainard Airport (HFD) (Runways: 5, Air Taxi Ops: 5,522, Itinerant Ops: 36,927, Local Ops: 38,500, Military Ops: 525)
- Delta One Heliport (CT06)
- Hartford Hospital Heliport (0CT9)
- South Meadows Heliport (CT73)
- St Francis Hospital Heliport (0CT5)
Amtrak station:
HARTFORD (1 UNION PLACE) . Services: ticket office, partially wheelchair accessible, enclosed waiting area, public restrooms, public payphones, full-service food facilities, snack bar, vending machines, ATM, paid short-term parking, paid long-term parking, call for car rental service, taxi stand, intercity bus service, public transit connection.Colleges/Universities in Hartford:
- Capital Community College (Full-time enrollment: 2,609; Location: 950 Main Street; Public; Website: www.ccc.commnet.edu)
- Trinity College (Full-time enrollment: 2,355; Location: 300 Summit St; Private, not-for-profit; Website: www.Trincoll.edu; Offers Master's degree)
- Lincoln Technical Institute-Hartford (Full-time enrollment: 436; Location: 85 Sigourney Street; Private, for-profit; Website: www.lincolnedu.com)
- Rensselaer Hartford Graduate Center Inc (Full-time enrollment: 140; Location: 275 Windsor St; Private, not-for-profit; Website: ewp.rpi.edu/index.html; Offers Master's degree)
- Albert I Prince Technical High School (Full-time enrollment: 63; Location: 401 Flatbush Avenue; Public; Website: www.cttech.org/prince/)
- Hartford Seminary (Full-time enrollment: 58; Location: 77 Sherman Street; Private, not-for-profit; Website: www.hartsem.edu; Offers Doctor's degree)
- Lincoln College of New England-Hartford (Full-time enrollment: 8; Location: 85 Sigourney Street; Private, for-profit; Website: www.lincolncollegene.edu)
Other colleges/universities with over 2000 students near Hartford:
- University of Hartford (about 3 miles; West Hartford, CT; Full-time enrollment: 6,398)
- Goodwin College (about 3 miles; East Hartford, CT; FT enrollment: 3,017)
- Manchester Community College (about 7 miles; Manchester, CT; FT enrollment: 4,667)
- Central Connecticut State University (about 7 miles; New Britain, CT; FT enrollment: 9,989)
- Tunxis Community College (about 11 miles; Farmington, CT; FT enrollment: 2,787)
- Wesleyan University (about 15 miles; Middletown, CT; FT enrollment: 3,517)
- Bay Path College (about 21 miles; Longmeadow, MA; FT enrollment: 2,085)
Biggest public high schools in Hartford:
- BULKELEY HIGH SCHOOL UPPER SCHOOL (Students: 1,230, Location: 300 WETHERSFIELD AVENUE, Grades: 11-12)
- BULKELEY HIGH SCHOOL LOWER SCHOOL (Students: 1,230, Location: 300 WETHERSFIELD AVENUE, Grades: 9-10)
- A. I. PRINCE TECHNICAL HIGH SCHOOL (Students: 610, Location: 500 BROOKFIELD STREET, Grades: 9-12)
- SPORTS AND MEDICAL SCIENCES ACADEMY (Students: 318, Location: 275 ASYLUM STREET, Grades: 6-12)
- CAPITAL PREPARATORY MAGNET SCHOOL (Students: 142, Location: 950 MAIN STREET, Grades: PK-12)
- HARTFORD CORRECTIONAL CENTER (Students: 32, Location: 177 WESTON STREET, Grades: 10-12)
- RIVER STREET EARLY LEARNING CENTER (SITE 2) (Location: 34 SEQUASSEN STREET, Grades: PK-9)
- ACADEMY OF AEROSPACE AND ENGINEERING (Location: 15 VERNON STREET, Grades: 6-12)
- TWO RIVERS MAGNET HIGH SCHOOL (Location: 55 VAN DYKE AVENUE, Grades: 9-11)
- R.J. KINSELLA MAGNET SCHOOL OF PERFORMING ARTS (Location: 65 VAN BLOCK AVENUE, Grades: PK-11)
Private high schools in Hartford:
Biggest public elementary/middle schools in Hartford:
- M. D. FOX ELEMENTARY SCHOOL (Students: 925, Location: 470 MAPLE AVENUE, Grades: PK-8)
- KENNELLY SCHOOL (Students: 821, Location: 180 WHITE STREET, Grades: PK-8)
- WEST MIDDLE SCHOOL (Students: 795, Location: 927 ASYLUM AVENUE, Grades: KG-8)
- M. L. KING SCHOOL (Students: 792, Location: 25 RIDGEFIELD STREET, Grades: PK-8)
- PARKVILLE COMMUNITY SCHOOL (Students: 664, Location: 1755 PARK STREET, Grades: PK-5)
- BATCHELDER SCHOOL (Students: 586, Location: 757 NEW BRITAIN AVENUE, Grades: PK-8)
- NOAH WEBSTER MICRO SOCIETY SCHOOL (Students: 562, Location: 5 CONE STREET, Grades: PK-8)
- SANCHEZ SCHOOL (Students: 559, Location: 176 BABCOCK STREET, Grades: PK-5)
- MILNER ELEMENTARY SCHOOL (Students: 501, Location: 104 VINE STREET, Grades: PK-8)
- BURR SCHOOL (Students: 475, Location: 400 WETHERSFIELD AVENUE, Grades: PK-8)
Private elementary/middle schools in Hartford:
User-submitted facts and corrections:
- Please post the website to Hartford Public High School. The site url is http://hartfordpublic.tripod.com
- You currently have the following post: BOSTON BARTENDERS SCHOOL OF AMERICA (Location: 614 ASYLUM AVE; Private, for-profit) This school has moved and is currently at 48 Silas Deane Highway (296-0141) - only about five minutes from the previous location. Could you please make the correction. Thanks.
- Hartford Churches Allen Chapel AME Church 2233 Main Street, Hartford, CT www.allenchapelhartford.com
Points of interest:
Notable locations in Hartford: Artsworks Gallery (A), Soldiers and Sailors Memorial Arch (B), Terry Square (C), North Meadows Industrial Park (D), Colt Pier (E), Brainard Industrial Park (F), Lord Corner (G), Hartford Union Station (H), Goodwin Corner (I), Hartford Fire Department Company 11 (J), Hartford Fire Department Company 10 (K), Hartford Fire Department Company 8 (L), Hartford Fire Department Company 7 (M), Hartford Fire Department Company 5 (N), Hartford Fire Department Training Division (O), South West Recreation Center (P), Grom Hayes Library (Q), Goodwin Branch Hartford Public Library (R), Hartford Fire Department Company 9 (S), Campfield Avenue Branch Library (T). Display/hide their locations on the map
Shopping Centers: Bishop Plaza Shopping Center (1), Union Place Shopping Center (2), Twin City Shopping Plaza Shopping Center (3), Burr Mall Shopping Center (4), Pulaskin Mall Shopping Center (5), Bushnell Plaza Shopping Center (6), Pratt Street Shops Shopping Center (7), Pavillion at State House Shopping Center (8), Park Plaza Shopping Center (9). Display/hide their locations on the map
Main business address in Hartford include: TRAVELERS INSURANCE CO (A), PHOENIX COMPANIES INC/DE (B), ING LIFE INSURANCE & ANNUITY CO (C), HARTFORD FINANCIAL SERVICES GROUP INC/DE (D), TRAVELERS LIFE & ANNUITY CO (E), TRAVELERS PROPERTY CASUALTY CORP (F), AETNA INC /PA/ (G), UNITED TECHNOLOGIES CORP /DE/ (H). Display/hide their locations on the map
Churches in Hartford include: Saint James Episcopal Church (A), All Saints Orthodox Church (B), Asylum Avenue Church (C), Asylum Hill Congregational Church (D), Bethany Lutheran Church (E), Bethesda Baptist Church (F), Blackwell Memorial African Methodist Episcopal Zion Church (G), Blue Hills Baptist Church (H), Broadview Community Church (I). Display/hide their locations on the map
Cemeteries: Old North Cemetery (1), Old South Cemetery (2), Saint Patricks Cemetery (3), Spring Grove Cemetery (4), Zion Hill Cemetery (5), Ancient Cemetery (6). Display/hide their locations on the map
Reservoirs: Keney Park Pond (A), Lily Pond (B), Bell Pond (C). Display/hide their locations on the map
Streams, rivers, and creeks: Meadow Brook (A), Park River (B). Display/hide their locations on the map
Parks in Hartford include: Aaron Fien Square (1), Al-Marzook Athletic Fields (2), Ann Street Historic District (3), Asylum Avenue District Historic District (4), Asylum Avenue Green (5), Barnaby Park (6), Bellvue Square Park (7), Bowles Park (8), Brackett Park (9). Display/hide their locations on the map
Tourist attractions: Connecticut Historical Society Museum (1 Elizabeth Street), Mark Twain House & Museum - Administrative Office (351 Farmington Avenue), Old State House (Museums; 800 Main Street), John E Rogers African American Cultural Center Inc (Museums; 230 Scarborough Street), Hartford Medical Society (Museums; 230 Scarborough Street), Mark Twain House & Museum - Mark Twain Store (65 Forest Street), Antiquarian Landmark Society (Museums; 255 Main Street), Charter Oak Cultural Center (Museums; 21 Charter Oak Avenue), Butler McCook House and Garden (Museums; 394 Main Street).
Hotels: CRL Dream Travel Escapes (11 Burton St #2), Holiday Inn (50 Morgan St), Super 8 Motel of Hartford (57 West Service Road), Hilton Hartford Hotel (315 Trumbull Street), Red Roof Inns - Hartford (100 Weston Street), The Goodwin Hotel (One Haynes Street), Super 8 Hartford CT (57 West Service Road), Holiday Inn Express and Suites (185 Brainard Road), Bristol Bar and Grill (50 Morgan Street).
Courts: Connecticut State - Civil Court Information- Civil Clerk's Office- Hartford Judicial Dist (95 Washington Street), Connecticut State - Judicial Branch- Appellate Court (95 Washington Street Hartfo), Court House Parking (3 Grand Street), Judicial Branch - Statistician- Operations Director- Appellate Court- Judge Support Serv (100 Washington Street Rear), Judicial Branch - Superior Court- Community Court- Clerk's Office (80 Washington Street), United States Government - Courts Us- Us Bankruptcy Court- Us Circuit Court Judge Jon O Ne (450 Main Street), Connecticut State - Judicial Branch- Supreme Court- Office of Chief Court Administr (231 Capitol Avenue), Connecticut State - Judicial Branch- Appellate Court- Centralized Infractions Bu (100 Washington Street Rear), Hartford City - Probate Court (260 Constitution Plaza).
Birthplace of: Sol LeWitt - Conceptual artist, Rebecca Lobo - Professional women's basketball player, Stephanie McMahon - Professional wrestling personality, Nick Koback - Professional baseball player, L. Paul Bremer, George Tuska - Artist, J. P. Morgan - Financier, William Gillette - Actor, Stephenie Meyer - Author, Elizabeth May - Politician.
Drinking water stations with addresses in Hartford and their reported violations in the past:
CONNECTICUT VALLEY HOSPITAL (Population served: 3,132, Surface water):Past health violations:ORCHARD ACRES ASSOCIATION (Population served: 176, Groundwater):Past monitoring violations:
- MCL, Monthly (TCR) - In SEP-2009, Contaminant: Coliform. Follow-up actions: St Public Notif requested (OCT-15-2009), St Violation/Reminder Notice (OCT-15-2009), St Compliance achieved (OCT-31-2009), St Public Notif received (NOV-19-2009)
- Monitoring and Reporting (DBP) - Between JUL-2011 and SEP-2011, Contaminant: Chlorine. Follow-up actions: St Public Notif requested (JAN-10-2012), St Violation/Reminder Notice (JAN-10-2012), St Public Notif received (FEB-10-2012)
- Single Turbidity Exceed (Enhanced SWTR) - In FEB-2011, Contaminant: IESWTR. Follow-up actions: St Public Notif requested (MAR-15-2011), St Violation/Reminder Notice (MAR-15-2011), St Compliance achieved (APR-30-2011), St Public Notif received (MAY-02-2011)
- Monitoring and Reporting (DBP) - Between JAN-2011 and DEC-2011, Contaminant: TTHM. Follow-up actions: St Public Notif requested (MAR-09-2012), St Violation/Reminder Notice (MAR-09-2012), St Public Notif received (JUN-26-2012), St Compliance achieved (DEC-31-2012)
- Monitoring and Reporting (DBP) - Between JAN-2011 and DEC-2011, Contaminant: Total Haloacetic Acids (HAA5). Follow-up actions: St Public Notif requested (MAR-09-2012), St Violation/Reminder Notice (MAR-09-2012), St Public Notif received (JUN-26-2012), St Compliance achieved (DEC-31-2012)
- Monitoring and Reporting (DBP) - Between JUL-2007 and SEP-2007, Contaminant: Chlorine. Follow-up actions: St Violation/Reminder Notice (DEC-12-2007), St Compliance achieved (JAN-08-2008)
- 2 routine major monitoring violations
- 6 regular monitoring violations
- 2 other older monitoring violations
Past health violations:Past monitoring violations:
- MCL, Monthly (TCR) - In AUG-2012, Contaminant: Coliform. Follow-up actions: St Public Notif received (AUG-20-2012), St Public Notif requested (SEP-07-2012), St Violation/Reminder Notice (SEP-07-2012), St Compliance achieved (SEP-30-2012)
- MCL, Monthly (TCR) - In DEC-2011, Contaminant: Coliform. Follow-up actions: St Public Notif received (DEC-15-2011), St Public Notif requested (DEC-16-2011), St Violation/Reminder Notice (DEC-16-2011), St Compliance achieved (JAN-31-2012)
- MCL, Monthly (TCR) - In DEC-2010, Contaminant: Coliform. Follow-up actions: St Public Notif requested (DEC-22-2010), St Violation/Reminder Notice (DEC-22-2010), St Compliance achieved (JAN-31-2011)
- MCL, Monthly (TCR) - Between OCT-2010 and DEC-2010, Contaminant: Coliform. Follow-up actions: St Public Notif requested (DEC-09-2010), St Violation/Reminder Notice (DEC-09-2010), St Public Notif received (DEC-29-2010), St Compliance achieved (JAN-31-2011)
- Follow-up Or Routine LCR Tap M/R - In JAN-10-2007, Contaminant: Lead and Copper Rule. Follow-up actions: St Public Notif requested (MAR-16-2007), St Violation/Reminder Notice (MAR-16-2007), St Public Notif received (APR-27-2007), St Compliance achieved (DEC-31-2009)
Drinking water stations with addresses in Hartford that have no violations reported:
- METROPOLITAN DISTRICT COMMISSION (Population served: 388,700, Primary Water Source Type: Surface water)
| This city: | 2.6 people |
| Connecticut: | 2.5 people |
| This city: | 59.3% |
| Whole state: | 66.3% |
| This city: | 10.0% |
| Whole state: | 6.6% |
Likely homosexual households (counted as self-reported same-sex unmarried-partner households)
- Lesbian couples: 0.4% of all households
- Gay men: 0.4% of all households
People in group quarters in Hartford in 2010:
- 4,651 people in college/university student housing
- 1,095 people in local jails and other municipal confinement facilities
- 959 people in other noninstitutional facilities
- 777 people in nursing facilities/skilled-nursing facilities
- 531 people in emergency and transitional shelters (with sleeping facilities) for people experiencing homelessness
- 271 people in residential treatment centers for adults
- 192 people in group homes intended for adults
- 182 people in correctional residential facilities
- 153 people in workers' group living quarters and job corps centers
- 61 people in correctional facilities intended for juveniles
- 37 people in group homes for juveniles (non-correctional)
- 21 people in residential treatment centers for juveniles (non-correctional)
- 21 people in hospitals with patients who have no usual home elsewhere
People in group quarters in Hartford in 2000:
- 1,806 people in college dormitories (includes college quarters off campus)
- 920 people in nursing homes
- 901 people in state prisons
- 876 people in other noninstitutional group quarters
- 183 people in homes or halfway houses for drug/alcohol abuse
- 138 people in halfway houses
- 100 people in orthopedic wards and institutions for the physically handicapped
- 98 people in other group homes
- 92 people in mental (psychiatric) hospitals or wards
- 62 people in other nonhousehold living situations
- 56 people in hospitals or wards for drug/alcohol abuse
- 51 people in short-term care, detention or diagnostic centers for delinquent children
- 25 people in religious group quarters
- 16 people in other types of correctional institutions
- 16 people in homes for abused, dependent, and neglected children
- 15 people in homes for the mentally ill
Banks with most branches in Hartford (2011 data):
- Bank of America, National Association: 13 branches. Info updated 2009/11/18: Bank assets: $1,451,969.3 mil, Deposits: $1,077,176.8 mil, headquarters in Charlotte, NC, positive income, 5782 total offices, Holding Company: Bank Of America Corporation
- Webster Bank, National Association: Hartford Branch, Franklin Avenue Branch, Park Street Branch, Cityplace Branch. Info updated 2008/12/23: Bank assets: $18,674.3 mil, Deposits: $13,861.5 mil, headquarters in Waterbury, CT, positive income, Commercial Lending Specialization, 167 total offices, Holding Company: Webster Financial Corporation
- People's United Bank: Hartford Branch, Financial Plaza Branch, Franklin Avenue Branch, Hartford Stop And Shop Branch. Info updated 2012/02/16: Bank assets: $27,319.3 mil, Deposits: $20,835.4 mil, headquarters in Bridgeport, CT, positive income, Commercial Lending Specialization, 374 total offices
- Sovereign Bank, National Association: Franklin Avenue Branch at 568 Franklin Avenue, branch established on 1974/06/24; Hartford Central Branch at 115 Asylum St, branch established on 1965/08/31. Info updated 2012/01/31: Bank assets: $78,146.9 mil, Deposits: $48,042.9 mil, headquarters in Wilmington, DE, positive income, Commercial Lending Specialization, 718 total offices, Holding Company: Banco Santander, S.A.
- TD Bank, National Association: Trumbull Branch at 280 Trumbull Street, branch established on 1984/06/04; Broad Street Branch at 2035 Broad Steet, branch established on 2006/10/02. Info updated 2010/10/04: Bank assets: $188,912.6 mil, Deposits: $153,149.8 mil, headquarters in Wilmington, DE, positive income, 1314 total offices, Holding Company: Toronto-Dominion Bank, The
- Wells Fargo Bank, National Association: State House Square Branch at 30 State House Square, branch established on 1989/10/30; Hartford Pb Branch at 10 State House Square, branch established on 2010/05/07. Info updated 2011/04/05: Bank assets: $1,161,490.0 mil, Deposits: $905,653.0 mil, headquarters in Sioux Falls, SD, positive income, 6395 total offices, Holding Company: Wells Fargo & Company
- The Connecticut Bank and Trust Company: The Connecticut Bank And Trust Compa at 58 State House Square, branch established on 2004/03/12; St Francis Office Branch at 114 Woodland St, branch established on 2010/06/22. Info updated 2006/11/03: Bank assets: $280.5 mil, Deposits: $220.0 mil, local headquarters, negative income in the last year, Commercial Lending Specialization, 8 total offices
- First Niagara Bank, National Association: Parkville Branch at 1700 Park Street, branch established on 2005/09/26; Trumbull Street Branch at 225 Trumbull Street, branch established on 2010/04/12. Info updated 2011/06/09: Bank assets: $32,750.6 mil, Deposits: $19,595.4 mil, headquarters in Buffalo, NY, positive income, Commercial Lending Specialization, 351 total offices, Holding Company: First Niagara Financial Group, Inc.
- RBS Citizens, National Association: Trumbull Street Hartford Branch at 190 Trumbull Street, branch established on 2006/02/27. Info updated 2007/09/19: Bank assets: $106,940.6 mil, Deposits: $75,690.2 mil, headquarters in Providence, RI, positive income, 1135 total offices, Holding Company: Uk Financial Investments Limited
For population 15 years and over in Hartford:
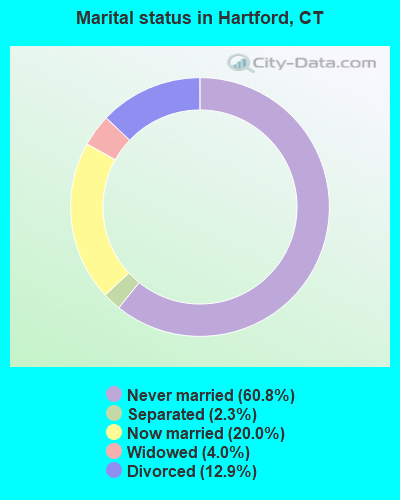
- Never married: 60.8%
- Now married: 20.0%
- Separated: 2.3%
- Widowed: 4.0%
- Divorced: 12.9%
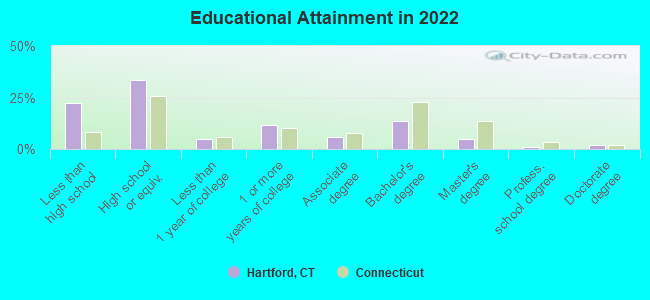
For population 25 years and over in Hartford:
- High school or higher: 77.4%
- Bachelor's degree or higher: 21.5%
- Graduate or professional degree: 7.8%
- Unemployed: 15.9%
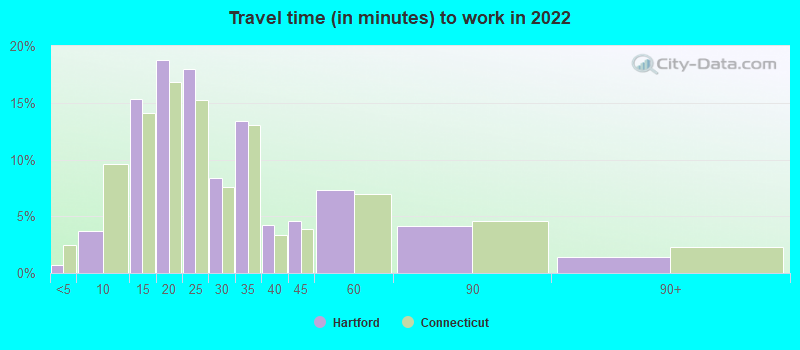
- Mean travel time to work (commute): 21.9 minutes
| Here: | 17.8 |
| Connecticut average: | 12.6 |
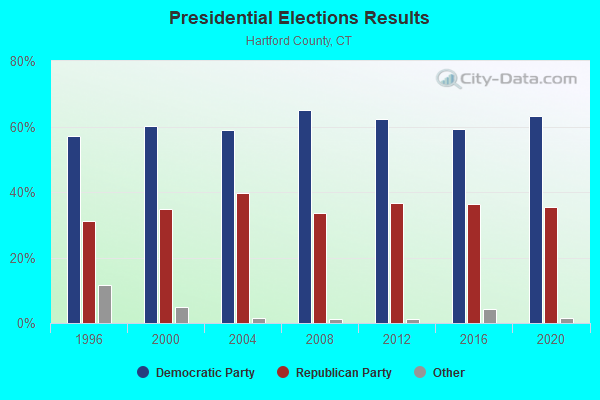
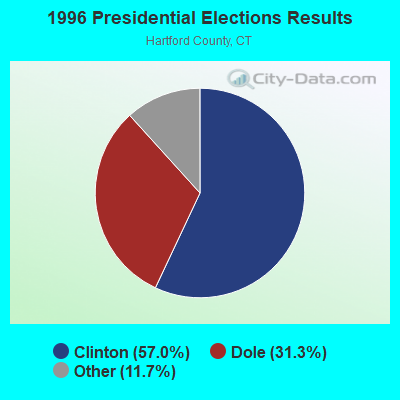
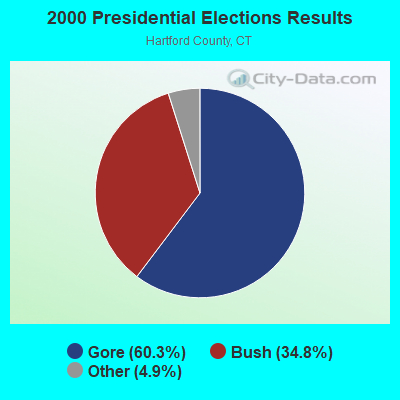
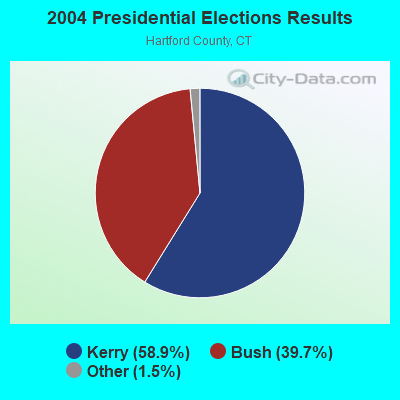
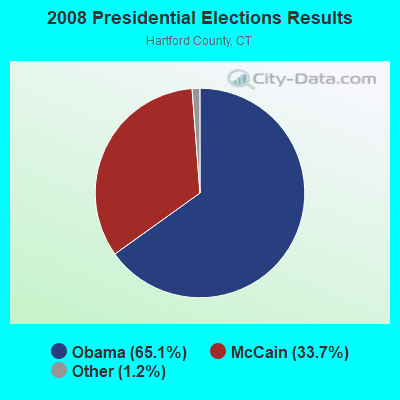
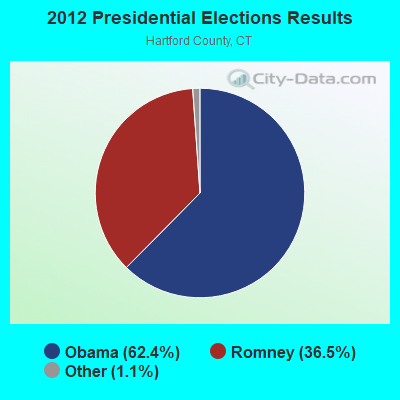
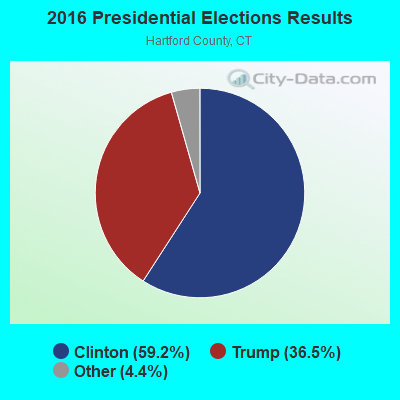
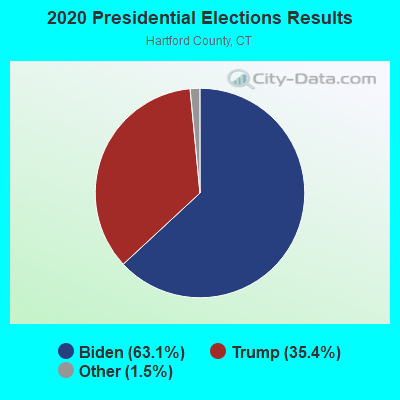
Graphs represent county-level data. Detailed 2008 Election Results
Neighborhoods in Hartford:
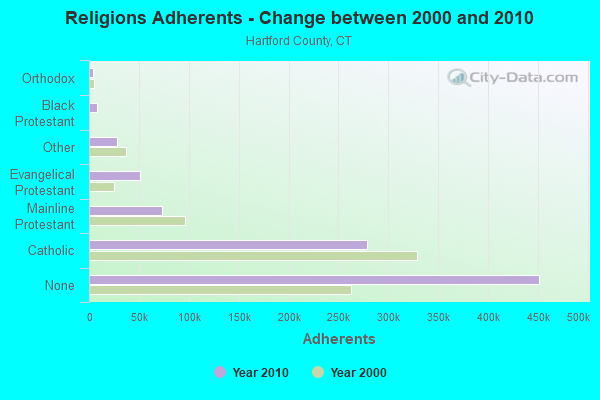
(Hartford, Connecticut Neighborhood Map)Religion statistics for Hartford, CT (based on Hartford County data)
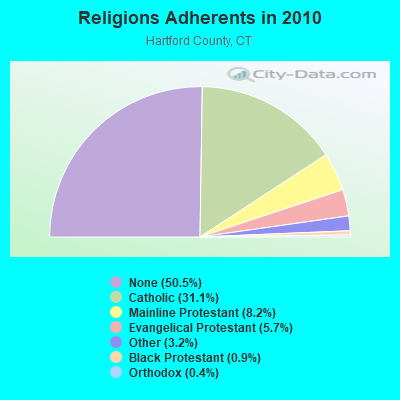
| Religion | Adherents | Congregations |
|---|---|---|
| Catholic | 278,203 | 100 |
| Mainline Protestant | 73,522 | 183 |
| Evangelical Protestant | 50,619 | 214 |
| Other | 28,183 | 94 |
| Black Protestant | 8,446 | 26 |
| Orthodox | 3,665 | 13 |
| None | 451,376 | - |
Food Environment Statistics:
| Hartford County: | 2.46 / 10,000 pop. |
| Connecticut: | 2.21 / 10,000 pop. |
| This county: | 0.06 / 10,000 pop. |
| Connecticut: | 0.07 / 10,000 pop. |
| Hartford County: | 1.05 / 10,000 pop. |
| Connecticut: | 1.02 / 10,000 pop. |
| This county: | 2.32 / 10,000 pop. |
| Connecticut: | 2.27 / 10,000 pop. |
| Hartford County: | 8.63 / 10,000 pop. |
| Connecticut: | 9.19 / 10,000 pop. |
| Hartford County: | 7.4% |
| State: | 7.3% |
| This county: | 22.1% |
| Connecticut: | 21.5% |
| Hartford County: | 16.0% |
| Connecticut: | 15.8% |
Health and Nutrition:
| This city: | 46.4% |
| State: | 50.0% |
| Hartford: | 45.2% |
| Connecticut: | 47.5% |
| Hartford: | 28.9 |
| State: | 28.7 |
| Hartford: | 20.9% |
| Connecticut: | 20.9% |
| Hartford: | 11.7% |
| State: | 10.5% |
| Hartford: | 6.7 |
| Connecticut: | 6.8 |
| Hartford: | 32.2% |
| Connecticut: | 34.2% |
| Hartford: | 53.8% |
| State: | 56.4% |
| Hartford: | 81.7% |
| Connecticut: | 78.9% |
More about Health and Nutrition of Hartford, CT Residents
| Local government employment and payroll (March 2019) | |||||
| Function | Full-time employees | Monthly full-time payroll | Average yearly full-time wage | Part-time employees | Monthly part-time payroll |
|---|---|---|---|---|---|
| Elementary and Secondary - Instruction | 2,427 | $14,698,710 | $72,676 | 201 | $552,176 |
| Elementary and Secondary - Other Total | 810 | $3,316,536 | $49,134 | 275 | $456,477 |
| Police Protection - Officers | 424 | $3,509,824 | $99,335 | 0 | $0 |
| Firefighters | 354 | $1,171,980 | $39,728 | 0 | $0 |
| Welfare | 134 | $414,663 | $37,134 | 128 | $206,283 |
| Other Government Administration | 94 | $535,961 | $68,421 | 6 | $14,512 |
| Local Libraries | 92 | $367,131 | $47,887 | 47 | $82,566 |
| Financial Administration | 90 | $621,590 | $82,879 | 0 | $0 |
| Solid Waste Management | 85 | $380,359 | $53,698 | 0 | $0 |
| Other and Unallocable | 67 | $439,221 | $78,666 | 3 | $6,134 |
| Housing and Community Development (Local) | 66 | $302,454 | $54,992 | 0 | $0 |
| Health | 52 | $263,535 | $60,816 | 2 | $1,957 |
| Streets and Highways | 43 | $118,424 | $33,049 | 0 | $0 |
| Police - Other | 34 | $155,004 | $54,707 | 61 | $54,434 |
| Parks and Recreation | 33 | $143,486 | $52,177 | 0 | $0 |
| Judicial and Legal | 12 | $52,897 | $52,897 | 0 | $0 |
| Fire - Other | 8 | $25,073 | $37,610 | 5 | $5,708 |
| Sewerage | 5 | $37,836 | $90,806 | 0 | $0 |
| Totals for Government | 4,830 | $26,554,685 | $65,974 | 728 | $1,380,247 |
Hartford government finances - Expenditure in 2021 (per resident):
- Construction - General - Other: $66,316,000 ($549.49)
Elementary and Secondary Education: $45,805,000 ($379.54)
- Current Operations - Elementary and Secondary Education: $366,580,000 ($3037.47)
General - Other: $136,007,000 ($1126.95)
Housing and Community Development: $58,340,000 ($483.40)
Police Protection: $55,646,000 ($461.08)
Regular Highways: $14,998,000 ($124.27)
Health - Other: $12,942,000 ($107.24)
Libraries: $11,509,000 ($95.36)
Central Staff Services: $9,464,000 ($78.42)
Parking Facilities: $5,588,000 ($46.30)
Financial Administration: $5,261,000 ($43.59)
Solid Waste Management: $2,681,000 ($22.21)
Parks and Recreation: $2,360,000 ($19.55)
Judicial and Legal Services: $1,856,000 ($15.38)
Public Welfare - Other: $418,000 ($3.46)
- General - Interest on Debt: $21,588,000 ($178.88)
- Intergovernmental to Local - Other - Elementary and Secondary Education: $59,711,000 ($494.76)
- Other Capital Outlay - Elementary and Secondary Education: $8,125,000 ($67.32)
General - Other: $5,693,000 ($47.17)
- Total Salaries and Wages: $205,415,000 ($1702.06)
Hartford government finances - Revenue in 2021 (per resident):
- Charges - Other: $10,446,000 ($86.56)
Parking Facilities: $7,844,000 ($65.00)
Parks and Recreation: $3,369,000 ($27.92)
Elementary and Secondary Education School Lunch: $480,000 ($3.98)
Solid Waste Management: $118,000 ($0.98)
Elementary and Secondary Education - Other: $86,000 ($0.71)
Regular Highways: $1,000 ($0.01)
- Federal Intergovernmental - Housing and Community Development: $56,771,000 ($470.40)
- Miscellaneous - Interest Earnings: $10,885,000 ($90.19)
General Revenue - Other: $10,314,000 ($85.46)
Donations From Private Sources: $1,233,000 ($10.22)
Rents: $693,000 ($5.74)
Fines and Forfeits: $161,000 ($1.33)
- State Intergovernmental - Education: $394,517,000 ($3268.95)
Other: $71,462,000 ($592.13)
General Local Government Support: $57,708,000 ($478.17)
Health and Hospitals: $12,943,000 ($107.25)
Highways: $1,188,000 ($9.84)
Housing and Community Development: $3,000 ($0.02)
- Tax - Property: $299,217,000 ($2479.30)
Other License: $8,051,000 ($66.71)
Occupation and Business License - Other: $247,000 ($2.05)
Hartford government finances - Debt in 2021 (per resident):
- Long Term Debt - Beginning Outstanding - Unspecified Public Purpose: $565,809,000 ($4688.27)
Outstanding Unspecified Public Purpose: $529,208,000 ($4385.00)
Retired Unspecified Public Purpose: $36,601,000 ($303.27)
Hartford government finances - Cash and Securities in 2021 (per resident):
- Other Funds - Cash and Securities: $287,050,000 ($2378.49)
- Sinking Funds - Cash and Securities: $10,959,000 ($90.81)
4.94% of this county's 2021 resident taxpayers lived in other counties in 2020 ($69,891 average adjusted gross income)
| Here: | 4.94% |
| Connecticut average: | 5.79% |
0.04% of residents moved from foreign countries ($102 average AGI)
Hartford County: 0.04% Connecticut average: 0.02%
Top counties from which taxpayers relocated into this county between 2020 and 2021:
| from New Haven County, CT | |
| from Tolland County, CT | |
| from Middlesex County, CT |
5.15% of this county's 2020 resident taxpayers moved to other counties in 2021 ($92,529 average adjusted gross income)
| Here: | 5.15% |
| Connecticut average: | 5.82% |
0.03% of residents moved to foreign countries ($235 average AGI)
Hartford County: 0.03% Connecticut average: 0.02%
Top counties to which taxpayers relocated from this county between 2020 and 2021:
| to Tolland County, CT | |
| to New Haven County, CT | |
| to Middlesex County, CT |
| Businesses in Hartford, CT | ||||
| Name | Count | Name | Count | |
|---|---|---|---|---|
| 7-Eleven | 1 | MasterBrand Cabinets | 7 | |
| AT&T | 1 | Mazda | 1 | |
| Ace Hardware | 2 | McDonald's | 6 | |
| Advance Auto Parts | 1 | Nike | 10 | |
| AutoZone | 1 | Nissan | 1 | |
| BMW | 1 | Payless | 1 | |
| Burger King | 6 | Penske | 1 | |
| CVS | 5 | Popeyes | 1 | |
| CarMax | 1 | Quiznos | 1 | |
| Circle K | 1 | RadioShack | 1 | |
| DHL | 1 | Rite Aid | 2 | |
| Days Inn | 1 | Ryder Rental & Truck Leasing | 2 | |
| Decora Cabinetry | 2 | Sprint Nextel | 1 | |
| Domino's Pizza | 2 | Starbucks | 2 | |
| Dunkin Donuts | 23 | Stop & Shop | 1 | |
| FedEx | 27 | Subaru | 1 | |
| Ford | 1 | Subway | 10 | |
| GameStop | 1 | T-Mobile | 4 | |
| H&R Block | 4 | Taco Bell | 2 | |
| Hilton | 1 | Toyota | 1 | |
| Holiday Inn | 3 | U-Haul | 3 | |
| Honda | 1 | UPS | 30 | |
| Hyundai | 1 | Volkswagen | 1 | |
| Jones New York | 2 | Walgreens | 1 | |
| KFC | 2 | Walmart | 1 | |
| Long John Silver's | 1 | Wendy's | 2 | |
| Marriott | 1 | YMCA | 3 | |
| Marshalls | 1 | |||
Strongest AM radio stations in Hartford:
- WTIC (1080 AM; 50 kW; HARTFORD, CT; Owner: INFINITY RADIO OPERATIONS INC.)
- WDRC (1360 AM; 5 kW; HARTFORD, CT; Owner: BUCKLEY BROADCASTING CORPORATION)
- WLAT (910 AM; 5 kW; NEW BRITAIN, CT; Owner: MEGA COMMUNICATIONS OF NEW BRITAIN LICENSEE, LLC)
- WPOP (1410 AM; 5 kW; HARTFORD, CT; Owner: CAPSTAR TX LIMITED PARTNERSHIP)
- WNNZ (640 AM; 50 kW; WESTFIELD, MA; Owner: CLEAR CHANNEL BROADCASTING LICENSES, INC.)
- WDZK (1550 AM; 5 kW; BLOOMFIELD, CT; Owner: ABC, INC.)
- WRYM (840 AM; 1 kW; NEW BRITAIN, CT)
- WCRN (830 AM; 50 kW; WORCESTER, MA; Owner: CARTER BROADCASTING CORPORATION)
- WNEZ (1230 AM; 1 kW; MANCHESTER, CT; Owner: MEGA COMMUNICATIONS OF MANCHESTER LICENSEE LLC)
- WVNE (760 AM; daytime; 25 kW; LEICESTER, MA; Owner: BLOUNT MASSCOM, INC.)
- WALE (990 AM; 50 kW; GREENVILLE, RI; Owner: NORTH AMERICAN BROADCASTING CO., INC.)
- WTMI (1290 AM; 1 kW; WEST HARTFORD, CT; Owner: MARLIN BROADCASTING, LLC)
- WMRD (1150 AM; 2 kW; MIDDLETOWN, CT; Owner: CROSSROADS COMMUNICATIONS, INC.)
Strongest FM radio stations in Hartford:
- WRTC-FM (89.3 FM; HARTFORD, CT; Owner: TRUSTEES OF TRINITY COLLEGE)
- WTIC-FM (96.5 FM; HARTFORD, CT; Owner: INFINITY RADIO OPERATIONS INC.)
- WRCH (100.5 FM; NEW BRITAIN, CT; Owner: INFINITY RADIO OPERATIONS INC.)
- WWUH (91.3 FM; WEST HARTFORD, CT; Owner: UNIVERSITY OF HARTFORD)
- WCCC-FM (106.9 FM; HARTFORD, CT; Owner: MARLIN BROADCASTING, LLC)
- WQTQ (89.9 FM; HARTFORD, CT; Owner: HARTFORD BOARD OF EDUCATION)
- WWYZ (92.5 FM; WATERBURY, CT; Owner: CAPSTAR TX LIMITED PARTNERSHIP)
- WKSS (95.7 FM; HARTFORD-MERIDEN, CT; Owner: CAPSTAR TX LIMITED PARTNERSHIP)
- WHCN (105.9 FM; HARTFORD, CT; Owner: CAPSTAR TX LIMITED PARTNERSHIP)
- WZMX (93.7 FM; HARTFORD, CT; Owner: INFINITY RADIO OPERATIONS INC.)
- WMRQ (104.1 FM; WATERBURY, CT; Owner: CAPSTAR TX LIMITED PARTNERSHIP)
- WPKT (90.5 FM; MERIDEN, CT; Owner: CONNECTICUT PUBLIC BROADCASTING, INC)
- WDRC-FM (102.9 FM; HARTFORD, CT; Owner: BUCKLEY BROADCASTING CORPORATION)
- WJMJ (88.9 FM; HARTFORD, CT; Owner: ST. THOMAS SEMINARY)
- WKCI-FM (101.3 FM; HAMDEN, CT; Owner: CLEAR CHANNEL BROADCASTING LICENSES, INC.)
- WAQY (102.1 FM; SPRINGFIELD, MA; Owner: SAGA COMMUNICATIONS OF NEW ENGLAND, LLC)
- WPLR (99.1 FM; NEW HAVEN, CT; Owner: COX RADIO, INC.)
- WFCS (107.7 FM; NEW BRITAIN, CT; Owner: CENTRAL CONNECTICUT STATE UNIVERSITY)
- WHYN-FM (93.1 FM; SPRINGFIELD, MA; Owner: CLEAR CHANNEL BROADCASTING LICENSES, INC.)
- W227AJ (93.3 FM; NORTHFORD, CT; Owner: SACRED HEART UNIVERSITY)
TV broadcast stations around Hartford:
- WHTX-LP (Channel 10; HARTFORD, CT; Owner: ENTRAVISION HOLDINGS, LLC)
- WMLD-LP (Channel 6; HARTFORD, CT; Owner: HARVARD BROADCASTING, INC.)
- WRDM-LP (Channel 13; HARTFORD, CT; Owner: ZGS HARTFORD, INC.)
- WUVN (Channel 18; HARTFORD, CT; Owner: ENTRAVISION HOLDINGS, LLC)
- WTIC-TV (Channel 61; HARTFORD, CT; Owner: TRIBUNE TELEVISION COMPANY)
- W11BJ (Channel 11; HARTFORD, CT; Owner: COMMUNICATIONS SITE MANAGEMENT LLC)
- WTXX (Channel 20; WATERBURY, CT; Owner: WTXX INC.)
- WVIT (Channel 30; NEW BRITAIN, CT; Owner: OUTLET BROADCASTING, INC)
- WFSB (Channel 3; HARTFORD, CT; Owner: MEREDITH CORPORATION)
- WEDH (Channel 24; HARTFORD, CT; Owner: CONNECTICUT PUBLIC BROADCASTING, INC.)
- WHCT-LP (Channel 38; HARTFORD, CT; Owner: VENTURE TECHNOLOGIES GROUP, LLC)
- WUTH-CA (Channel 47; HARTFORD, CT; Owner: ENTRAVISION HOLDINGS, LLC)
- WTNH (Channel 8; NEW HAVEN, CT; Owner: WTNH BROADCASTING, INC.)
- WYDN (Channel 48; WORCESTER, MA; Owner: EDUCATIONAL PUBLIC TV CORPORATION)
- WHPX (Channel 26; NEW LONDON, CT; Owner: PAXSON HARTFORD LICENSE, INC.)
- WCTX (Channel 59; NEW HAVEN, CT; Owner: WTNH BROADCASTING, INC.)
- WEDY (Channel 65; NEW HAVEN, CT; Owner: CONNECTICUT PUBLIC BROADCASTING, INC.)
- WWLP (Channel 22; SPRINGFIELD, MA; Owner: WWLP BROADCASTING, LLC)
- W51BZ (Channel 51; NEW HAVEN, CT; Owner: it COMMUNICATIONS, INC.)
Medal of Honor Recipients
Medal of Honor Recipients born in Hartford: F. Clarence Buck, Frank Hill, George Francis Henrechon, John L. Levitow, Sherrod E., Jr. Skinner, Thomas H. Forsyth.
- National Bridge Inventory (NBI) Statistics
- 229Number of bridges
- 5,407ft / 1,648mTotal length
- $147,465,000Total costs
- 8,379,506Total average daily traffic
- 936,650Total average daily truck traffic
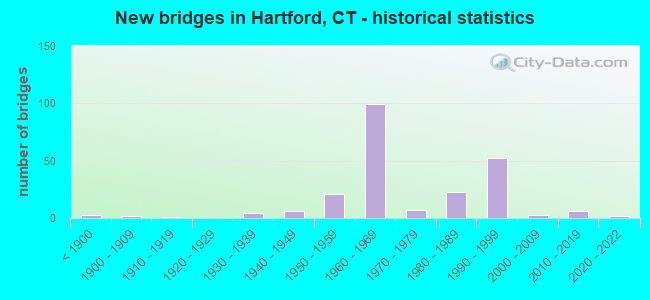
- New bridges - historical statistics
- 3Before 1900
- 21900-1909
- 11910-1919
- 41930-1939
- 61940-1949
- 211950-1959
- 991960-1969
- 71970-1979
- 231980-1989
- 521990-1999
- 32000-2009
- 62010-2019
- 22020-2022
FCC Registered Commercial Land Mobile Towers: 14 (See the full list of FCC Registered Commercial Land Mobile Towers in Hartford, CT)
FCC Registered Private Land Mobile Towers: 10 (See the full list of FCC Registered Private Land Mobile Towers)
FCC Registered Broadcast Land Mobile Towers: 83 (See the full list of FCC Registered Broadcast Land Mobile Towers)
FCC Registered Microwave Towers: 166 (See the full list of FCC Registered Microwave Towers in this town)
FCC Registered Paging Towers: 31 (See the full list of FCC Registered Paging Towers)
FCC Registered Maritime Coast & Aviation Ground Towers: 2 (See the full list of FCC Registered Maritime Coast & Aviation Ground Towers)
FCC Registered Amateur Radio Licenses: 168 (See the full list of FCC Registered Amateur Radio Licenses in Hartford)
FAA Registered Aircraft Manufacturers and Dealers: 4 (See the full list of FAA Registered Manufacturers and Dealers in Hartford)
FAA Registered Aircraft: 64 (See the full list of FAA Registered Aircraft)
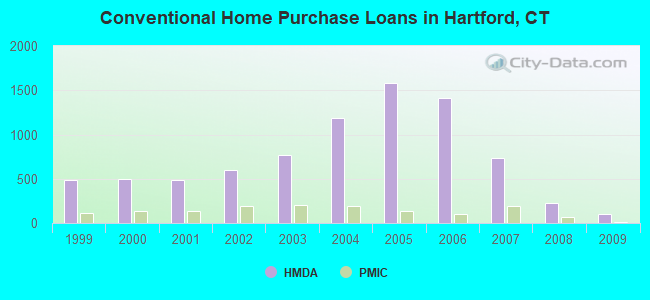
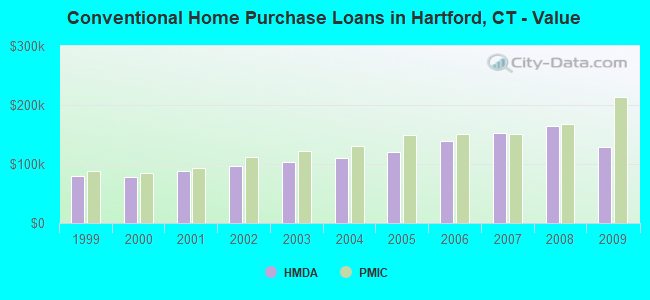
| Home Mortgage Disclosure Act Aggregated Statistics For Year 2009 (Based on 42 full tracts) | ||||||||||||||
| A) FHA, FSA/RHS & VA Home Purchase Loans | B) Conventional Home Purchase Loans | C) Refinancings | D) Home Improvement Loans | E) Loans on Dwellings For 5+ Families | F) Non-occupant Loans on < 5 Family Dwellings (A B C & D) | G) Loans On Manufactured Home Dwelling (A B C & D) | ||||||||
|---|---|---|---|---|---|---|---|---|---|---|---|---|---|---|
| Number | Average Value | Number | Average Value | Number | Average Value | Number | Average Value | Number | Average Value | Number | Average Value | Number | Average Value | |
| LOANS ORIGINATED | 273 | $153,388 | 99 | $128,960 | 473 | $172,953 | 58 | $62,190 | 27 | $1,406,963 | 67 | $132,299 | 0 | $0 |
| APPLICATIONS APPROVED, NOT ACCEPTED | 19 | $143,789 | 11 | $253,455 | 118 | $156,729 | 16 | $49,312 | 1 | $1,000,000 | 21 | $131,429 | 1 | $30,000 |
| APPLICATIONS DENIED | 79 | $165,228 | 52 | $138,962 | 563 | $158,632 | 95 | $50,579 | 11 | $346,000 | 90 | $134,656 | 3 | $101,667 |
| APPLICATIONS WITHDRAWN | 40 | $150,550 | 27 | $112,333 | 196 | $169,036 | 5 | $50,400 | 3 | $10,056,667 | 22 | $148,318 | 0 | $0 |
| FILES CLOSED FOR INCOMPLETENESS | 15 | $170,467 | 5 | $107,400 | 64 | $162,000 | 6 | $106,833 | 1 | $500,000 | 6 | $141,167 | 0 | $0 |
Detailed mortgage data for all 43 tracts in Hartford, CT
| Private Mortgage Insurance Companies Aggregated Statistics For Year 2009 (Based on 19 full tracts) | ||||
| A) Conventional Home Purchase Loans | B) Refinancings | |||
|---|---|---|---|---|
| Number | Average Value | Number | Average Value | |
| LOANS ORIGINATED | 15 | $213,800 | 6 | $168,333 |
| APPLICATIONS APPROVED, NOT ACCEPTED | 10 | $173,800 | 7 | $256,714 |
| APPLICATIONS DENIED | 4 | $131,250 | 5 | $192,800 |
| APPLICATIONS WITHDRAWN | 3 | $195,000 | 1 | $155,000 |
| FILES CLOSED FOR INCOMPLETENESS | 2 | $153,500 | 1 | $146,000 |
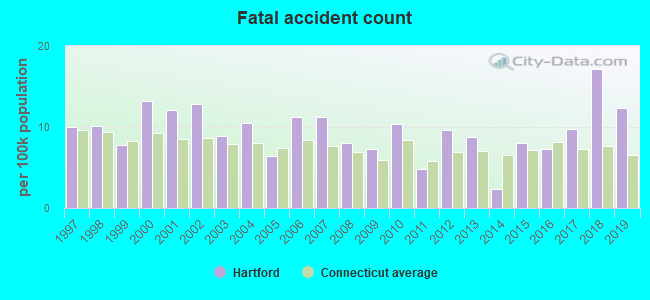
2002 - 2018 National Fire Incident Reporting System (NFIRS) incidents
- Fire incident types reported to NFIRS in Hartford, CT
- 4,40243.4%Structure Fires
- 3,08130.4%Outside Fires
- 2,05720.3%Mobile Property/Vehicle Fires
- 5935.9%Other
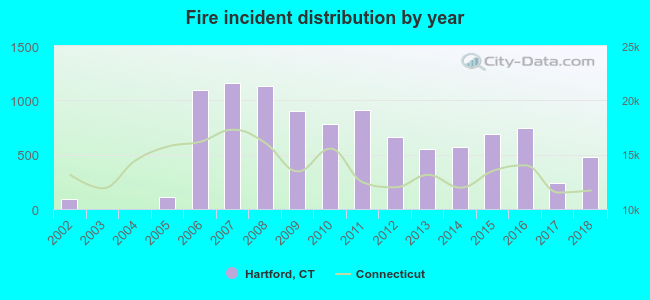 Based on the data from the years 2002 - 2018 the average number of fire incidents per year is 596. The highest number of reported fires - 1,163 took place in 2007, and the least - 2 in 2004. The data has an increasing trend.
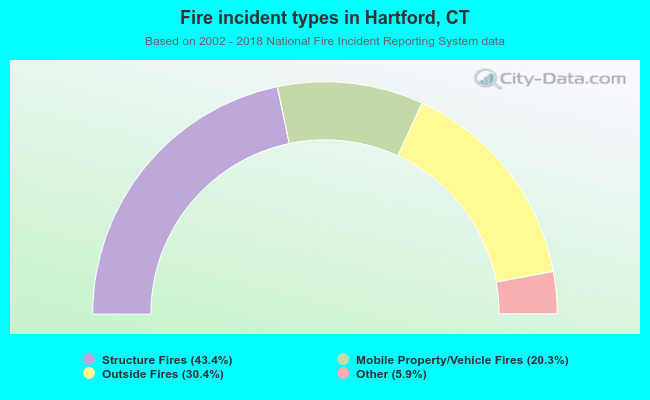 When looking into fire subcategories, the most reports belonged to: Structure Fires (43.4%), and Outside Fires (30.4%).
Fire-safe hotels and motels in Hartford, Connecticut:
- Red Lion Hotel Hartford, 50 Morgan St, Hartford, Connecticut 06120 , Phone: (860) 549-2400
- Red Roof Inn, 440 Asylum St, Hartford, Connecticut 06103 , Phone: (959) 888-3000
- BEST WESTERN Hartford Hotel & Suites, 185 Brainard Rd, Hartford, Connecticut 06114 , Phone: (860) 525-1000, Fax: (860) 525-2990
- Marriot Hartford Downtown, 200 Columbus Blvd, Hartford, Connecticut 06103 , Phone: (860) 249-8000, Fax: (860) 249-8181
- Days Inn- Hartford, 207 Brainard Rd, Hartford, Connecticut 06114 , Phone: (860) 247-3297
- Homewood Suites Hartford Downtown, 338 Asylum St, Hartford, Connecticut 06103 , Phone: (860) 524-0223, Fax: (860) 524-0264
- Candlewood Suites Hartford Downtown, 370 Market St, Hartford, Connecticut 06120 , Phone: (800) 439-4745
| Most common first names in Hartford, CT among deceased individuals | ||
| Name | Count | Lived (average) |
|---|---|---|
| Mary | 1,271 | 79.9 years |
| John | 1,181 | 73.2 years |
| Joseph | 876 | 74.8 years |
| William | 772 | 71.3 years |
| James | 670 | 70.1 years |
| Anna | 464 | 81.2 years |
| Frank | 453 | 75.1 years |
| George | 426 | 72.9 years |
| Helen | 421 | 79.6 years |
| Robert | 401 | 68.7 years |
| Most common last names in Hartford, CT among deceased individuals | ||
| Last name | Count | Lived (average) |
|---|---|---|
| Smith | 312 | 71.8 years |
| Johnson | 299 | 71.2 years |
| Williams | 266 | 68.8 years |
| Brown | 208 | 72.4 years |
| Jones | 170 | 68.0 years |
| Davis | 152 | 69.1 years |
| Rodriguez | 130 | 62.5 years |
| Rivera | 128 | 57.1 years |
| Wilson | 112 | 68.4 years |
| Jackson | 107 | 71.7 years |
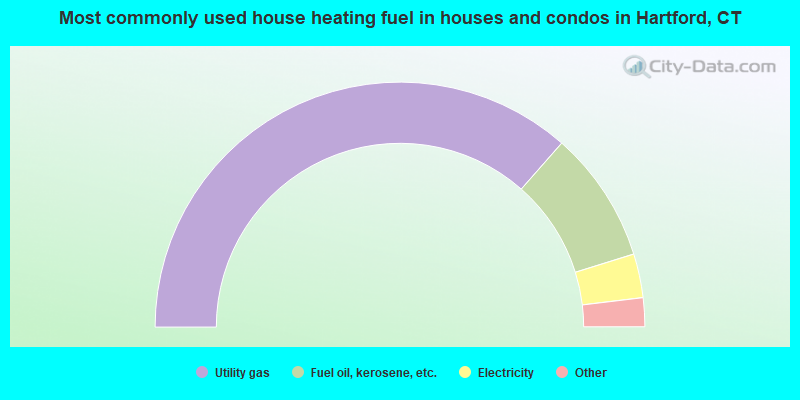
- 72.9%Utility gas
- 17.4%Fuel oil, kerosene, etc.
- 5.8%Electricity
- 2.7%Bottled, tank, or LP gas
- 1.2%No fuel used
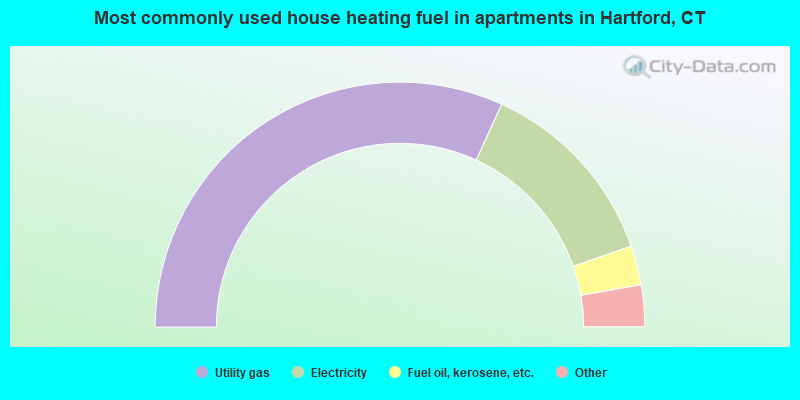
- 63.7%Utility gas
- 25.7%Electricity
- 5.2%Fuel oil, kerosene, etc.
- 2.6%Bottled, tank, or LP gas
- 2.3%No fuel used
- 0.7%Other fuel
Hartford compared to Connecticut state average:
- Median household income below state average.
- Black race population percentage significantly above state average.
- Hispanic race population percentage above state average.
- Median age significantly below state average.
- Renting percentage significantly above state average.
- Number of rooms per house below state average.
Hartford on our top lists:
- #3 on the list of "Top 101 cities with largest percentage population decreases in the 1990s) (population 50,000+)"
- #3 on the list of "Top 101 cities with the highest percentage of single-parent households, population 50,000+"
- #7 on the list of "Top 100 cities with highest percentage of renters (pop. 50,000+)"
- #7 on the list of "Top 101 cities with largest percentage of females in occupations: healthcare support occupations (population 50,000+)"
- #11 on the list of "Top 101 cities with the highest number of police officers per 1000 residents (population 50,000+)"
- #20 on the list of "Top 101 cities with the least cars per house, population 50,000+"
- #21 on the list of "Top 101 cities with largest percentage of males in industries: retail trade (population 50,000+)"
- #23 on the list of "Top 101 cities with the highest number of robberies per 100,000 residents, excludes tourist destinations and others with a lot of outsiders visiting based on city industries data (population 50,000+)"
- #24 on the list of "Top 101 cities with the highest number of arson incidents per 100,000 residents, excludes tourist destinations and others with a lot of outsiders visiting based on city industries data (population 50,000+)"
- #24 on the list of "Top 101 cities with largest percentage of females in occupations: community and social service occupations (population 50,000+)"
- #24 on the list of "Top 101 cities with the most residents born in Jamaica (population 500+)"
- #24 on the list of "Top 101 cities with the highest average snowfall in a year (population 50,000+)"
- #25 on the list of "Top 101 cities where the highest percentage of females (15+ years) which never married (with at least 10,000 females in this group)"
- #25 on the list of "Top 101 cities with largest percentage of males in occupations: office and administrative support occupations (population 50,000+)"
- #25 on the list of "Top 101 cities with the highest number of assaults per 100,000 residents, excludes tourist destinations and others with a lot of outsiders visiting based on city industries data (population 50,000+)"
- #28 on the list of "Top 101 cities with the largest percentage of unmarried partner households (population 50,000+)"
- #28 on the list of "Top 101 cities that people commute into (largest positive percentage daily daytime population change due to commuting) (population 50,000+)"
- #29 on the list of "Top 101 cities with the smallest percentage of one, detached housing units in structures (20,000+ housing units)"
- #31 on the list of "Top 101 cities with the highest number of murders per 100,000 residents, excludes tourist destinations and others with a lot of outsiders visiting based on city industries data (population 50,000+)"
- #33 on the list of "Top 101 cities with the highest ratio of murders to rapes between 2002 and 2012 (population 50,000+)"
- #5 (06120) on the list of "Top 101 zip codes with the lowest 2012 average taxable interest for individuals (pop 5,000+)"
- #28 (06112) on the list of "Top 101 zip codes with the largest percentage of West Indian first ancestries"
- #59 (06117) on the list of "Top 101 zip codes with the largest percentage of taxpayers reporting taxable interest in 2012 (pop 5,000+)"
- #65 (06120) on the list of "Top 101 zip codes with the lowest 2012 average Adjusted Gross Income (AGI) for individuals (pop 5,000+)"
- #94 (06117) on the list of "Top 101 zip codes with the largest percentage of taxpayers using charity contributions deductions in 2012 (pop 5,000+)"
- #97 (06120) on the list of "Top 101 zip codes with the lowest average reported salary/wage in 2012 (pop 5,000+)"
- #2 on the list of "Top 101 counties with highest percentage of residents voting for Obama (Democrat) in the 2012 Presidential Election"
- #17 on the list of "Top 101 counties with the most Catholic congregations"
- #19 on the list of "Top 101 counties with the lowest Particulate Matter (PM10) Annual air pollution readings in 2012 (µg/m3)"
- #24 on the list of "Top 101 counties with the highest percentage of residents that visited a dentist within the past year"
- #29 on the list of "Top 101 counties with the most Mainline Protestant congregations"

|
|
Total of 449 patent applications in 2008-2024.

