Estimated zip code population in 2022: 13,443 Zip code population in 2010: 12,138 Zip code population in 2000: 11,915
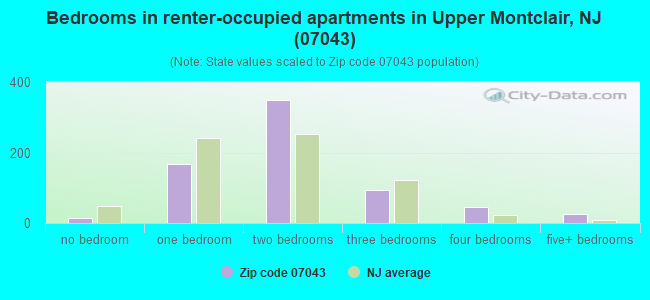
Houses and condos: 4,641 Renter-occupied apartments: 699
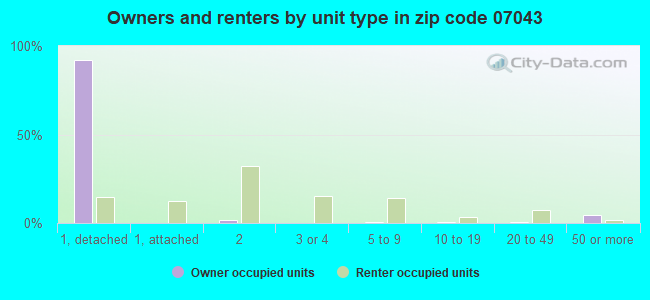
% of renters here:
16%
State:
35%
March 2022 cost of living index in zip code 07043: 115.0 (more than average, U.S. average is 100)
Land area: 2.6 sq. mi. Water area: 0.0 sq. mi.
Population density: 5,172 people per square mile
(average).
OSM Map
Google Map
MSN Map
OSM Map
General Map
Google Map
MSN Map
OSM Map
Google Map
MSN Map
OSM Map
Google Map
MSN Map
Please wait while loading the map...
Real estate property taxes paid for housing units in 2022:
This zip code:
1.0% ($9,521)
New Jersey:
2.1% ($8,897)
Median real estate property taxes paid for housing units with mortgages in 2022: $9,557 (1.0%) Median real estate property taxes paid for housing units with no mortgage in 2022: $9,483 (1.0%)
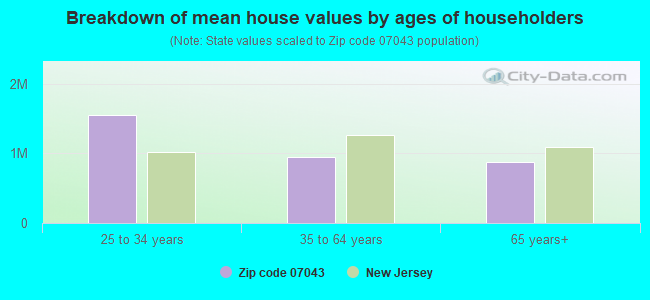
Estimated median house/condo value in 2022: $943,922
07043:
$943,922
New Jersey:
$428,900
Median resident age:
This zip code:
41.4 years
New Jersey median age:
40.4 years
Average household size:
This zip code:
3.0 people
New Jersey:
2.6 people
Averages for the 2020 tax year for zip code 07043, filed in 2021:
Average Adjusted Gross Income (AGI) in 2020: $288,134 (Individual Income Tax Returns)
Here:
$288,134
State:
$95,247
Salary/wage: $238,659 (reported on 79.7% of returns)
Here:
$238,659
State:
$80,635
(% of AGI for various income ranges: 1280.7% for AGIs below $25k, 3930.0% for AGIs $25k-50k, 6507.4% for AGIs $50k-75k, 9844.0% for AGIs $75k-100k, 21652.8% for AGIs $100k-200k, 155100.5% for AGIs over 200k)
Taxable interest for individuals: $3,738 (reported on 58.4% of returns)
This zip code:
$3,738
New Jersey:
$2,414
(% of AGI for various income ranges: 41.8% for AGIs below $25k, 113.8% for AGIs $25k-50k, 120.4% for AGIs $50k-75k, 220.0% for AGIs $75k-100k, 273.4% for AGIs $100k-200k, 1652.1% for AGIs over 200k)
Ordinary dividends: $16,129 (reported on 58.4% of returns)
Here:
$16,129
State:
$8,057
(% of AGI for various income ranges: 182.0% for AGIs below $25k, 271.7% for AGIs $25k-50k, 438.5% for AGIs $50k-75k, 899.5% for AGIs $75k-100k, 1397.0% for AGIs $100k-200k, 7096.3% for AGIs over 200k)
Net capital gain/loss in AGI: +$63,493 (reported on 53.5% of returns)
Here:
+$63,493
State:
+$25,022
(% of AGI for various income ranges: 101.1% for AGIs below $25k, 375.0% for AGIs $25k-50k, 295.2% for AGIs $50k-75k, 844.5% for AGIs $75k-100k, 1483.4% for AGIs $100k-200k, 30631.1% for AGIs over 200k)
Profit/loss from business: +$36,838 (reported on 27.1% of returns)
Here:
+$36,838
State:
+$18,035
(% of AGI for various income ranges: 230.2% for AGIs below $25k, 378.8% for AGIs $25k-50k, 841.5% for AGIs $50k-75k, 1079.5% for AGIs $75k-100k, 2047.4% for AGIs $100k-200k, 6762.1% for AGIs over 200k)
Taxable individual retirement arrangement distribution: $32,826 (reported on 12.5% of returns)
07043:
$32,826
New Jersey:
$21,558
(% of AGI for various income ranges: 74.8% for AGIs below $25k, 322.9% for AGIs $25k-50k, 423.0% for AGIs $50k-75k, 776.0% for AGIs $75k-100k, 1310.0% for AGIs $100k-200k, 2169.6% for AGIs over 200k)
Self-employed (Keogh) retirement plans: $32,978 (reported on 5.9% of returns)
07043:
$32,978
New Jersey:
$30,844
(% of AGI for various income ranges: 135.9% for AGIs $50k-75k, 218.5% for AGIs $100k-200k, 1606.8% for AGIs over 200k)
Total itemized deductions: $42,359 (reported on 35.7% of returns)
Here:
$42,359
State:
$32,863
(% of AGI for various income ranges: 174.3% for AGIs below $25k, 608.3% for AGIs $25k-50k, 918.1% for AGIs $50k-75k, 1541.5% for AGIs $75k-100k, 2350.9% for AGIs $100k-200k, 11186.3% for AGIs over 200k)
Charity contributions: $12,365 (reported on 31.1% of returns)
Here:
$12,365
State:
$7,880
(% of AGI for various income ranges: 50.4% for AGIs $25k-50k, 78.5% for AGIs $50k-75k, 196.0% for AGIs $75k-100k, 343.8% for AGIs $100k-200k, 3277.2% for AGIs over 200k)
Taxes paid: $9,759 (reported on 35.3% of returns)
07043:
$9,759
State:
$9,183
(% of AGI for various income ranges: 65.5% for AGIs below $25k, 179.6% for AGIs $25k-50k, 285.2% for AGIs $50k-75k, 426.0% for AGIs $75k-100k, 742.8% for AGIs $100k-200k, 2281.2% for AGIs over 200k)
Earned income credit: $1,173 (reported on 2.7% of returns)
Here:
$1,173
State:
$2,148
(% of AGI for various income ranges: 32.5% for AGIs below $25k, 13.8% for AGIs $25k-50k)
Percentage of individuals using paid preparers for their 2020 taxes: 93.6%
Here:
94%
State:
92%
(% for various income ranges: 90.8% for AGIs below $25k, 95.3% for AGIs $25k-50k, 91.3% for AGIs $50k-75k, 87.2% for AGIs $75k-100k, 93.5% for AGIs $100k-200k, 96.2% for AGIs over 200k)
Averages for the 2012 tax year for zip code 07043, filed in 2013:
Average Adjusted Gross Income (AGI) in 2012: $225,719 (Individual Income Tax Returns)
Here:
$225,719
State:
$79,688
Salary/wage: $183,797 (reported on 80.2% of returns)
Here:
$183,797
State:
$68,122
(% of AGI for various income ranges: 62.6% for AGIs below $25k, 64.2% for AGIs $25k-50k, 61.2% for AGIs $50k-75k, 64.8% for AGIs $75k-100k, 70.1% for AGIs $100k-200k, 64.6% for AGIs over 200k)
Taxable interest for individuals: $3,572 (reported on 61.4% of returns)
This zip code:
$3,572
New Jersey:
$2,193
(% of AGI for various income ranges: 2.8% for AGIs below $25k, 1.7% for AGIs $25k-50k, 1.3% for AGIs $50k-75k, 1.5% for AGIs $75k-100k, 1.1% for AGIs $100k-200k, 0.9% for AGIs over 200k)
Ordinary dividends: $13,827 (reported on 56.2% of returns)
Here:
$13,827
State:
$6,828
(% of AGI for various income ranges: 9.9% for AGIs below $25k, 5.1% for AGIs $25k-50k, 5.6% for AGIs $50k-75k, 3.6% for AGIs $75k-100k, 4.1% for AGIs $100k-200k, 3.1% for AGIs over 200k)
Net capital gain/loss in AGI: +$36,838 (reported on 48.9% of returns)
Here:
+$36,838
State:
+$15,358
(% of AGI for various income ranges: 2.0% for AGIs below $25k, 2.3% for AGIs $25k-50k, 1.9% for AGIs $50k-75k, 1.5% for AGIs $75k-100k, 2.1% for AGIs $100k-200k, 9.7% for AGIs over 200k)
Profit/loss from business: +$39,680 (reported on 26.1% of returns)
Here:
+$39,680
State:
+$19,577
(% of AGI for various income ranges: 10.8% for AGIs below $25k, 9.1% for AGIs $25k-50k, 6.8% for AGIs $50k-75k, 7.8% for AGIs $75k-100k, 7.7% for AGIs $100k-200k, 3.6% for AGIs over 200k)
Taxable individual retirement arrangement distribution: $31,427 (reported on 14.6% of returns)
07043:
$31,427
New Jersey:
$18,214
(% of AGI for various income ranges: 2.6% for AGIs below $25k, 5.0% for AGIs $25k-50k, 4.9% for AGIs $50k-75k, 3.9% for AGIs $75k-100k, 3.8% for AGIs $100k-200k, 1.5% for AGIs over 200k)
Self-employment retirement plans: $29,526 (reported on 6.1% of returns)
07043:
$29,526
New Jersey:
$24,511
(% of AGI for various income ranges: 1.8% for AGIs $50k-75k, 0.9% for AGIs $100k-200k, 0.8% for AGIs over 200k)
Total itemized deductions: $64,059 (20% of AGI, reported on 68.2% of returns)
Here:
$64,059
State:
$30,827
Here:
20.3% of AGI
State:
21.2% of AGI
(% of AGI for various income ranges: 36.2% for AGIs below $25k, 24.7% for AGIs $25k-50k, 24.8% for AGIs $50k-75k, 24.1% for AGIs $75k-100k, 24.5% for AGIs $100k-200k, 17.7% for AGIs over 200k)
Charity contributions: $6,291 (reported on 61.6% of returns)
Here:
$6,291
State:
$3,451
(% of AGI for various income ranges: 1.0% for AGIs below $25k, 1.4% for AGIs $25k-50k, 1.6% for AGIs $50k-75k, 1.9% for AGIs $75k-100k, 1.8% for AGIs $100k-200k, 1.7% for AGIs over 200k)
Taxes paid: $39,706 (reported on 68.0% of returns)
07043:
$39,706
State:
$15,801
(% of AGI for various income ranges: 15.1% for AGIs below $25k, 10.9% for AGIs $25k-50k, 12.4% for AGIs $50k-75k, 12.9% for AGIs $75k-100k, 14.3% for AGIs $100k-200k, 11.5% for AGIs over 200k)
Earned income credit: $1,235 (reported on 3.0% of returns)
Here:
$1,235
State:
$2,182
(% of AGI for various income ranges: 1.4% for AGIs below $25k, 0.3% for AGIs $25k-50k)
Percentage of individuals using paid preparers for their 2012 taxes: 71.4%
Here:
71%
State:
65%
(% for various income ranges: 62.7% for AGIs below $25k, 60.4% for AGIs $25k-50k, 66.7% for AGIs $50k-75k, 70.2% for AGIs $75k-100k, 73.0% for AGIs $100k-200k, 81.5% for AGIs over 200k)
Averages for the 2004 tax year for zip code 07043, filed in 2005:
Average Adjusted Gross Income (AGI) in 2004: $155,349 (Individual Income Tax Returns)
Here:
$155,349
State:
$64,921
Salary/wage: $138,344 (reported on 76.5% of returns)
Here:
$138,344
State:
$57,755
(% of AGI for various income ranges: 307.1% for AGIs below $10k, 58.6% for AGIs $10k-25k, 69.2% for AGIs $25k-50k, 63.0% for AGIs $50k-75k, 71.1% for AGIs $75k-100k, 68.0% for AGIs over 100k)
Taxable interest for individuals: $3,775 (reported on 73.0% of returns)
This zip code:
$3,775
New Jersey:
$2,068
(% of AGI for various income ranges: 43.8% for AGIs below $10k, 5.9% for AGIs $10k-25k, 3.0% for AGIs $25k-50k, 2.3% for AGIs $50k-75k, 2.2% for AGIs $75k-100k, 1.6% for AGIs over 100k)
Taxable dividends: $7,145 (reported on 62.8% of returns)
Here:
$7,145
State:
$3,959
(% of AGI for various income ranges: 76.5% for AGIs below $10k, 8.5% for AGIs $10k-25k, 5.2% for AGIs $25k-50k, 5.4% for AGIs $50k-75k, 3.5% for AGIs $75k-100k, 2.5% for AGIs over 100k)
Net capital gain/loss: +$22,744 (reported on 55.1% of returns)
Here:
+$22,744
State:
+$13,591
(% of AGI for various income ranges: -27.0% for AGIs below $10k, 3.3% for AGIs $10k-25k, 1.1% for AGIs $25k-50k, 2.4% for AGIs $50k-75k, 1.3% for AGIs $75k-100k, 9.0% for AGIs over 100k)
Profit/loss from business: +$35,567 (reported on 23.3% of returns)
Here:
+$35,567
State:
+$17,520
(% of AGI for various income ranges: 26.0% for AGIs below $10k, 10.4% for AGIs $10k-25k, 8.2% for AGIs $25k-50k, 7.4% for AGIs $50k-75k, 6.4% for AGIs $75k-100k, 5.0% for AGIs over 100k)
IRA payment deduction: $3,515 (reported on 3.5% of returns)
07043:
$3,515
New Jersey:
$3,270
(% of AGI for various income ranges: 0.6% for AGIs $10k-25k, 0.4% for AGIs $25k-50k, 0.3% for AGIs $50k-75k, 0.2% for AGIs $75k-100k, 0.0% for AGIs over 100k)
Self-employed pension: $21,727 (reported on 6.5% of returns)
Here:
$21,727
New Jersey:
$17,258
Total itemized deductions: $42,550 (19% of AGI, reported on 66.2% of returns)
Here:
$42,550
State:
$23,924
Here:
19.0% of AGI
State:
21.1% of AGI
(% of AGI for various income ranges: 121.5% for AGIs below $10k, 34.3% for AGIs $10k-25k, 26.6% for AGIs $25k-50k, 26.2% for AGIs $50k-75k, 28.9% for AGIs $75k-100k, 16.6% for AGIs over 100k)
Charity contributions deductions: $5,567 (2% of AGI, reported on 61.8% of returns)
Here:
$5,567
State:
$3,242
Here:
2.4% of AGI
State:
2.7% of AGI
(% of AGI for various income ranges: 3.4% for AGIs below $10k, 2.2% for AGIs $10k-25k, 2.6% for AGIs $25k-50k, 2.6% for AGIs $50k-75k, 2.9% for AGIs $75k-100k, 2.1% for AGIs over 100k)
Total tax: $38,039 (reported on 84.5% of returns)
07043:
$38,039
State:
$12,321
(% of AGI for various income ranges: 17.4% for AGIs below $10k, 5.3% for AGIs $10k-25k, 8.5% for AGIs $25k-50k, 10.3% for AGIs $50k-75k, 10.7% for AGIs $75k-100k, 22.2% for AGIs over 100k)
Earned income credit: $1,047 (reported on 2.2% of returns)
Here:
$1,047
State:
$1,711
Percentage of individuals using paid preparers for their 2004 taxes: 71.5%
Here:
72%
State:
65%
(% for various income ranges: 65.6% for AGIs below $10k, 64.0% for AGIs $10k-25k, 64.7% for AGIs $25k-50k, 72.9% for AGIs $50k-75k, 69.5% for AGIs $75k-100k, 77.5% for AGIs over 100k)
Likely homosexual households (counted as self-reported same-sex unmarried-partner households)
Lesbian couples: 0.2% of all households
Gay men: 0.1% of all households
Household received Food Stamps/SNAP in the past 12 months: 84 Household did not receive Food Stamps/SNAP in the past 12 months: 4,255
Women who had a birth in the past 12 months: 113 (114 now married, 0 unmarried) Women who did not have a birth in the past 12 months: 2,835 (1,313 now married, 1,518 unmarried)
Housing units in zip code 07043 with a mortgage: 2,500 (428 second mortgage, 401 both second mortgage and home equity loan) Houses without a mortgage: 11
Median monthly owner costs for units with a mortgage: $3,744 Median monthly owner costs for units without a mortgage: $1,425
Residents with income below the poverty level in 2022:
This zip code:
2.1%
Whole state:
9.7%
Residents with income below 50% of the poverty level in 2022:
This zip code:
0.7%
Whole state:
5.2%
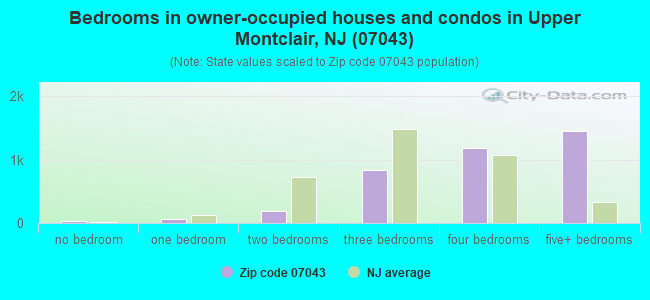
Median number of rooms in houses and condos:
Here:
10.0
State:
6.8
Median number of rooms in apartments:
Here:
5.0
State:
3.9
Notable locations in this zip code not listed on our city pages
Notable locations in zip code 07043: Upper Montclair Station (A), Bond House (B), President's House (C), Alderice House (D), Center for Continuing Education (E), Gilbreth House (F), Freeman Hall (G), Russ Hall (H), Alumni House (I), Chapin Hall (J), Panzer Gym (K), College Hall (L), The Alexander Kasser Theater (M), Morehead Halll (N), Stone Hall (O), Bohn Hall (P), Newman House (Q), McEachern Hall (R), Montclair Fire Department Station 2 (S). Display/hide their locations on the map
Churches in zip code 07043 include: Saint James Episcopal Church (A), Friends Meeting House (B), Montclair Community Church (C), Montclair Heights Reformed Church (D), Union Congregational Church (E). Display/hide their locations on the map
Parks in zip code 07043 include: Pearl Brook Park (1), Mountainside Park (2), Anderson Park (3), Alonzo F Bonsal Wildlife Preserve (4), Yantacaw Brook Park (5), Sprague Field (6), Alumni Green (7), Tuers Park (8). Display/hide their locations on the map
In group quarters: 469 (-1 institutionalized population)
Size of family households: 1,194 2-persons, 847 3-persons, 1,074 4-persons, 372 5-persons, 66 6-persons, 13 7-or-more-persons
Size of nonfamily households: 627 1-person, 139 2-persons, 15 4-persons
3,325 married couples with children.
147 single-parent households (8 men, 139 women).
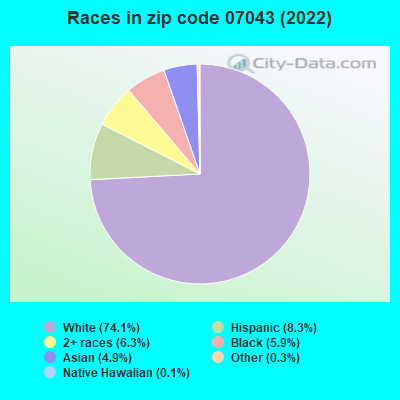
85.3% of residents of 07043 zip code speak English at home.
4.6% of residents speak Spanish at home (81% very well, 13% well, 3% not well, 4% not at all).
6.3% of residents speak other Indo-European language at home (81% very well, 16% well, 2% not well).
2.7% of residents speak Asian or Pacific Island language at home (53% very well, 37% well, 10% not well).
0.6% of residents speak other language at home (100% very well).
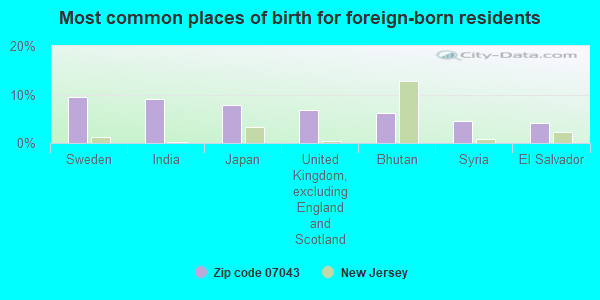
Foreign born population: 1,579 (11.7%) (73.8% of them are naturalized citizens)
Facilities with environmental interests located in this zip code:
GETTY SERVICE STATION #95737 (575 VALLEY RD in MONTCLAIR, NJ)
STATE MASTER (New Jersey environmental info) - NJEMS-001478, STATE CLEANUP SITE, NJEMS-84555300000, EPCRA, NJEMS-A0958, AIR PROGRAM (Resource Conservation and Recovery Act (tracking hazardous waste)) Business SIC classification: GASOLINE SERVICE STATIONS Organizations: GETTY PETROLEUM MARKETING INC Alternative names: GETTY PETROLEUM CORP 95373
FUNDS AUTO BODY (554 VALLEY RD in MONTCLAIR, NJ)
STATE MASTER (New Jersey environmental info) - NJEMS-80051800000, EPCRA, NJEMS-G0576, AIR PROGRAM, NJEMS-NJD053977229, HAZARDOUS WASTE PROGRAM (Resource Conservation and Recovery Act (tracking hazardous waste)) Business SIC classification: TOP, BODY, AND UPHOLSTERY REPAIR SHOPS AND PAINT SHOPS Organizations: FUNDS AUTO REPAIR
BAHTO & SON (623 VALLEY RD in UPPER MONTCLAIR, NJ)
STATE MASTER (New Jersey environmental info) - NJEMS-34319400000, EPCRA (Resource Conservation and Recovery Act (tracking hazardous waste)) Business SIC classification: DRYCLEANING PLANTS, EXCEPT RUG CLEANING Alternative names: BAHTO & SON DRY CLEANERS
BELLAIRE HOUSE CONDOMINIUMS (530 VALLEY RD in MONTCLAIR, NJ)
STATE MASTER (New Jersey environmental info) - NJEMS-019007, STATE CLEANUP SITE, NJEMS-07518, AIR PROGRAM (Resource Conservation and Recovery Act (tracking hazardous waste))
EXXON CO USA 31062 (572 VALLEY RD in UPPER MONTCLAIR, NJ)
(Resource Conservation and Recovery Act (tracking hazardous waste))
PARK ST PARTNERSHIP (256 PARK ST in MONTCLAIR, NJ)
(Resource Conservation and Recovery Act (tracking hazardous waste))
PLAZA CLEANERS (254 PARK AVE in UPPER MONTCLAIR, NJ)
AIR MINOR (AIRS/AFS) Business SIC classification: LAUNDRY AND GARMENT SERVICES
HEPBURN RICHARD & JULIA (114 CLAREWILL AVE in UPPER MONTCLAIR, NJ)
(Resource Conservation and Recovery Act (tracking hazardous waste))
FOREIGN AIDE (207 BELLVUE AVE in UPPER MONTCLAIR, NJ)
(Resource Conservation and Recovery Act (tracking hazardous waste))
Conditionally Exempt Small Quantity Generators, less than 100 kg/month of hazardous waste (Resource Conservation and Recovery Act (tracking hazardous waste)) - notification Organizations: JAKE NEWMAN (CONTACT/OWNER)
Housing units lacking complete plumbing facilities: 0.6% Housing units lacking complete kitchen facilities: 1.4%
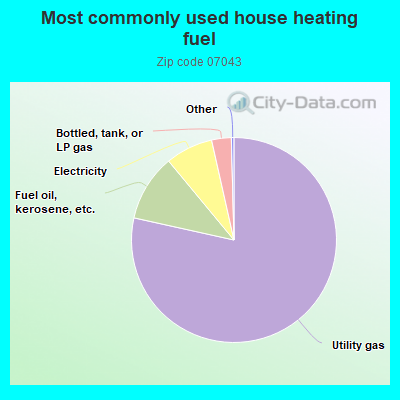
78.4%Utility gas
10.5%Fuel oil, kerosene, etc.
7.5%Electricity
3.1%Bottled, tank, or LP gas
Population in 1990: 11,891. Population change in the 1990s: +24 (+0.2%).
Place of birth for U.S.-born residents:
This state: 4,961
Northeast: 4,867
Midwest: 675
South: 930
West: 306
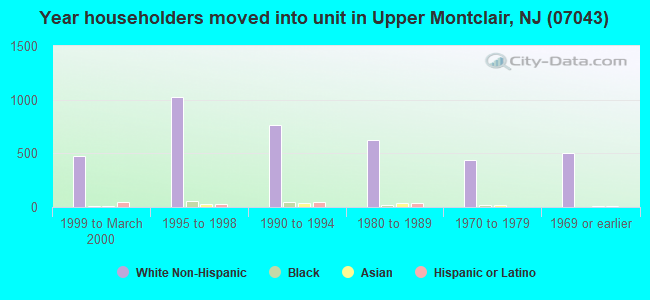
64% of the 07043 zip code residents lived in the same house 5 years ago. Out of people who lived in different houses, 42% lived in this county. Out of people who lived in different counties, 50% lived in New Jersey.
89% of the 07043 zip code residents lived in the same house 1 year ago. Out of people who lived in different houses, 32% moved from this county. Out of people who lived in different houses, 28% moved from different county within same state. Out of people who lived in different houses, 39% moved from different state. Out of people who lived in different houses, 4% moved from abroad.
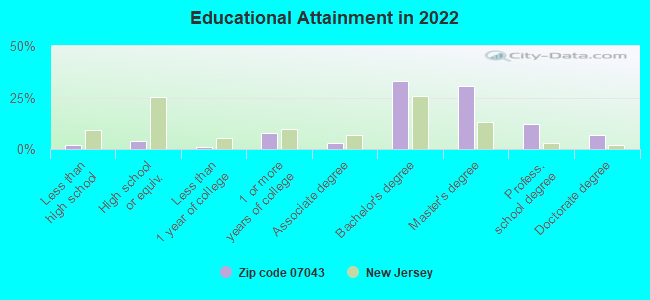
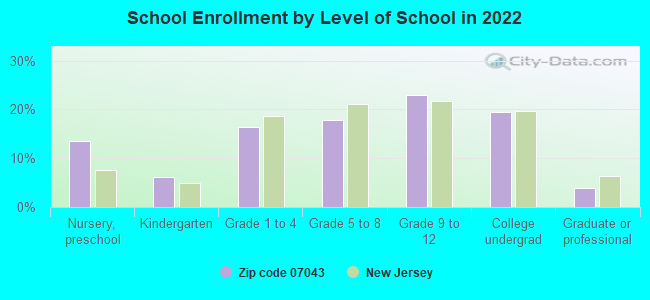
Private vs. public school enrollment:
Students in private schools in grades 1 to 8 (elementary and middle school): 216
Here:
15.1%
New Jersey:
12.3%
Students in private schools in grades 9 to 12 (high school): 241
Here:
25.1%
New Jersey:
13.1%
Students in private undergraduate colleges: 331
Here:
40.6%
New Jersey:
33.2%
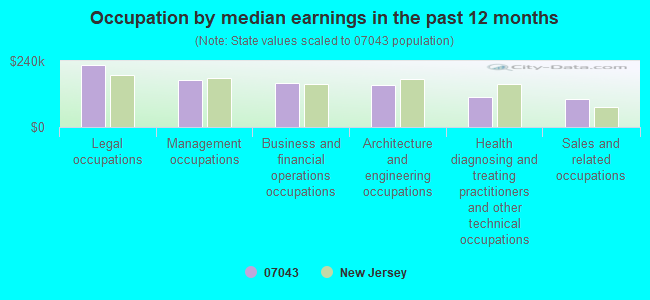
Occupation by median earnings in the past 12 months ($)
224,472Legal occupations
172,683Management occupations
161,800Business and financial operations occupations
151,781Architecture and engineering occupations
110,329Health diagnosing and treating practitioners and other technical occupations
102,008Sales and related occupations
Companies with federal contracts located in this zip code:
MONTCLAIR STATE UNIVERSITY (IN (1 NORMAL AVE in MONTCLAIR, NJ) : $426,471 in 7 contractsfrom 2003 to 2006
Contracts for Space Science and Applications -- Basic Research (R&D), Educational Services, by NASA, Army, National Labor Relations Board Signed by year:2000: $0; 2001: $0; 2002: $0; 2003: $11,649; 2004: $180,038; 2005: $97,668; 2006: $137,116.
Biggest contracts:
$176,932 with NASA for Space Science and Applications -- Basic Research (R&D). Signed on 2004-06-04. Effective on 2004-06-01. Completion date: 2007-05-31.
$97,668, same as above.Signed on 2005-11-14. Effective on 2004-06-01. Completion date: 2007-05-31.
$69,763, same as above.Signed on 2006-02-24. Effective on 2004-06-01. Completion date: 2007-05-31.
$67,253, same as above.Signed on 2006-08-01. Effective on 2004-06-01. Completion date: 2007-05-31.
Top industries in this zip code by the number of employees in 2005:
Accommodation and Food Services: Food Service Contractors (100-249 employees: 1 establishment)
2004 - 2018 National Fire Incident Reporting System (NFIRS) incidents
Based on the data from the years 2004 - 2018 the average number of fire incidents per year is 27. The highest number of reported fires - 47 took place in 2010, and the least - 2 in 2018. The data has a dropping trend.
When looking into fire subcategories, the most reports belonged to: Structure Fires (66.3%), and Outside Fires (25.1%).
Fire incident types reported to NFIRS in Zip Code 07043


 Nearest zip codes: 07009, 07042, 07013, 07003, 07424, 07028.
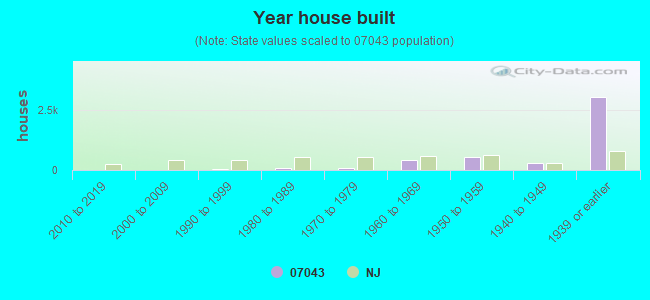


 Based on the data from the years 2004 - 2018 the average number of fire incidents per year is 27. The highest number of reported fires - 47 took place in 2010, and the least - 2 in 2018. The data has a dropping trend.
 When looking into fire subcategories, the most reports belonged to: Structure Fires (66.3%), and Outside Fires (25.1%).