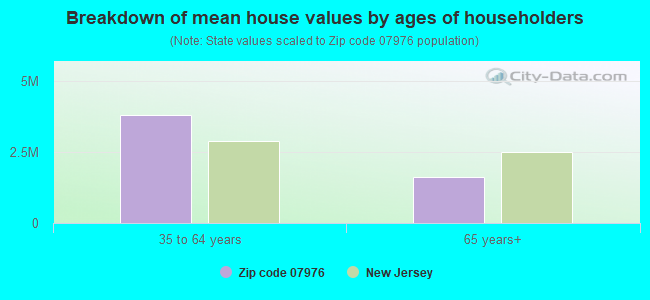
Estimated median house/condo value in 2022: $2,137,021
07976:
$2,137,021
New Jersey:
$428,900
Median resident age:
This zip code:
58.8 years
New Jersey median age:
40.4 years
Average household size:
This zip code:
2.2 people
New Jersey:
2.6 people
Averages for the 2020 tax year for zip code 07976, filed in 2021:
Average Adjusted Gross Income (AGI) in 2020: $791,476 (Individual Income Tax Returns)
Here:
$791,476
State:
$95,247
Salary/wage: $625,300 (reported on 65.1% of returns)
Here:
$625,300
State:
$80,635
(% of AGI for various income ranges: 1018.3% for AGIs below $25k, 5313.3% for AGIs $50k-75k, 23993.3% for AGIs $100k-200k, 610882.5% for AGIs over 200k)
Taxable interest for individuals: $18,276 (reported on 65.1% of returns)
This zip code:
$18,276
New Jersey:
$2,414
(% of AGI for various income ranges: 8.3% for AGIs below $25k, 53.3% for AGIs $50k-75k, 1083.3% for AGIs $100k-200k, 17772.5% for AGIs over 200k)
Ordinary dividends: $66,128 (reported on 68.3% of returns)
Here:
$66,128
State:
$8,057
(% of AGI for various income ranges: 181.7% for AGIs below $25k, 923.3% for AGIs $50k-75k, 5383.3% for AGIs $100k-200k, 64042.5% for AGIs over 200k)
Net capital gain/loss in AGI: +$281,590 (reported on 66.7% of returns)
Here:
+$281,590
State:
+$25,022
(% of AGI for various income ranges: 70.0% for AGIs below $25k, 1120.0% for AGIs $50k-75k, 5226.7% for AGIs $100k-200k, 290535.0% for AGIs over 200k)
Profit/loss from business: +$60,307 (reported on 23.8% of returns)
Here:
+$60,307
State:
+$18,035
(% of AGI for various income ranges: 226.7% for AGIs below $25k, 3570.0% for AGIs $100k-200k, 18547.5% for AGIs over 200k)
Taxable individual retirement arrangement distribution: $46,133 (reported on 14.3% of returns)
07976:
$46,133
New Jersey:
$21,558
(% of AGI for various income ranges: 2270.0% for AGIs $100k-200k, 7817.5% for AGIs over 200k)
Self-employed (Keogh) retirement plans: $71,567 (reported on 4.8% of returns)
07976:
$71,567
New Jersey:
$30,844
(% of AGI for various income ranges: 5367.5% for AGIs over 200k)
Total itemized deductions: $72,888 (reported on 41.3% of returns)
Here:
$72,888
State:
$32,863
(% of AGI for various income ranges: 4743.3% for AGIs $100k-200k, 42105.0% for AGIs over 200k)
Charity contributions: $38,917 (reported on 36.5% of returns)
Here:
$38,917
State:
$7,880
(% of AGI for various income ranges: 1053.3% for AGIs $100k-200k, 21587.5% for AGIs over 200k)
Taxes paid: $10,035 (reported on 41.3% of returns)
07976:
$10,035
State:
$9,183
(% of AGI for various income ranges: 1163.3% for AGIs $100k-200k, 5077.5% for AGIs over 200k)
Percentage of individuals using paid preparers for their 2020 taxes: 85.7%
Here:
86%
State:
92%
(% for various income ranges: 76.9% for AGIs below $25k, 80.0% for AGIs $25k-50k, 80.0% for AGIs $50k-75k, 75.0% for AGIs $75k-100k, 90.9% for AGIs $100k-200k, 92.0% for AGIs over 200k)
Averages for the 2012 tax year for zip code 07976, filed in 2013:
Average Adjusted Gross Income (AGI) in 2012: $750,140 (Individual Income Tax Returns)
Here:
$750,140
State:
$79,688
Salary/wage: $372,540 (reported on 70.6% of returns)
Here:
$372,540
State:
$68,122
(% of AGI for various income ranges: 66.4% for AGIs below $25k, 50.0% for AGIs $25k-50k, 64.5% for AGIs $50k-75k, 54.6% for AGIs $75k-100k, 39.3% for AGIs $100k-200k, 34.5% for AGIs over 200k)
Taxable interest for individuals: $14,090 (reported on 70.6% of returns)
This zip code:
$14,090
New Jersey:
$2,193
(% of AGI for various income ranges: 1.9% for AGIs below $25k, 2.6% for AGIs $25k-50k, 2.0% for AGIs $50k-75k, 0.2% for AGIs $75k-100k, 4.2% for AGIs $100k-200k, 1.2% for AGIs over 200k)
Ordinary dividends: $67,319 (reported on 70.6% of returns)
Here:
$67,319
State:
$6,828
(% of AGI for various income ranges: 16.1% for AGIs below $25k, 13.0% for AGIs $25k-50k, 11.9% for AGIs $50k-75k, 10.3% for AGIs $100k-200k, 6.2% for AGIs over 200k)
Net capital gain/loss in AGI: +$178,202 (reported on 66.2% of returns)
Here:
+$178,202
State:
+$15,358
(% of AGI for various income ranges: 14.6% for AGIs $50k-75k, 4.8% for AGIs $100k-200k, 16.3% for AGIs over 200k)
Profit/loss from business: +$91,015 (reported on 19.1% of returns)
Here:
+$91,015
State:
+$19,577
(% of AGI for various income ranges: 14.0% for AGIs $25k-50k, 9.3% for AGIs $100k-200k, 2.1% for AGIs over 200k)
Taxable individual retirement arrangement distribution: $65,023 (reported on 19.1% of returns)
07976:
$65,023
New Jersey:
$18,214
(% of AGI for various income ranges: 12.5% for AGIs below $25k, 7.9% for AGIs $100k-200k, 1.5% for AGIs over 200k)
Self-employment retirement plans: $32,500 (reported on 4.4% of returns)
07976:
$32,500
New Jersey:
$24,511
(% of AGI for various income ranges: 0.2% for AGIs over 200k)
Total itemized deductions: $176,298 (16% of AGI, reported on 66.2% of returns)
Here:
$176,298
State:
$30,827
Here:
15.8% of AGI
State:
21.2% of AGI
(% of AGI for various income ranges: 31.9% for AGIs below $25k, 25.9% for AGIs $25k-50k, 37.8% for AGIs $50k-75k, 27.2% for AGIs $100k-200k, 15.1% for AGIs over 200k)
Charity contributions: $26,360 (reported on 58.8% of returns)
Here:
$26,360
State:
$3,451
(% of AGI for various income ranges: 4.0% for AGIs below $25k, 3.0% for AGIs $50k-75k, 2.4% for AGIs $100k-200k, 2.1% for AGIs over 200k)
Taxes paid: $118,516 (reported on 64.7% of returns)
07976:
$118,516
State:
$15,801
(% of AGI for various income ranges: 16.0% for AGIs $25k-50k, 15.4% for AGIs $50k-75k, 11.0% for AGIs $100k-200k, 10.2% for AGIs over 200k)
Percentage of individuals using paid preparers for their 2012 taxes: 80.9%
Here:
81%
State:
65%
(% for various income ranges: 70.6% for AGIs below $25k, 83.3% for AGIs $25k-50k, 75.0% for AGIs $50k-75k, 100.0% for AGIs $75k-100k, 80.0% for AGIs $100k-200k, 85.7% for AGIs over 200k)
Averages for the 2004 tax year for zip code 07976, filed in 2005:
Average Adjusted Gross Income (AGI) in 2004: $562,011 (Individual Income Tax Returns)
Here:
$562,011
State:
$64,921
Salary/wage: $589,060 (reported on 66.1% of returns)
Here:
$589,060
State:
$57,755
(% of AGI for various income ranges: 53.4% for AGIs $10k-25k, 58.2% for AGIs $25k-50k, 48.7% for AGIs $50k-75k, 44.1% for AGIs $75k-100k, 69.1% for AGIs over 100k)
Taxable interest for individuals: $27,921 (reported on 82.5% of returns)
This zip code:
$27,921
New Jersey:
$2,068
(% of AGI for various income ranges: 8.5% for AGIs $10k-25k, 5.1% for AGIs $25k-50k, 5.1% for AGIs $50k-75k, 6.6% for AGIs $75k-100k, 4.0% for AGIs over 100k)
Taxable dividends: $37,108 (reported on 80.6% of returns)
Here:
$37,108
State:
$3,959
(% of AGI for various income ranges: 17.2% for AGIs $10k-25k, 11.5% for AGIs $25k-50k, 5.9% for AGIs $50k-75k, 8.0% for AGIs $75k-100k, 5.1% for AGIs over 100k)
Net capital gain/loss: +$175,971 (reported on 73.4% of returns)
Here:
+$175,971
State:
+$13,591
(% of AGI for various income ranges: 6.7% for AGIs $10k-25k, 3.9% for AGIs $25k-50k, 5.7% for AGIs $50k-75k, 6.0% for AGIs $75k-100k, 23.1% for AGIs over 100k)
Profit/loss from business: +$32,796 (reported on 20.8% of returns)
Here:
+$32,796
State:
+$17,520
(% of AGI for various income ranges: -1.9% for AGIs $25k-50k, 9.7% for AGIs $50k-75k, 1.2% for AGIs over 100k)
IRA payment deduction: $4,700 (reported on 4.0% of returns)
07976:
$4,700
New Jersey:
$3,270
Self-employed pension: $29,119 (reported on 5.6% of returns)
Here:
$29,119
New Jersey:
$17,258
Total itemized deductions: $124,323 (14% of AGI, reported on 61.8% of returns)
Here:
$124,323
State:
$23,924
Here:
13.7% of AGI
State:
21.1% of AGI
(% of AGI for various income ranges: 30.0% for AGIs $10k-25k, 24.5% for AGIs $25k-50k, 26.7% for AGIs $50k-75k, 23.7% for AGIs $75k-100k, 13.2% for AGIs over 100k)
Charity contributions deductions: $20,483 (2% of AGI, reported on 57.3% of returns)
Here:
$20,483
State:
$3,242
Here:
2.1% of AGI
State:
2.7% of AGI
(% of AGI for various income ranges: 1.9% for AGIs $10k-25k, 2.9% for AGIs $25k-50k, 2.4% for AGIs $50k-75k, 2.9% for AGIs $75k-100k, 2.1% for AGIs over 100k)
Total tax: $220,839 (reported on 83.1% of returns)
07976:
$220,839
State:
$12,321
(% of AGI for various income ranges: 4.7% for AGIs $10k-25k, 8.4% for AGIs $25k-50k, 10.6% for AGIs $50k-75k, 10.6% for AGIs $75k-100k, 32.9% for AGIs over 100k)
Earned income credit: $1,545 (reported on 1.5% of returns)
Here:
$1,545
State:
$1,711
Percentage of individuals using paid preparers for their 2004 taxes: 83.3%
Here:
83%
State:
65%
(% for various income ranges: 83.0% for AGIs below $10k, 77.9% for AGIs $10k-25k, 76.9% for AGIs $25k-50k, 80.0% for AGIs $50k-75k, 65.9% for AGIs $75k-100k, 88.6% for AGIs over 100k)
Tourist attraction (not listed on the city page) : Harding Township Historical Society - Office-Archives- Tunis-Ellicks H (Cultural Attractions- Events- & Facilities; Village Road & Millbro).
Size of family households: 115 2-persons, 11 3-persons, 10 4-persons
Size of nonfamily households: 14 1-person, 7 4-persons
10 married couples with children.
18 single-parent households (18 men).
93.6% of residents of 07976 zip code speak English at home.
3.2% of residents speak Spanish at home (100% very well).
2.9% of residents speak other Indo-European language at home (100% well).
Foreign born population: 0 (0.0%)
:
0.0%
Whole state:
23.5%
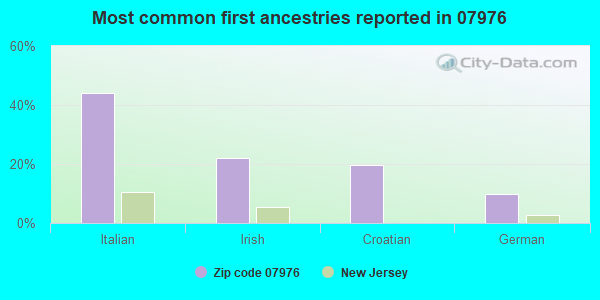
44%Italian
22%Irish
20%Croatian
10%German
Facilities with environmental interests located in this zip code:
ESTATE OF MARGETTS JOSEPHINE S (BLUE MILL RD in NEW VERNON, NJ)
STATE MASTER (New Jersey environmental info) - NJEMS-021534, STATE CLEANUP SITE National Pollutant Discharge Elimination System NON-MAJOR (Tracking pollutant discharge elimination systems) - permit Organizations: HARDING TWP (CONTACT/OPERATOR)
, MARGETTS W THOMAS (CONTACT/OWNER)
Alternative names: HARDING TWP, MARGETTS JOSEPHINE S ESTATE
HARDING TWP BD OF ED ELEMENTARY SCHOOL (1 LEES HILL ROAD in NEW VERNON, NJ)
STATE MASTER (New Jersey environmental info) - NJEMS-010679, STATE CLEANUP SITE, NJEMS-11215W, DRINKING WATER PROGRAM, NJEMS-1413300, NJEMS-1413301, NJEMS-47780, National Pollutant Discharge Elimination System Permit Small Quantity Generators, between 100 kg and 1000 kg of hazardous waste/month (Resource Conservation and Recovery Act (tracking hazardous waste)) - notification Business SIC classification: SCHOOLS AND EDUCATIONAL SERVICES Alternative names: HARDING TWP BD OF ED - HARDING TWP SCH, HARDING TOWNSHIP elementary school
NEW VERNON COACH & MOTOR WORKS INC (VILLAGE RD in NEW VERNON, NJ)
STATE MASTER (New Jersey environmental info) - NJEMS-65725000000, EPCRA, NJEMS-NJD982724999, HAZARDOUS WASTE PROGRAM Small Quantity Generators, between 100 kg and 1000 kg of hazardous waste/month (Resource Conservation and Recovery Act (tracking hazardous waste)) Business SIC classification: GENERAL AUTOMOTIVE REPAIR SHOPS
HARDING TWP (LEE'S HILL ROAD in NEW VERNON, NJ)
(National Center for Education Statistics) - STATE ID-050 Organizations: HARDING TOWNSHIP (SCHOOL DISTRICT)
NJDOT BIN 1419156 (BAILEYS MILL RD - RTE I-287 SB in NEW VERNON, NJ)
(Resource Conservation and Recovery Act (tracking hazardous waste))
NJDOT BIN 1419159 (GLEN ALPIN RD - I-287 MP 31.85 in NEW VERNON, NJ)
(Resource Conservation and Recovery Act (tracking hazardous waste))
NJDOT BIN 1419160 (SAN SPRING RD - I-287 MP 33.17 in NEW VERNON, NJ)
(Resource Conservation and Recovery Act (tracking hazardous waste))
BARBER PATRICIA W - RESIDENCE (FAWN HILL DR 3RD DOOR ON RIGHT in NEW VERNON, NJ)
(Resource Conservation and Recovery Act (tracking hazardous waste))
PORTER LAURA (LONG HILL & PLEASANTVILLE RD in NEW VERNON, NJ)
(Resource Conservation and Recovery Act (tracking hazardous waste))
HARDING TWP OF D P W (MILLBROOK RD in NEW VERNON, NJ)
(Resource Conservation and Recovery Act (tracking hazardous waste))
ALGONQUIN GAS TRANSMISSION COMPANY VALVE 6 (LONG HILL & PLEASANTVILLE ROAD in NEW VERNON, NJ)
Small Quantity Generators, between 100 kg and 1000 kg of hazardous waste/month (Resource Conservation and Recovery Act (tracking hazardous waste)) - notification
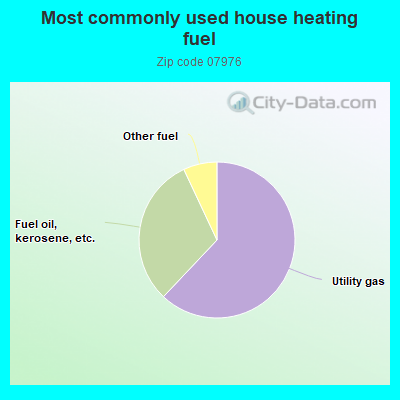
62.3%Utility gas
31.1%Fuel oil, kerosene, etc.
7.0%Other fuel
Population in 1990: 682. Population change in the 1990s: +47 (+6.9%).
Place of birth for U.S.-born residents:
This state: 288
Northeast: 34
Midwest: 11
South: 18
62% of the 07976 zip code residents lived in the same house 5 years ago. Out of people who lived in different houses, 71% lived in this county. Out of people who lived in different counties, 50% lived in New Jersey.
100% of the 07976 zip code residents lived in the same house 1 year ago.
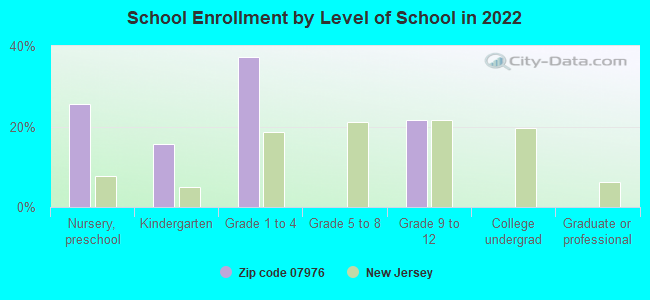
Private vs. public school enrollment:
Students in private schools in grades 1 to 8 (elementary and middle school): 11
Here:
56.6%
New Jersey:
12.3%
Students in private schools in grades 9 to 12 (high school):
Here:
0.0%
New Jersey:
13.1%
Companies with federal contracts located in this zip code:
SOUTH STREET CAPITAL HOLDING L (VILLAGE RD in NEW VERNON, NJ; small business)
$24,162 with Navy for Other Architect and Engineering Services. Taking place in GA. Signed on 2000-06-12. Completion date: 2000-08-12.
Top industries in this zip code by the number of employees in 2005:
Other Services (except Public Administration): Religious Organizations (20-49 employees: 1 establishment, 5-9 employees: 1 establishment)
Administrative and Support and Waste Management and Remediation Services: Landscaping Services (5-9: 2, 1-4: 2)
Finance and Insurance: Commercial Banking (5-9: 1, 1-4: 1)
Real Estate and Rental and Leasing: Offices of Real Estate Agents and Brokers (1-4: 4)
Wholesale Trade: Electrical and Electronic Appliance, Television, and Radio Set Merchant Wholesalers (5-9: 1)
Educational Services: Sports and Recreation Instruction (5-9: 1)
Professional, Scientific, and Technical Services: Computer Systems Design Services (5-9: 1)
Finance and Insurance: Third Party Administration of Insurance and Pension Funds (1-4: 1)
Health Care and Social Assistance: Child Day Care Services (1-4: 1)
People in group quarters in 2000:
2 people in religious group quarters
Home Mortgage Disclosure Act Aggregated Statistics For Year 2009 (Based on 2 partial tracts)
A) FHA, FSA/RHS & VA Home Purchase Loans
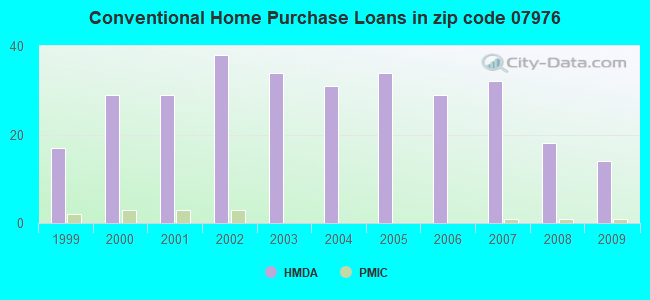
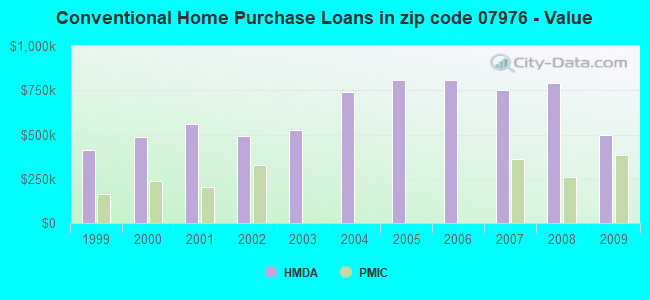
B) Conventional Home Purchase Loans
C) Refinancings
D) Home Improvement Loans
F) Non-occupant Loans on < 5 Family Dwellings (A B C & D)
Number
Average Value
Number
Average Value
Number
Average Value
Number
Average Value
Number
Average Value
LOANS ORIGINATED
2
$547,525
14
$498,078
58
$552,922
3
$455,223
1
$352,630
APPLICATIONS APPROVED, NOT ACCEPTED
0
$0
0
$0
6
$590,538
0
$0
1
$1,173,680
APPLICATIONS DENIED
0
$0
3
$392,190
20
$746,297
1
$735,660
0
$0
APPLICATIONS WITHDRAWN
0
$0
2
$337,680
10
$492,723
1
$988,920
1
$938,270
FILES CLOSED FOR INCOMPLETENESS
0
$0
1
$1,328,050
3
$497,997
0
$0
0
$0
Aggregated Statistics For Year 2008 (Based on 2 partial tracts)
B) Conventional Home Purchase Loans
C) Refinancings
D) Home Improvement Loans
F) Non-occupant Loans on < 5 Family Dwellings (A B C & D)
Number
Average Value
Number
Average Value
Number
Average Value
Number
Average Value
LOANS ORIGINATED
18
$790,627
27
$786,044
2
$262,665
1
$2,399,940
APPLICATIONS APPROVED, NOT ACCEPTED
2
$1,331,905
4
$635,320
0
$0
0
$0
APPLICATIONS DENIED
7
$1,892,041
12
$719,098
1
$569,230
0
$0
APPLICATIONS WITHDRAWN
5
$581,388
5
$453,166
0
$0
0
$0
FILES CLOSED FOR INCOMPLETENESS
0
$0
0
$0
0
$0
0
$0
Aggregated Statistics For Year 2007 (Based on 2 partial tracts)
B) Conventional Home Purchase Loans
C) Refinancings
D) Home Improvement Loans
F) Non-occupant Loans on < 5 Family Dwellings (A B C & D)
Number
Average Value
Number
Average Value
Number
Average Value
Number
Average Value
LOANS ORIGINATED
32
$753,946
32
$552,981
2
$184,275
3
$670,053
APPLICATIONS APPROVED, NOT ACCEPTED
6
$570,438
9
$660,244
0
$0
0
$0
APPLICATIONS DENIED
6
$839,537
11
$804,731
5
$223,738
2
$376,270
APPLICATIONS WITHDRAWN
5
$885,300
7
$737,246
0
$0
0
$0
FILES CLOSED FOR INCOMPLETENESS
0
$0
0
$0
0
$0
0
$0
Aggregated Statistics For Year 2006 (Based on 2 partial tracts)
B) Conventional Home Purchase Loans
C) Refinancings
D) Home Improvement Loans
F) Non-occupant Loans on < 5 Family Dwellings (A B C & D)
Number
Average Value
Number
Average Value
Number
Average Value
Number
Average Value
LOANS ORIGINATED
29
$805,641
34
$723,643
8
$205,321
2
$332,130
APPLICATIONS APPROVED, NOT ACCEPTED
3
$331,890
8
$813,749
0
$0
1
$494,460
APPLICATIONS DENIED
2
$598,415
13
$534,277
2
$156,780
3
$274,647
APPLICATIONS WITHDRAWN
1
$744,830
9
$942,288
0
$0
0
$0
FILES CLOSED FOR INCOMPLETENESS
1
$301,500
1
$722,150
2
$159,435
0
$0
Aggregated Statistics For Year 2005 (Based on 2 partial tracts)
B) Conventional Home Purchase Loans
C) Refinancings
D) Home Improvement Loans
F) Non-occupant Loans on < 5 Family Dwellings (A B C & D)
Number
Average Value
Number
Average Value
Number
Average Value
Number
Average Value
LOANS ORIGINATED
34
$805,906
41
$709,563
5
$433,388
3
$498,320
APPLICATIONS APPROVED, NOT ACCEPTED
3
$1,291,547
7
$340,850
0
$0
0
$0
APPLICATIONS DENIED
6
$512,068
9
$646,094
0
$0
2
$396,050
APPLICATIONS WITHDRAWN
5
$1,325,636
6
$661,048
0
$0
0
$0
FILES CLOSED FOR INCOMPLETENESS
2
$347,330
1
$743,380
0
$0
2
$347,330
Aggregated Statistics For Year 2004 (Based on 2 partial tracts)
B) Conventional Home Purchase Loans
C) Refinancings
D) Home Improvement Loans
F) Non-occupant Loans on < 5 Family Dwellings (A B C & D)
Number
Average Value
Number
Average Value
Number
Average Value
Number
Average Value
LOANS ORIGINATED
31
$741,698
41
$598,729
7
$171,114
0
$0
APPLICATIONS APPROVED, NOT ACCEPTED
4
$1,066,708
4
$565,252
2
$704,305
0
$0
APPLICATIONS DENIED
3
$508,450
7
$561,996
4
$241,562
1
$538,840
APPLICATIONS WITHDRAWN
5
$1,049,028
8
$1,038,125
1
$337,680
2
$1,856,760
FILES CLOSED FOR INCOMPLETENESS
1
$607,820
1
$1,089,740
1
$458,280
0
$0
Aggregated Statistics For Year 2003 (Based on 2 partial tracts)
B) Conventional Home Purchase Loans
C) Refinancings
D) Home Improvement Loans
F) Non-occupant Loans on < 5 Family Dwellings (A B C & D)
Number
Average Value
Number
Average Value
Number
Average Value
Number
Average Value
LOANS ORIGINATED
34
$524,752
149
$451,475
5
$215,246
5
$202,126
APPLICATIONS APPROVED, NOT ACCEPTED
6
$617,633
15
$346,588
1
$90,690
0
$0
APPLICATIONS DENIED
4
$502,660
16
$537,756
0
$0
0
$0
APPLICATIONS WITHDRAWN
5
$330,926
10
$405,409
1
$257,600
0
$0
FILES CLOSED FOR INCOMPLETENESS
0
$0
4
$692,002
0
$0
0
$0
Aggregated Statistics For Year 2002 (Based on 2 partial tracts)
B) Conventional Home Purchase Loans
C) Refinancings
D) Home Improvement Loans
F) Non-occupant Loans on < 5 Family Dwellings (A B C & D)
Number
Average Value
Number
Average Value
Number
Average Value
Number
Average Value
LOANS ORIGINATED
38
$490,664
115
$584,212
6
$161,042
3
$261,140
APPLICATIONS APPROVED, NOT ACCEPTED
3
$515,847
12
$333,539
1
$145,680
0
$0
APPLICATIONS DENIED
2
$689,590
14
$483,709
2
$218,285
1
$2,249,910
APPLICATIONS WITHDRAWN
2
$811,640
10
$388,332
1
$70,430
0
$0
FILES CLOSED FOR INCOMPLETENESS
0
$0
4
$615,180
0
$0
0
$0
Aggregated Statistics For Year 2001 (Based on 2 partial tracts)
B) Conventional Home Purchase Loans
C) Refinancings
D) Home Improvement Loans
F) Non-occupant Loans on < 5 Family Dwellings (A B C & D)
Number
Average Value
Number
Average Value
Number
Average Value
Number
Average Value
LOANS ORIGINATED
29
$557,139
55
$445,562
4
$141,102
2
$475,645
APPLICATIONS APPROVED, NOT ACCEPTED
4
$424,270
6
$453,215
1
$22,670
0
$0
APPLICATIONS DENIED
0
$0
9
$394,550
0
$0
0
$0
APPLICATIONS WITHDRAWN
2
$813,325
10
$338,838
1
$82,010
0
$0
FILES CLOSED FOR INCOMPLETENESS
0
$0
3
$225,603
0
$0
0
$0
Aggregated Statistics For Year 2000 (Based on 2 partial tracts)
A) FHA, FSA/RHS & VA Home Purchase Loans
B) Conventional Home Purchase Loans
C) Refinancings
D) Home Improvement Loans
F) Non-occupant Loans on < 5 Family Dwellings (A B C & D)
Number
Average Value
Number
Average Value
Number
Average Value
Number
Average Value
Number
Average Value
LOANS ORIGINATED
1
$107,090
29
$485,760
16
$478,782
4
$125,785
1
$328,510
APPLICATIONS APPROVED, NOT ACCEPTED
0
$0
3
$488,510
2
$412,695
1
$241,200
0
$0
APPLICATIONS DENIED
0
$0
3
$393,317
6
$488,752
0
$0
0
$0
APPLICATIONS WITHDRAWN
0
$0
3
$643,843
4
$222,748
1
$83,940
0
$0
FILES CLOSED FOR INCOMPLETENESS
0
$0
0
$0
0
$0
1
$149,540
0
$0
Aggregated Statistics For Year 1999 (Based on 1 partial tract)
B) Conventional Home Purchase Loans
C) Refinancings
D) Home Improvement Loans
F) Non-occupant Loans on < 5 Family Dwellings (A B C & D)
Detailed PMIC statistics for the following Tracts:0442.00
2004 - 2018 National Fire Incident Reporting System (NFIRS) incidents
Based on the data from the years 2004 - 2018 the average number of fires per year is 21. The highest number of reported fires - 45 took place in 2005, and the least - 9 in 2014. The data has a declining trend.
When looking into fire subcategories, the most incidents belonged to: Structure Fires (53.1%), and Outside Fires (24.7%).
Fire incident types reported to NFIRS in Zip Code 07976


 Nearest zip codes: 07933, 07935, 07980, 07946, 07960, 07928.


 Based on the data from the years 2004 - 2018 the average number of fires per year is 21. The highest number of reported fires - 45 took place in 2005, and the least - 9 in 2014. The data has a declining trend.
 When looking into fire subcategories, the most incidents belonged to: Structure Fires (53.1%), and Outside Fires (24.7%).