Estimated zip code population in 2022: 69,435 Zip code population in 2010: 59,048 Zip code population in 2000: 49,211
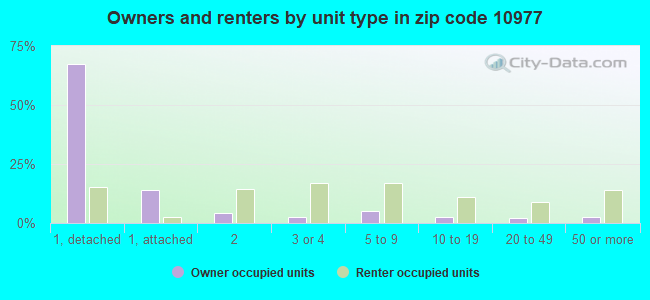
Houses and condos: 17,632 Renter-occupied apartments: 9,026
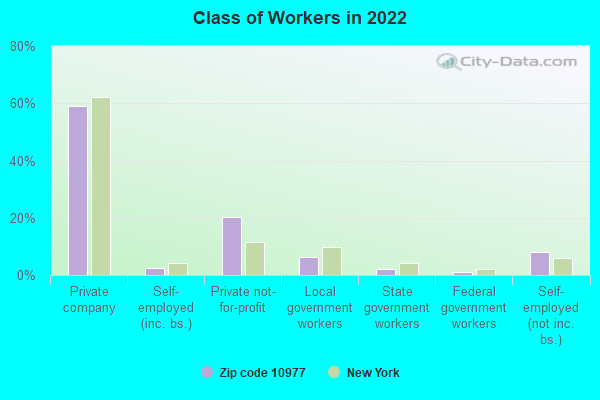
% of renters here:
54%
State:
46%
March 2022 cost of living index in zip code 10977: 145.1 (very high, U.S. average is 100)
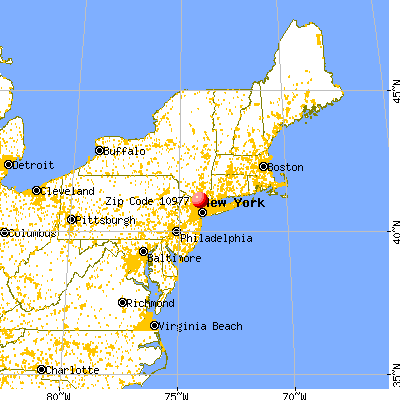
Land area: 11.1 sq. mi. Water area: 0.0 sq. mi.
Population density: 6,255 people per square mile
(high).
OSM Map
General Map
Google Map
MSN Map
OSM Map
General Map
Google Map
MSN Map
OSM Map
General Map
Google Map
MSN Map
OSM Map
General Map
Google Map
MSN Map
Please wait while loading the map...
Real estate property taxes paid for housing units in 2022:
This zip code:
1.6% ($9,805)
New York:
1.5% ($6,180)
Median real estate property taxes paid for housing units with mortgages in 2022: $9,858 (1.6%) Median real estate property taxes paid for housing units with no mortgage in 2022: $9,755 (1.7%)
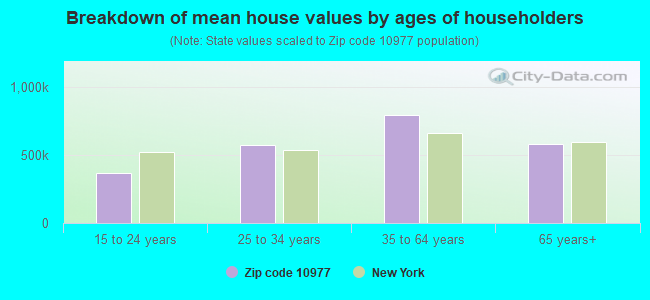
Estimated median house/condo value in 2022: $598,567
10977:
$598,567
New York:
$400,400
According to our research of New York and other state lists, there were 13 registered sex offenders living in 10977 zip code as of April 27, 2024. The ratio of all residents to sex offenders in zip code 10977 is 4,941 to 1. The ratio of registered sex offenders to all residents in this zip code is much lower than the state average.
Median resident age:
This zip code:
24.6 years
New York median age:
40.0 years
Average household size:
This zip code:
4.1 people
New York:
2.5 people
Averages for the 2020 tax year for zip code 10977, filed in 2021:
Average Adjusted Gross Income (AGI) in 2020: $58,986 (Individual Income Tax Returns)
Here:
$58,986
State:
$90,930
Salary/wage: $46,933 (reported on 82.0% of returns)
Here:
$46,933
State:
$72,104
(% of AGI for various income ranges: 1345.7% for AGIs below $25k, 3742.4% for AGIs $25k-50k, 6883.3% for AGIs $50k-75k, 10546.5% for AGIs $75k-100k, 18723.1% for AGIs $100k-200k, 78247.2% for AGIs over 200k)
Taxable interest for individuals: $2,336 (reported on 21.3% of returns)
This zip code:
$2,336
New York:
$3,075
(% of AGI for various income ranges: 7.4% for AGIs below $25k, 9.1% for AGIs $25k-50k, 23.1% for AGIs $50k-75k, 58.6% for AGIs $75k-100k, 221.0% for AGIs $100k-200k, 3189.6% for AGIs over 200k)
Ordinary dividends: $4,690 (reported on 10.8% of returns)
Here:
$4,690
State:
$11,095
(% of AGI for various income ranges: 9.7% for AGIs below $25k, 14.8% for AGIs $25k-50k, 38.2% for AGIs $50k-75k, 90.7% for AGIs $75k-100k, 309.6% for AGIs $100k-200k, 2405.2% for AGIs over 200k)
Net capital gain/loss in AGI: +$24,140 (reported on 10.8% of returns)
Here:
+$24,140
State:
+$44,925
(% of AGI for various income ranges: 15.6% for AGIs below $25k, 18.4% for AGIs $25k-50k, 62.3% for AGIs $50k-75k, 184.2% for AGIs $75k-100k, 567.6% for AGIs $100k-200k, 21973.2% for AGIs over 200k)
Profit/loss from business: +$12,518 (reported on 20.0% of returns)
Here:
+$12,518
State:
+$14,940
(% of AGI for various income ranges: 297.5% for AGIs below $25k, 181.7% for AGIs $25k-50k, 259.4% for AGIs $50k-75k, 351.7% for AGIs $75k-100k, 933.9% for AGIs $100k-200k, 5292.8% for AGIs over 200k)
Taxable individual retirement arrangement distribution: $17,361 (reported on 3.1% of returns)
10977:
$17,361
New York:
$19,609
(% of AGI for various income ranges: 13.7% for AGIs below $25k, 20.6% for AGIs $25k-50k, 72.0% for AGIs $50k-75k, 177.4% for AGIs $75k-100k, 386.8% for AGIs $100k-200k, 1419.6% for AGIs over 200k)
Self-employed (Keogh) retirement plans: $22,838 (reported on 0.3% of returns)
10977:
$22,838
New York:
$32,497
(% of AGI for various income ranges: 38.9% for AGIs $75k-100k, 567.6% for AGIs over 200k)
Total itemized deductions: $46,110 (reported on 12.2% of returns)
Here:
$46,110
State:
$39,326
(% of AGI for various income ranges: 42.1% for AGIs below $25k, 114.2% for AGIs $25k-50k, 430.0% for AGIs $50k-75k, 1094.6% for AGIs $75k-100k, 2723.3% for AGIs $100k-200k, 32316.8% for AGIs over 200k)
Charity contributions: $34,999 (reported on 9.4% of returns)
Here:
$34,999
State:
$15,420
(% of AGI for various income ranges: 4.0% for AGIs below $25k, 21.1% for AGIs $25k-50k, 95.4% for AGIs $50k-75k, 275.5% for AGIs $75k-100k, 980.2% for AGIs $100k-200k, 26453.2% for AGIs over 200k)
Taxes paid: $7,926 (reported on 12.1% of returns)
10977:
$7,926
State:
$9,183
(% of AGI for various income ranges: 14.9% for AGIs below $25k, 37.2% for AGIs $25k-50k, 135.7% for AGIs $50k-75k, 329.7% for AGIs $75k-100k, 762.4% for AGIs $100k-200k, 2320.4% for AGIs over 200k)
Earned income credit: $3,362 (reported on 26.7% of returns)
Here:
$3,362
State:
$2,138
(% of AGI for various income ranges: 206.6% for AGIs below $25k, 160.8% for AGIs $25k-50k, 5.2% for AGIs $50k-75k)
Percentage of individuals using paid preparers for their 2020 taxes: 92.6%
Here:
93%
State:
95%
(% for various income ranges: 89.5% for AGIs below $25k, 94.9% for AGIs $25k-50k, 94.2% for AGIs $50k-75k, 94.7% for AGIs $75k-100k, 95.4% for AGIs $100k-200k, 95.3% for AGIs over 200k)
Averages for the 2012 tax year for zip code 10977, filed in 2013:
Average Adjusted Gross Income (AGI) in 2012: $47,889 (Individual Income Tax Returns)
Here:
$47,889
State:
$77,088
Salary/wage: $41,782 (reported on 85.7% of returns)
Here:
$41,782
State:
$60,593
(% of AGI for various income ranges: 80.8% for AGIs below $25k, 88.1% for AGIs $25k-50k, 80.9% for AGIs $50k-75k, 79.2% for AGIs $75k-100k, 76.4% for AGIs $100k-200k, 52.4% for AGIs over 200k)
Taxable interest for individuals: $1,300 (reported on 23.9% of returns)
This zip code:
$1,300
New York:
$3,125
(% of AGI for various income ranges: 0.4% for AGIs below $25k, 0.2% for AGIs $25k-50k, 0.6% for AGIs $50k-75k, 0.4% for AGIs $75k-100k, 0.7% for AGIs $100k-200k, 1.2% for AGIs over 200k)
Ordinary dividends: $3,994 (reported on 12.2% of returns)
Here:
$3,994
State:
$10,299
(% of AGI for various income ranges: 0.5% for AGIs below $25k, 0.5% for AGIs $25k-50k, 0.8% for AGIs $50k-75k, 0.9% for AGIs $75k-100k, 1.0% for AGIs $100k-200k, 2.0% for AGIs over 200k)
Net capital gain/loss in AGI: +$9,702 (reported on 9.7% of returns)
Here:
+$9,702
State:
+$42,474
(% of AGI for various income ranges: 0.1% for AGIs below $25k, 0.2% for AGIs $25k-50k, 0.2% for AGIs $50k-75k, 0.6% for AGIs $100k-200k, 8.2% for AGIs over 200k)
Profit/loss from business: +$10,929 (reported on 18.7% of returns)
Here:
+$10,929
State:
+$16,168
(% of AGI for various income ranges: 12.4% for AGIs below $25k, 2.6% for AGIs $25k-50k, 3.1% for AGIs $50k-75k, 2.4% for AGIs $75k-100k, 2.8% for AGIs $100k-200k, 4.0% for AGIs over 200k)
Taxable individual retirement arrangement distribution: $15,418 (reported on 4.5% of returns)
10977:
$15,418
New York:
$17,621
(% of AGI for various income ranges: 0.8% for AGIs below $25k, 0.6% for AGIs $25k-50k, 1.7% for AGIs $50k-75k, 2.2% for AGIs $75k-100k, 2.0% for AGIs $100k-200k, 1.5% for AGIs over 200k)
Self-employment retirement plans: $18,400 (reported on 0.3% of returns)
10977:
$18,400
New York:
$27,330
(% of AGI for various income ranges: 0.2% for AGIs below $25k, 0.2% for AGIs $100k-200k, 0.3% for AGIs over 200k)
Total itemized deductions: $29,102 (29% of AGI, reported on 32.2% of returns)
Here:
$29,102
State:
$34,985
Here:
28.9% of AGI
State:
21.3% of AGI
(% of AGI for various income ranges: 6.9% for AGIs below $25k, 14.5% for AGIs $25k-50k, 21.0% for AGIs $50k-75k, 24.5% for AGIs $75k-100k, 24.0% for AGIs $100k-200k, 22.9% for AGIs over 200k)
Charity contributions: $6,509 (reported on 27.6% of returns)
Here:
$6,509
State:
$5,572
(% of AGI for various income ranges: 0.6% for AGIs below $25k, 1.4% for AGIs $25k-50k, 2.5% for AGIs $50k-75k, 3.4% for AGIs $75k-100k, 3.6% for AGIs $100k-200k, 8.7% for AGIs over 200k)
Taxes paid: $12,689 (reported on 31.5% of returns)
10977:
$12,689
State:
$18,656
(% of AGI for various income ranges: 3.1% for AGIs below $25k, 4.4% for AGIs $25k-50k, 8.3% for AGIs $50k-75k, 10.7% for AGIs $75k-100k, 11.3% for AGIs $100k-200k, 10.2% for AGIs over 200k)
Earned income credit: $3,060 (reported on 27.0% of returns)
Here:
$3,060
State:
$2,230
(% of AGI for various income ranges: 11.1% for AGIs below $25k, 1.5% for AGIs $25k-50k)
Percentage of individuals using paid preparers for their 2012 taxes: 73.3%
Here:
73%
State:
66%
(% for various income ranges: 71.8% for AGIs below $25k, 73.6% for AGIs $25k-50k, 74.9% for AGIs $50k-75k, 76.7% for AGIs $75k-100k, 75.5% for AGIs $100k-200k, 78.1% for AGIs over 200k)
Averages for the 2004 tax year for zip code 10977, filed in 2005:
Average Adjusted Gross Income (AGI) in 2004: $47,409 (Individual Income Tax Returns)
Here:
$47,409
State:
$59,519
Salary/wage: $41,973 (reported on 87.4% of returns)
Here:
$41,973
State:
$50,673
(% of AGI for various income ranges: 96.6% for AGIs below $10k, 84.9% for AGIs $10k-25k, 88.5% for AGIs $25k-50k, 85.7% for AGIs $50k-75k, 84.1% for AGIs $75k-100k, 65.0% for AGIs over 100k)
Taxable interest for individuals: $1,416 (reported on 41.9% of returns)
This zip code:
$1,416
New York:
$2,377
(% of AGI for various income ranges: 2.2% for AGIs below $10k, 1.2% for AGIs $10k-25k, 0.8% for AGIs $25k-50k, 0.9% for AGIs $50k-75k, 1.0% for AGIs $75k-100k, 1.6% for AGIs over 100k)
Taxable dividends: $2,280 (reported on 18.5% of returns)
Here:
$2,280
State:
$5,394
(% of AGI for various income ranges: 2.1% for AGIs below $10k, 0.8% for AGIs $10k-25k, 0.6% for AGIs $25k-50k, 0.7% for AGIs $50k-75k, 0.6% for AGIs $75k-100k, 1.1% for AGIs over 100k)
Net capital gain/loss: +$6,068 (reported on 14.1% of returns)
Here:
+$6,068
State:
+$23,581
(% of AGI for various income ranges: -1.1% for AGIs below $10k, 0.4% for AGIs $10k-25k, 0.1% for AGIs $25k-50k, 0.0% for AGIs $50k-75k, 0.6% for AGIs $75k-100k, 4.0% for AGIs over 100k)
Profit/loss from business: +$11,310 (reported on 15.2% of returns)
Here:
+$11,310
State:
+$13,809
(% of AGI for various income ranges: 14.9% for AGIs below $10k, 6.7% for AGIs $10k-25k, 2.8% for AGIs $25k-50k, 2.5% for AGIs $50k-75k, 2.4% for AGIs $75k-100k, 3.6% for AGIs over 100k)
IRA payment deduction: $3,474 (reported on 2.2% of returns)
10977:
$3,474
New York:
$3,115
(% of AGI for various income ranges: 0.1% for AGIs below $10k, 0.2% for AGIs $10k-25k, 0.2% for AGIs $25k-50k, 0.2% for AGIs $50k-75k, 0.2% for AGIs $75k-100k, 0.1% for AGIs over 100k)
Self-employed pension: $14,531 (reported on 0.7% of returns)
Here:
$14,531
New York:
$19,016
(% of AGI for various income ranges: 0.0% for AGIs $25k-50k, 0.1% for AGIs $50k-75k, 0.2% for AGIs $75k-100k, 0.4% for AGIs over 100k)
Total itemized deductions: $30,957 (34% of AGI, reported on 38.9% of returns)
Here:
$30,957
State:
$25,864
Here:
34.4% of AGI
State:
21.9% of AGI
(% of AGI for various income ranges: 10.9% for AGIs below $10k, 9.9% for AGIs $10k-25k, 18.5% for AGIs $25k-50k, 24.2% for AGIs $50k-75k, 26.3% for AGIs $75k-100k, 32.4% for AGIs over 100k)
Charity contributions deductions: $4,693 (5% of AGI, reported on 36.2% of returns)
Here:
$4,693
State:
$4,439
Here:
5.5% of AGI
State:
3.6% of AGI
(% of AGI for various income ranges: 0.6% for AGIs below $10k, 1.1% for AGIs $10k-25k, 2.7% for AGIs $25k-50k, 3.5% for AGIs $50k-75k, 4.1% for AGIs $75k-100k, 4.5% for AGIs over 100k)
Total tax: $7,471 (reported on 69.9% of returns)
10977:
$7,471
State:
$11,730
(% of AGI for various income ranges: 3.3% for AGIs below $10k, 3.6% for AGIs $10k-25k, 5.9% for AGIs $25k-50k, 8.0% for AGIs $50k-75k, 9.0% for AGIs $75k-100k, 16.9% for AGIs over 100k)
Earned income credit: $2,120 (reported on 21.0% of returns)
Here:
$2,120
State:
$1,757
Percentage of individuals using paid preparers for their 2004 taxes: 70.6%
Here:
71%
State:
67%
(% for various income ranges: 63.6% for AGIs below $10k, 69.0% for AGIs $10k-25k, 74.0% for AGIs $25k-50k, 74.0% for AGIs $50k-75k, 75.3% for AGIs $75k-100k, 73.4% for AGIs over 100k)
Likely homosexual households (counted as self-reported same-sex unmarried-partner households)
Lesbian couples: 0.1% of all households
Gay men: 0.0% of all households
Household received Food Stamps/SNAP in the past 12 months: 4,787 Household did not receive Food Stamps/SNAP in the past 12 months: 12,308
Women who had a birth in the past 12 months: 1,672 (1,575 now married, 75 unmarried) Women who did not have a birth in the past 12 months: 13,473 (6,369 now married, 7,033 unmarried)
Housing units in zip code 10977 with a mortgage: 5,126 (668 second mortgage, 9 home equity loan, 580 both second mortgage and home equity loan) Houses without a mortgage: 65
Median monthly owner costs for units with a mortgage: $3,243 Median monthly owner costs for units without a mortgage: $1,487
Residents with income below the poverty level in 2022:
This zip code:
29.7%
Whole state:
14.3%
Residents with income below 50% of the poverty level in 2022:
This zip code:
16.2%
Whole state:
6.8%
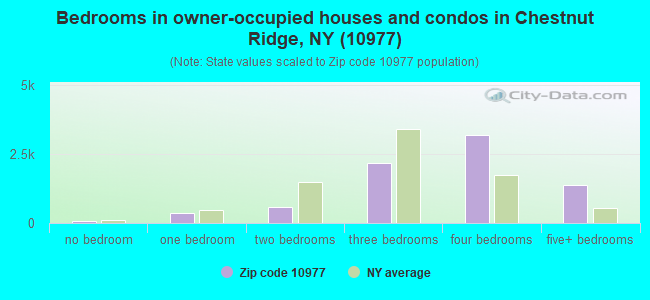
Median number of rooms in houses and condos:
Here:
7.2
State:
6.3
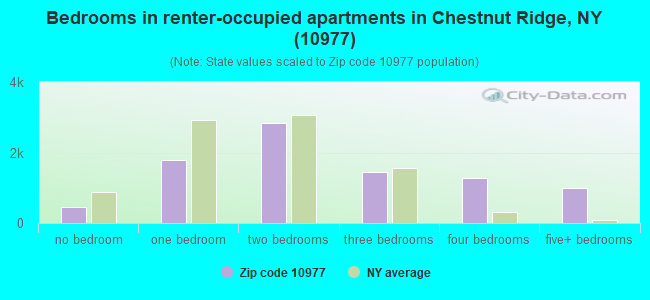
Median number of rooms in apartments:
Here:
4.5
State:
3.8
Notable locations in this zip code not listed on our city pages
Notable locations in zip code 10977: New York Country Club (A), Vacation Camp for the Blind (B), Duryea Farm (C), Matterhorn Nursery (D), Hillcrest Fire Company 1 (E), Spring Valley Fire Department Columbian Engine Company 1 (F), Finkelstein Memorial Library (G), Rockland Hook and Ladder Company (H), Cullens Hotel (I), Spring Valley Hook and Ladder Company (J), Senate Hotel (K), Spring Valley Municipal Building (L), The Holocaust Museum and Study Center (M), Chestnut Ridge Village Hall (N), The Esplanade at Chestnut Ridge (O), Evergreen Court Home for Adults Assisted Living Center (P), Golden Acres Home for Adults Assisted Living Center (Q), Hugh Gassner Fire Company (R). Display/hide their locations on the map
Churches in zip code 10977 include: New Life Pentecostal Church (A), Sons of Israel Synagogue (B), Saint Paul's African Methodist Episcopal Church (C), Saint James Greek Orthodox Church (D), First Baptist Church (E), Church of the Nazarene (F), Saint Joseph's Church (G), United Church of Spring Valley (H), First Congregational Church (I). Display/hide their locations on the map
22,998 married couples with children.
2,756 single-parent households (530 men, 2,226 women).
32.1% of residents of 10977 zip code speak English at home.
19.2% of residents speak Spanish at home (52% very well, 25% well, 16% not well, 7% not at all).
44.2% of residents speak other Indo-European language at home (39% very well, 35% well, 18% not well, 7% not at all).
2.0% of residents speak Asian or Pacific Island language at home (47% very well, 38% well, 13% not well, 2% not at all).
3.0% of residents speak other language at home (85% very well, 11% well, 3% not well, 1% not at all).
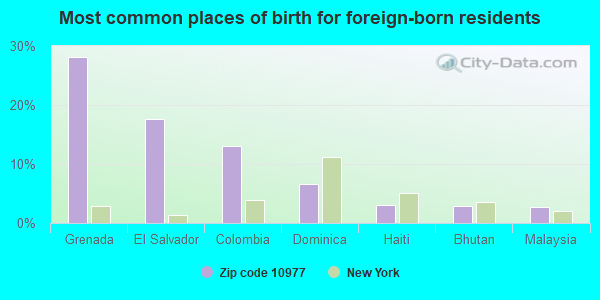
Foreign born population: 16,580 (23.9%) (49.3% of them are naturalized citizens)
Major facilities with environmental interests located in this zip code:
GROUP HOME ( in SPRING VALLEY, NY)
(National Center for Education Statistics) - STATE ID-500402890001 (National Center for Education Statistics) - STATE ID-500402890099 (National Center for Education Statistics) - STATE ID-500402890103 Organizations: EAST RAMAPO CSD (SPRING VALLEY) (SCHOOL DISTRICT)
CHOS CLEANERS INC (33 CHURCH STREET SUITE 2 in SPRING VALLEY, NY)
AIR MINOR (AIRS/AFS) STATE MASTER (New York facility tracking) - AIR PROGRAM Small Quantity Generators, between 100 kg and 1000 kg of hazardous waste/month (Resource Conservation and Recovery Act (tracking hazardous waste)) - notification Business SIC classification: DRYCLEANING PLANTS, EXCEPT RUG CLEANING Business NAICS classification: DRYCLEANING AND LAUNDRY SERVICES (EXCEPT COIN-OPERATED). Organizations: SEOKBONG CHO (CONTACT/OWNER)
CLEAN RITE CLEANERS (74 EAST ECKERSON ROAD in SPRING VALLEY, NY)
AIR MINOR (AIRS/AFS) STATE MASTER (New York facility tracking) - AIR PROGRAM Conditionally Exempt Small Quantity Generators, less than 100 kg/month of hazardous waste (Resource Conservation and Recovery Act (tracking hazardous waste)) - notification Conditionally Exempt Small Quantity Generators, less than 100 kg/month of hazardous waste (Resource Conservation and Recovery Act (tracking hazardous waste)) - notification Business SIC classification: DRYCLEANING PLANTS, EXCEPT RUG CLEANING Organizations: JOHN LIBIZZI REALTY CORP (CONTACT/OWNER)
, GEUN SU RYOO (CONTACT/OWNER)
COUNTRY CLUB CLEANERS (11 EAST CENTRAL AVE in SPRING VALLEY, NY)
AIR MINOR (AIRS/AFS) STATE MASTER (New York facility tracking) - AIR PROGRAM (Resource Conservation and Recovery Act (tracking hazardous waste)) Business SIC classification: DRYCLEANING PLANTS, EXCEPT RUG CLEANING Business NAICS classification: DRYCLEANING AND LAUNDRY SERVICES (EXCEPT COIN-OPERATED). Alternative names: COUNTRY CLUB CLEANERS CENTER, PLAZA 59 DRY CLEANERS
STATE MASTER (New York facility tracking) - AIR PROGRAM, HAZARDOUS WASTE PROGRAM (Resource Conservation and Recovery Act (tracking hazardous waste)) Business SIC classification: DRYCLEANING PLANTS, EXCEPT RUG CLEANING Business NAICS classification: DRYCLEANING AND LAUNDRY SERVICES (EXCEPT COIN-OPERATED). Alternative names: PANACHE CLEANERS
AGAPE SCHOOL ( in CHESTNUT RIDGE, NY)
(National Center for Education Statistics) - STATE ID-500414020003 Organizations: EDWIN GOULD ACADEMY-RAMAPO UFSD (SCHOOL DISTRICT)
AMOCO (140 EAST ROUTE 59 in SPRING VALLEY, NY)
(Resource Conservation and Recovery Act (tracking hazardous waste)) Organizations: BILL WOLF PETROLEUM CORP (CONTACT/OWNER)
, INTREPID MAINTENANCE CORP (CONTACT/OWNER)
Alternative names: 140 ROUTE 59
HEMPSTEAD ES ( in SPRING VALLEY, NY)
(National Center for Education Statistics) - STATE ID-500402060003 Organizations: EAST RAMAPO CSD (SPRING VALLEY) (SCHOOL DISTRICT)
IMANI SCHOOL ( in CHESTNUT RIDGE, NY)
(National Center for Education Statistics) - STATE ID-500414020004 Organizations: EDWIN GOULD ACADEMY-RAMAPO UFSD (SCHOOL DISTRICT)
CHESTNUT RIDGE MS ( in CHESTNUT RIDGE, NY)
(National Center for Education Statistics) - STATE ID-500402060013 Organizations: EAST RAMAPO CSD (SPRING VALLEY) (SCHOOL DISTRICT)
AMOCO SERVICE STATION (168 N MAIN STREET in SPRING VALLEY, NY)
(Integrated Compliance Information System) - ICIS-02-2004-7504, FORMAL ENFORCEMENT ACTION
CREST HILL CLEANERS (269 NORTH MAIN STREET in SPRING VALLEY, NY)
AIR MINOR (AIRS/AFS) (Resource Conservation and Recovery Act (tracking hazardous waste)) Business SIC classification: DRYCLEANING PLANTS, EXCEPT RUG CLEANING Alternative names: CRESTHILL CLEANERS
Housing units lacking complete plumbing facilities: 1.1% Housing units lacking complete kitchen facilities: 1.6%
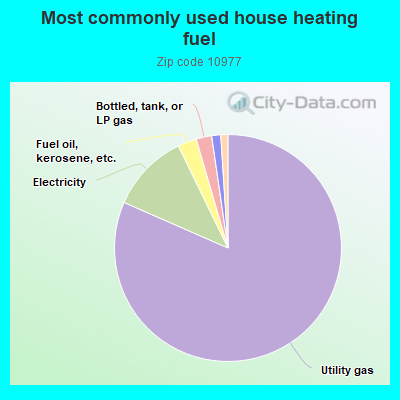
81.5%Utility gas
11.2%Electricity
2.7%Fuel oil, kerosene, etc.
2.2%Bottled, tank, or LP gas
1.3%Other fuel
1.0%No fuel used
Population in 1990: 43,435. Population change in the 1990s: +5,776 (+13.3%).
Place of birth for U.S.-born residents:
This state: 44,741
Northeast: 3,209
Midwest: 294
South: 1,589
West: 343
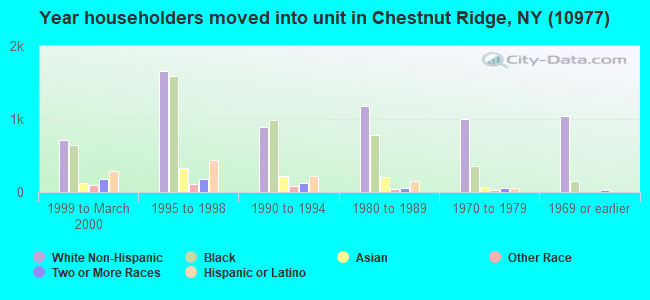
65% of the 10977 zip code residents lived in the same house 5 years ago. Out of people who lived in different houses, 66% lived in this county. Out of people who lived in different counties, 50% lived in New York.
92% of the 10977 zip code residents lived in the same house 1 year ago. Out of people who lived in different houses, 56% moved from this county. Out of people who lived in different houses, 28% moved from different county within same state. Out of people who lived in different houses, 5% moved from different state. Out of people who lived in different houses, 9% moved from abroad.
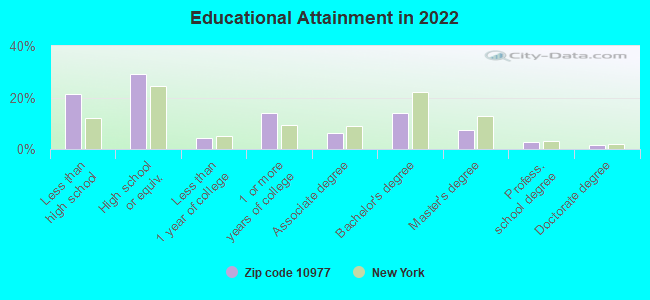
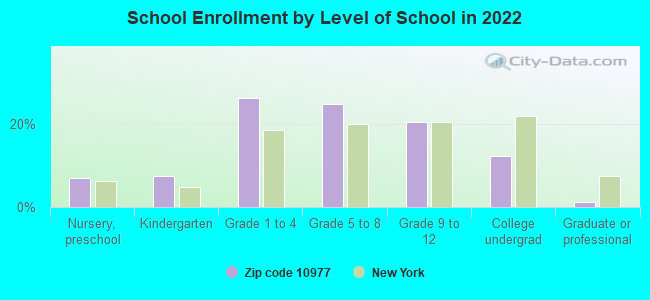
Private vs. public school enrollment:
Students in private schools in grades 1 to 8 (elementary and middle school): 10,238
Here:
75.4%
New York:
15.6%
Students in private schools in grades 9 to 12 (high school): 3,299
Here:
62.1%
New York:
15.0%
Students in private undergraduate colleges: 2,018
Here:
61.3%
New York:
39.2%
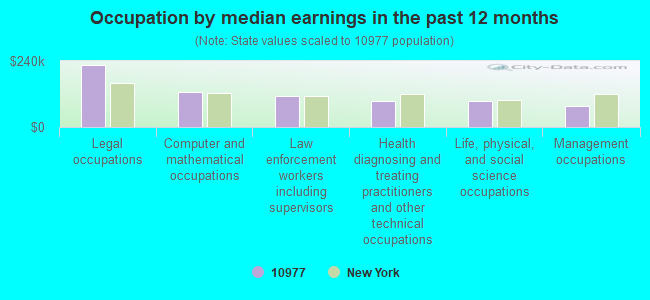
Occupation by median earnings in the past 12 months ($)
226,819Legal occupations
128,817Computer and mathematical occupations
111,059Law enforcement workers including supervisors
94,991Health diagnosing and treating practitioners and other technical occupations
94,599Life, physical, and social science occupations
75,941Management occupations
Companies with federal contracts located in this zip code:
LECROY CORPORATION (700 CHESTNUT RIDGE RD in CHESTNUT RIDGE, NY; small business) : $14,372,067 in 144 contractsfrom 1999 to 2006
Contracts for Electrical and Electronic Properties Measuring and Testing Instruments, Combination and Miscellaneous Instruments, Communications Security Equipment and Components, Services -- Basic Research (R&D), and moreby Air Force, Navy, Virginia Contracting Activity, Army, and others Signed by year:2000: $3,800,362; 2001: $5,038,556; 2002: $928,900; 2003: $1,087,720; 2004: $2,389,389; 2005: $789,766; 2006: $223,347.
Biggest contracts:
$2,985,195 with Air Force for Electrical and Electronic Properties Measuring and Testing Instruments. Signed on 2000-05-25. Completion date: 2000-06-15.
$2,197,245, same as above.Signed on 2001-08-13. Completion date: 2002-01-31.
$2,141,390, same as above.Signed on 2001-06-05. Completion date: 2001-10-31.
$1,026,000, same as above.Signed on 2004-06-22. Completion date: 2007-09-30.
ROCKLAND TREE EXPERT CO INC (11 MCNAMARA RD in SPRING VALLEY, NY; small business) : $2,115,761 in 42 contractsfrom 1999 to 2006
Contracts for Landscaping/Groundskeeping Services, Site Preparation, Tree Thinning Services by Army, National Park Service Signed by year:2000: $307,700; 2001: $249,405; 2002: $225,958; 2003: $476,821; 2004: $175,608; 2005: $307,510; 2006: $234,164.
Biggest contracts:
$148,740 with Army for Landscaping/Groundskeeping Services. Signed on 2006-04-03. Completion date: 2003-09-30.
$117,640, same as above.Signed on 2003-09-17. Completion date: 2003-11-28.
$102,518, same as above.Signed on 2005-01-24. Completion date: 2003-09-30.
$99,612, same as above.Signed on 2003-12-04. Completion date: 2003-09-30.
GROUNDSCARE LTD (787 CHESTNUT RIDGE RD in CHESTNUT RIDGE, NY; small business) : $1,229,937 in 11 contractsfrom 2002 to 2004
Contracts for Landscaping/Groundskeeping Services by Army Signed by year:2000: $0; 2001: $0; 2002: $437,722; 2003: $611,917; 2004: $180,298; 2005: $0; 2006: $0.
Biggest contracts:
$474,307 with Army for Landscaping/Groundskeeping Services. Signed on 2004-02-18. Completion date: 2003-02-28.
$470,043, same as above.Signed on 2003-02-24. Completion date: 2003-02-28.
$458,399, same as above.Signed on 2004-04-29. Completion date: 2003-02-28.
$437,722, same as above.Signed on 2002-03-21. Completion date: 2003-02-28.
U S POLYCHEMICAL HOLDING CORP (584-586 CHESTNUT RIDGE RD in CHESTNUT RIDGE, NY; small business) : $32,039 in 4 contractsfrom 2004 to 2005
$14,097 with Defense Logistics Agency for Miscellaneous Chemical Specialties. Signed on 2005-07-19. Completion date: 2005-08-15.
$8,971, same as above.Signed on 2005-02-03. Completion date: 2005-02-28.
$4,635, same as above.Signed on 2005-02-03. Completion date: 2005-02-28.
$4,336, same as above.Signed on 2004-10-05. Completion date: 2004-11-04.
HEMISPHERIC AIR STRUCTURES SYS (96 SCOTLAND HILL RD in SPRING VALLEY, NY; small business)
$11,740 with Air Force for Warehousing and Storage Services. Signed on 2006-04-10. Completion date: 2006-04-14.
PARKER HANNIFIN CORPORATION (200 RAM RIDGE ROAD in CHESTNUT RIDGE, NY) : $10,460 in 3 contractsfrom 2003 to 2004
$5,400 with Army for Pipe, Tube and Rigid Tubing. Signed on 2003-12-16. Completion date: 2004-01-31.
$3,810, same as above.Signed on 2004-01-14. Completion date: 2004-02-28.
$1,250, same as above.Signed on 2004-01-14. Completion date: 2004-02-28.
INTERNATIONAL ADVANCED MATERIA (2 N COLE AVE in SPRING VALLEY, NY; small business)
$8,890 with Army for Wire, Nonelectrical, Nonferrous Base Metal. Signed on 2003-04-24. Completion date: 2003-05-28.
SARAFAN AUTO SUPPLY, INC (23 NORTH MADISON AVENUE in SPRING VALLEY, NY; small business)
$5,000 with Army for Vehicular Cab, Body, and Frame Structural Components. Taking place in KS. Signed on 2001-12-17. Completion date: 2001-12-28.
Top industries in this zip code by the number of employees in 2005:
2002 - 2018 National Fire Incident Reporting System (NFIRS) incidents
Based on the data from the years 2002 - 2018 the average number of fires per year is 109. The highest number of fire incidents - 182 took place in 2004, and the least - 32 in 2003. The data has a rising trend.
When looking into fire subcategories, the most reports belonged to: Structure Fires (55.1%), and Outside Fires (31.5%).
Fire incident types reported to NFIRS in Zip Code 10977


 Nearest zip codes: 10952, 10954, 10901, 07645, 10956, 10965.


 Based on the data from the years 2002 - 2018 the average number of fires per year is 109. The highest number of fire incidents - 182 took place in 2004, and the least - 32 in 2003. The data has a rising trend.
 When looking into fire subcategories, the most reports belonged to: Structure Fires (55.1%), and Outside Fires (31.5%).