Estimated zip code population in 2022: 22,087 Zip code population in 2010: 22,658 Zip code population in 2000: 23,012
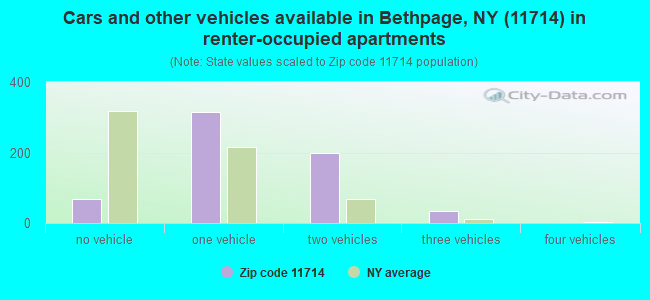
Houses and condos: 8,101 Renter-occupied apartments: 619
% of renters here:
8%
State:
46%
March 2022 cost of living index in zip code 11714: 150.2 (very high, U.S. average is 100)
Land area: 4.3 sq. mi. Water area: 0.0 sq. mi.
Population density: 5,113 people per square mile
(average).
OSM Map
General Map
Google Map
MSN Map
OSM Map
General Map
Google Map
MSN Map
OSM Map
General Map
Google Map
MSN Map
OSM Map
General Map
Google Map
MSN Map
Please wait while loading the map...
Real estate property taxes paid for housing units in 2022:
This zip code:
1.7% ($9,805)
New York:
1.5% ($6,180)
Median real estate property taxes paid for housing units with mortgages in 2022: $9,858 (1.6%) Median real estate property taxes paid for housing units with no mortgage in 2022: $9,755 (1.9%)
Estimated median house/condo value in 2022: $583,035
11714:
$583,035
New York:
$400,400
According to our research of New York and other state lists, there was 1 registered sex offender living in 11714 zip code as of April 27, 2024. The ratio of all residents to sex offenders in zip code 11714 is 21,745 to 1. The ratio of registered sex offenders to all residents in this zip code is much lower than the state average.
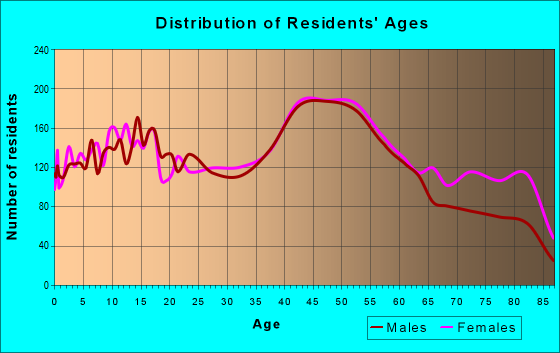
Median resident age:
This zip code:
47.0 years
New York median age:
40.0 years
Average household size:
This zip code:
2.7 people
New York:
2.5 people
Averages for the 2020 tax year for zip code 11714, filed in 2021:
Average Adjusted Gross Income (AGI) in 2020: $84,875 (Individual Income Tax Returns)
Here:
$84,875
State:
$90,930
Salary/wage: $78,129 (reported on 78.8% of returns)
Here:
$78,129
State:
$72,104
(% of AGI for various income ranges: 1003.0% for AGIs below $25k, 3431.1% for AGIs $25k-50k, 6612.1% for AGIs $50k-75k, 9622.0% for AGIs $75k-100k, 18328.0% for AGIs $100k-200k, 64566.7% for AGIs over 200k)
Taxable interest for individuals: $1,181 (reported on 54.3% of returns)
This zip code:
$1,181
New York:
$3,075
(% of AGI for various income ranges: 50.6% for AGIs below $25k, 58.5% for AGIs $25k-50k, 84.5% for AGIs $50k-75k, 120.8% for AGIs $75k-100k, 148.7% for AGIs $100k-200k, 453.9% for AGIs over 200k)
Ordinary dividends: $3,934 (reported on 30.1% of returns)
Here:
$3,934
State:
$11,095
(% of AGI for various income ranges: 51.5% for AGIs below $25k, 77.1% for AGIs $25k-50k, 106.3% for AGIs $50k-75k, 190.8% for AGIs $75k-100k, 253.6% for AGIs $100k-200k, 1546.1% for AGIs over 200k)
Net capital gain/loss in AGI: +$8,376 (reported on 25.9% of returns)
Here:
+$8,376
State:
+$44,925
(% of AGI for various income ranges: 10.7% for AGIs below $25k, 56.3% for AGIs $25k-50k, 77.7% for AGIs $50k-75k, 155.7% for AGIs $75k-100k, 406.5% for AGIs $100k-200k, 4818.3% for AGIs over 200k)
Profit/loss from business: +$11,628 (reported on 13.5% of returns)
Here:
+$11,628
State:
+$14,940
(% of AGI for various income ranges: 151.2% for AGIs below $25k, 217.6% for AGIs $25k-50k, 169.1% for AGIs $50k-75k, 251.3% for AGIs $75k-100k, 280.8% for AGIs $100k-200k, 1296.4% for AGIs over 200k)
Taxable individual retirement arrangement distribution: $16,625 (reported on 12.1% of returns)
11714:
$16,625
New York:
$19,609
(% of AGI for various income ranges: 112.3% for AGIs below $25k, 198.2% for AGIs $25k-50k, 231.0% for AGIs $50k-75k, 373.2% for AGIs $75k-100k, 520.5% for AGIs $100k-200k, 1462.8% for AGIs over 200k)
Self-employed (Keogh) retirement plans: $21,180 (reported on 0.4% of returns)
11714:
$21,180
New York:
$32,497
(% of AGI for various income ranges: 29.4% for AGIs $100k-200k, 154.7% for AGIs over 200k)
Total itemized deductions: $27,440 (reported on 16.7% of returns)
Here:
$27,440
State:
$39,326
(% of AGI for various income ranges: 127.4% for AGIs below $25k, 280.6% for AGIs $25k-50k, 515.7% for AGIs $50k-75k, 851.0% for AGIs $75k-100k, 1406.5% for AGIs $100k-200k, 3786.7% for AGIs over 200k)
Charity contributions: $3,987 (reported on 14.7% of returns)
Here:
$3,987
State:
$15,420
(% of AGI for various income ranges: 5.9% for AGIs below $25k, 23.5% for AGIs $25k-50k, 44.5% for AGIs $50k-75k, 88.0% for AGIs $75k-100k, 165.2% for AGIs $100k-200k, 794.2% for AGIs over 200k)
Taxes paid: $9,446 (reported on 16.7% of returns)
11714:
$9,446
State:
$9,183
(% of AGI for various income ranges: 46.8% for AGIs below $25k, 100.1% for AGIs $25k-50k, 196.5% for AGIs $50k-75k, 311.5% for AGIs $75k-100k, 494.0% for AGIs $100k-200k, 1115.8% for AGIs over 200k)
Earned income credit: $1,689 (reported on 6.8% of returns)
Here:
$1,689
State:
$2,138
(% of AGI for various income ranges: 41.5% for AGIs below $25k, 42.5% for AGIs $25k-50k)
Percentage of individuals using paid preparers for their 2020 taxes: 95.2%
Here:
95%
State:
95%
(% for various income ranges: 92.9% for AGIs below $25k, 96.0% for AGIs $25k-50k, 95.6% for AGIs $50k-75k, 96.4% for AGIs $75k-100k, 95.9% for AGIs $100k-200k, 97.0% for AGIs over 200k)
Averages for the 2012 tax year for zip code 11714, filed in 2013:
Average Adjusted Gross Income (AGI) in 2012: $69,594 (Individual Income Tax Returns)
Here:
$69,594
State:
$77,088
Salary/wage: $65,331 (reported on 80.8% of returns)
Here:
$65,331
State:
$60,593
(% of AGI for various income ranges: 61.2% for AGIs below $25k, 71.3% for AGIs $25k-50k, 72.3% for AGIs $50k-75k, 75.5% for AGIs $75k-100k, 83.2% for AGIs $100k-200k, 69.4% for AGIs over 200k)
Taxable interest for individuals: $1,194 (reported on 57.2% of returns)
This zip code:
$1,194
New York:
$3,125
(% of AGI for various income ranges: 2.7% for AGIs below $25k, 1.4% for AGIs $25k-50k, 1.0% for AGIs $50k-75k, 1.0% for AGIs $75k-100k, 0.6% for AGIs $100k-200k, 0.9% for AGIs over 200k)
Ordinary dividends: $2,945 (reported on 30.0% of returns)
Here:
$2,945
State:
$10,299
(% of AGI for various income ranges: 2.9% for AGIs below $25k, 1.6% for AGIs $25k-50k, 1.3% for AGIs $50k-75k, 1.0% for AGIs $75k-100k, 0.9% for AGIs $100k-200k, 1.7% for AGIs over 200k)
Net capital gain/loss in AGI: +$2,024 (reported on 20.0% of returns)
Here:
+$2,024
State:
+$42,474
(% of AGI for various income ranges: 0.4% for AGIs $100k-200k, 2.6% for AGIs over 200k)
Profit/loss from business: +$12,839 (reported on 11.4% of returns)
Here:
+$12,839
State:
+$16,168
(% of AGI for various income ranges: 5.6% for AGIs below $25k, 2.9% for AGIs $25k-50k, 2.5% for AGIs $50k-75k, 1.3% for AGIs $75k-100k, 1.2% for AGIs $100k-200k, 3.0% for AGIs over 200k)
Taxable individual retirement arrangement distribution: $11,805 (reported on 15.0% of returns)
11714:
$11,805
New York:
$17,621
(% of AGI for various income ranges: 6.7% for AGIs below $25k, 3.9% for AGIs $25k-50k, 3.5% for AGIs $50k-75k, 2.7% for AGIs $75k-100k, 1.7% for AGIs $100k-200k, 1.7% for AGIs over 200k)
Self-employment retirement plans: $24,580 (reported on 0.4% of returns)
11714:
$24,580
New York:
$27,330
Total itemized deductions: $26,698 (25% of AGI, reported on 50.9% of returns)
Here:
$26,698
State:
$34,985
Here:
24.9% of AGI
State:
21.3% of AGI
(% of AGI for various income ranges: 18.1% for AGIs below $25k, 17.8% for AGIs $25k-50k, 18.6% for AGIs $50k-75k, 20.8% for AGIs $75k-100k, 21.4% for AGIs $100k-200k, 16.7% for AGIs over 200k)
Charity contributions: $2,245 (reported on 46.5% of returns)
Here:
$2,245
State:
$5,572
(% of AGI for various income ranges: 1.0% for AGIs below $25k, 1.4% for AGIs $25k-50k, 1.5% for AGIs $50k-75k, 1.6% for AGIs $75k-100k, 1.6% for AGIs $100k-200k, 1.4% for AGIs over 200k)
Taxes paid: $13,588 (reported on 50.8% of returns)
11714:
$13,588
State:
$18,656
(% of AGI for various income ranges: 7.6% for AGIs below $25k, 7.7% for AGIs $25k-50k, 8.8% for AGIs $50k-75k, 10.4% for AGIs $75k-100k, 11.0% for AGIs $100k-200k, 9.8% for AGIs over 200k)
Earned income credit: $1,855 (reported on 6.7% of returns)
Here:
$1,855
State:
$2,230
(% of AGI for various income ranges: 2.5% for AGIs below $25k, 0.5% for AGIs $25k-50k)
Percentage of individuals using paid preparers for their 2012 taxes: 70.3%
Here:
70%
State:
66%
(% for various income ranges: 62.8% for AGIs below $25k, 67.1% for AGIs $25k-50k, 72.7% for AGIs $50k-75k, 76.4% for AGIs $75k-100k, 78.4% for AGIs $100k-200k, 78.8% for AGIs over 200k)
Averages for the 2004 tax year for zip code 11714, filed in 2005:
Average Adjusted Gross Income (AGI) in 2004: $55,378 (Individual Income Tax Returns)
Here:
$55,378
State:
$59,519
Salary/wage: $54,656 (reported on 79.8% of returns)
Here:
$54,656
State:
$50,673
(% of AGI for various income ranges: 89.5% for AGIs below $10k, 55.7% for AGIs $10k-25k, 74.5% for AGIs $25k-50k, 78.4% for AGIs $50k-75k, 81.7% for AGIs $75k-100k, 82.0% for AGIs over 100k)
Taxable interest for individuals: $1,432 (reported on 70.4% of returns)
This zip code:
$1,432
New York:
$2,377
(% of AGI for various income ranges: 11.3% for AGIs below $10k, 5.8% for AGIs $10k-25k, 2.5% for AGIs $25k-50k, 1.5% for AGIs $50k-75k, 1.2% for AGIs $75k-100k, 1.2% for AGIs over 100k)
Taxable dividends: $1,881 (reported on 37.1% of returns)
Here:
$1,881
State:
$5,394
(% of AGI for various income ranges: 7.5% for AGIs below $10k, 3.1% for AGIs $10k-25k, 1.3% for AGIs $25k-50k, 1.2% for AGIs $50k-75k, 0.9% for AGIs $75k-100k, 1.0% for AGIs over 100k)
Net capital gain/loss: +$2,083 (reported on 28.1% of returns)
Here:
+$2,083
State:
+$23,581
(% of AGI for various income ranges: -6.4% for AGIs below $10k, -0.4% for AGIs $10k-25k, 0.5% for AGIs $25k-50k, -0.0% for AGIs $50k-75k, 0.4% for AGIs $75k-100k, 2.4% for AGIs over 100k)
Profit/loss from business: +$10,281 (reported on 11.3% of returns)
Here:
+$10,281
State:
+$13,809
(% of AGI for various income ranges: 6.8% for AGIs below $10k, 4.9% for AGIs $10k-25k, 2.7% for AGIs $25k-50k, 1.7% for AGIs $50k-75k, 1.4% for AGIs $75k-100k, 1.9% for AGIs over 100k)
IRA payment deduction: $3,236 (reported on 3.6% of returns)
11714:
$3,236
New York:
$3,115
(% of AGI for various income ranges: 0.3% for AGIs $10k-25k, 0.4% for AGIs $25k-50k, 0.2% for AGIs $50k-75k, 0.2% for AGIs $75k-100k, 0.1% for AGIs over 100k)
Self-employed pension: $11,645 (reported on 0.7% of returns)
Here:
$11,645
New York:
$19,016
(% of AGI for various income ranges: 0.1% for AGIs $25k-50k, 0.1% for AGIs $50k-75k, 0.1% for AGIs $75k-100k, 0.2% for AGIs over 100k)
Total itemized deductions: $21,438 (26% of AGI, reported on 53.1% of returns)
Here:
$21,438
State:
$25,864
Here:
26.0% of AGI
State:
21.9% of AGI
(% of AGI for various income ranges: 22.9% for AGIs below $10k, 22.5% for AGIs $10k-25k, 18.4% for AGIs $25k-50k, 21.8% for AGIs $50k-75k, 23.5% for AGIs $75k-100k, 19.2% for AGIs over 100k)
Charity contributions deductions: $2,476 (3% of AGI, reported on 50.7% of returns)
Here:
$2,476
State:
$4,439
Here:
2.9% of AGI
State:
3.6% of AGI
(% of AGI for various income ranges: 1.4% for AGIs below $10k, 2.0% for AGIs $10k-25k, 2.0% for AGIs $25k-50k, 2.4% for AGIs $50k-75k, 2.5% for AGIs $75k-100k, 2.3% for AGIs over 100k)
Total tax: $7,753 (reported on 81.0% of returns)
11714:
$7,753
State:
$11,730
(% of AGI for various income ranges: 2.8% for AGIs below $10k, 3.9% for AGIs $10k-25k, 7.7% for AGIs $25k-50k, 9.1% for AGIs $50k-75k, 9.2% for AGIs $75k-100k, 15.8% for AGIs over 100k)
Earned income credit: $1,324 (reported on 5.3% of returns)
Here:
$1,324
State:
$1,757
Percentage of individuals using paid preparers for their 2004 taxes: 69.8%
Here:
70%
State:
67%
(% for various income ranges: 61.3% for AGIs below $10k, 68.3% for AGIs $10k-25k, 67.3% for AGIs $25k-50k, 74.7% for AGIs $50k-75k, 74.6% for AGIs $75k-100k, 75.7% for AGIs over 100k)
Household received Food Stamps/SNAP in the past 12 months: 219 Household did not receive Food Stamps/SNAP in the past 12 months: 7,726
Women who had a birth in the past 12 months: 265 (209 now married, 53 unmarried) Women who did not have a birth in the past 12 months: 4,313 (2,243 now married, 2,037 unmarried)
Housing units in zip code 11714 with a mortgage: 4,159 (601 second mortgage, 584 both second mortgage and home equity loan) Houses without a mortgage: 215
Median monthly owner costs for units with a mortgage: $3,107 Median monthly owner costs for units without a mortgage: $1,336
Residents with income below the poverty level in 2022:
This zip code:
4.6%
Whole state:
14.3%
Residents with income below 50% of the poverty level in 2022:
This zip code:
2.5%
Whole state:
6.8%
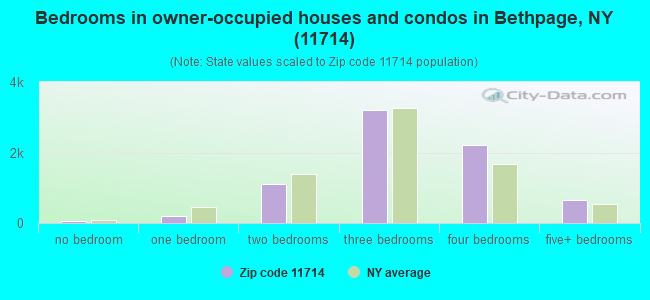
Median number of rooms in houses and condos:
Here:
6.6
State:
6.3
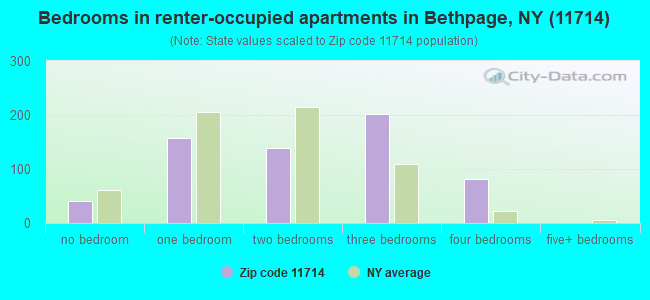
Median number of rooms in apartments:
Here:
4.5
State:
3.8
Notable locations in this zip code not listed on our city pages
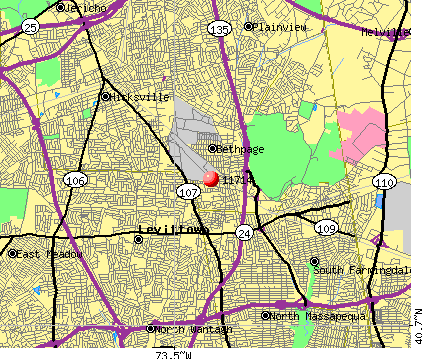
Notable locations in zip code 11714: Bethpage Station (A), Bethpage Public Library (B), Island Trees Public Library (C), Levittown Fire Department Station 3 (D), Bethpage Fire District (E). Display/hide their locations on the map
Churches in zip code 11714 include: Church of Christ (A), Saint Paul's Lutheran Church (B), Saint Martin of Tours Church (C), Bethpage United Methodist Church (D), Bethpage Assembly of God Church (E). Display/hide their locations on the map
3,648 married couples with children.
315 single-parent households (82 men, 233 women).
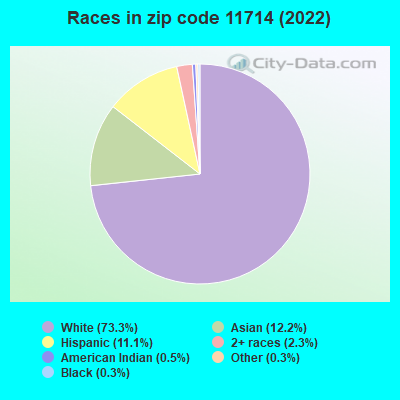
77.5% of residents of 11714 zip code speak English at home.
5.5% of residents speak Spanish at home (82% very well, 6% well, 6% not well, 6% not at all).
13.0% of residents speak other Indo-European language at home (78% very well, 15% well, 6% not well, 1% not at all).
2.8% of residents speak Asian or Pacific Island language at home (57% very well, 22% well, 14% not well, 6% not at all).
1.1% of residents speak other language at home (63% very well, 37% well).
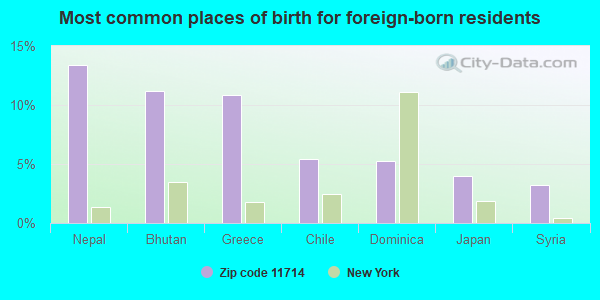
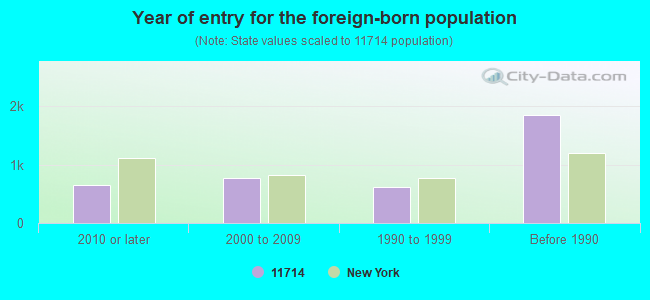
Foreign born population: 3,609 (16.3%) (78.2% of them are naturalized citizens)
Major facilities with environmental interests located in this zip code:
BETHPAGE BEST CLEANERS (360 BROADWAY in BETHPAGE, NY)
AIR MINOR (AIRS/AFS) STATE MASTER (New York facility tracking) - AIR PROGRAM Small Quantity Generators, between 100 kg and 1000 kg of hazardous waste/month (Resource Conservation and Recovery Act (tracking hazardous waste)) Business SIC classification: DRYCLEANING PLANTS, EXCEPT RUG CLEANING Business NAICS classification: DRYCLEANING AND LAUNDRY SERVICES (EXCEPT COIN-OPERATED).
BETHPAGE SHS ( in BETHPAGE, NY)
(National Center for Education Statistics) - STATE ID-280521030006 Organizations: BETHPAGE UFSD (SCHOOL DISTRICT)
GRECO BROS FUEL CORP (239 BROADWAY in BETHPAGE, NY)
(Integrated Compliance Information System) - ICIS-HQ-1999-0005, FORMAL ENFORCEMENT ACTION Business SIC classification: LOCAL TRUCKING WITHOUT STORAGE; TRUCKING, EXCEPT LOCAL
A & V MANSON SUPPLY INC (4108 HEMPSTEAD TNPK in BETHPAGE, NY)
AMERICAN LITHOTECH (631 HICKSVILLE RD in BETHPAGE, NY)
(Resource Conservation and Recovery Act (tracking hazardous waste))
GETTY SERVICE STATION 460 (295 CENTRAL AVE in BETHPAGE, NY)
Conditionally Exempt Small Quantity Generators, less than 100 kg/month of hazardous waste (Resource Conservation and Recovery Act (tracking hazardous waste)) - notification TRANSPORTER (Resource Conservation and Recovery Act (tracking hazardous waste)) - notification Organizations: GETTY PETROLEUM CORP (CONTACT/OWNER)
GRUMMAN AEROSPACE CORP (NEW SOUTH RD in BETHPAGE, NY)
(Resource Conservation and Recovery Act (tracking hazardous waste))
GRUMMAN AEROSPACE CORP-EAGLES NEST (500 CENTRAL AVENUE in BETHPAGE, NY)
(Resource Conservation and Recovery Act (tracking hazardous waste)) Alternative names: EAGEL NEST
HARDMANS AUTO ELECTRIC (250 BROADWAY in BETHPAGE, NY)
(Resource Conservation and Recovery Act (tracking hazardous waste))
ISLAND TREES AUTOMOTIVE LTD (4190 HEMPSTEAD TNPK in BETHPAGE, NY)
(Resource Conservation and Recovery Act (tracking hazardous waste))
Housing units lacking complete plumbing facilities: 0.4% Housing units lacking complete kitchen facilities: 0.3%
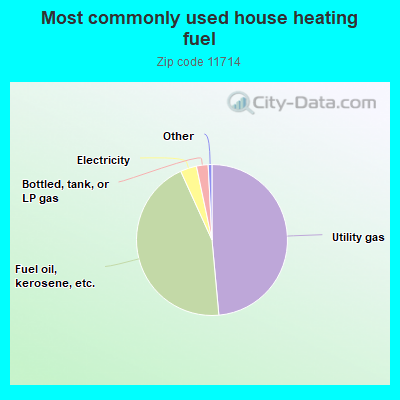
48.6%Utility gas
44.7%Fuel oil, kerosene, etc.
3.5%Electricity
2.5%Bottled, tank, or LP gas
Population in 1990: 21,957. Population change in the 1990s: +1,055 (+4.8%).
Place of birth for U.S.-born residents:
This state: 16,820
Northeast: 283
Midwest: 261
South: 524
West: 161
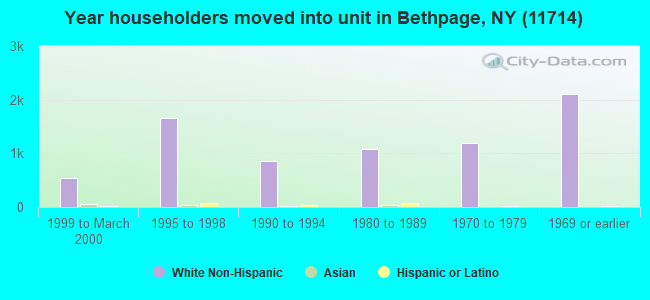
73% of the 11714 zip code residents lived in the same house 5 years ago. Out of people who lived in different houses, 62% lived in this county. Out of people who lived in different counties, 50% lived in New York.
94% of the 11714 zip code residents lived in the same house 1 year ago. Out of people who lived in different houses, 60% moved from this county. Out of people who lived in different houses, 30% moved from different county within same state. Out of people who lived in different houses, 3% moved from different state. Out of people who lived in different houses, 5% moved from abroad.
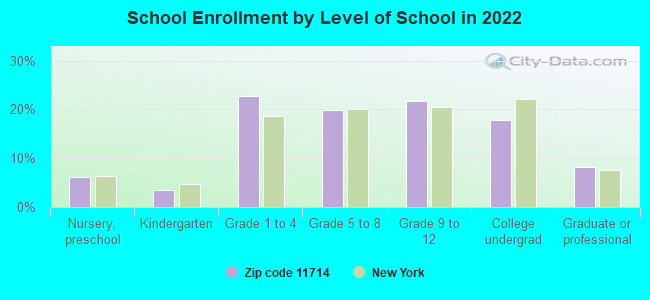
Private vs. public school enrollment:
Students in private schools in grades 1 to 8 (elementary and middle school): 173
Here:
8.3%
New York:
15.6%
Students in private schools in grades 9 to 12 (high school): 59
Here:
5.7%
New York:
15.0%
Students in private undergraduate colleges: 263
Here:
30.2%
New York:
39.2%
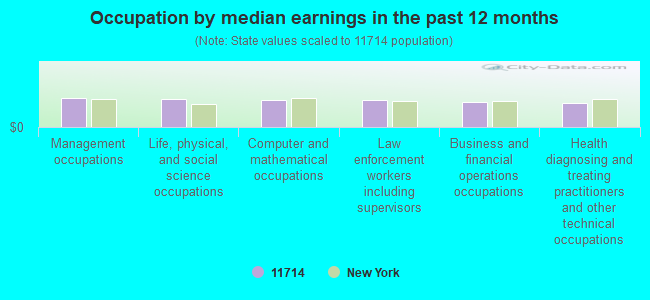
Occupation by median earnings in the past 12 months ($)
108,760Management occupations
105,445Life, physical, and social science occupations
103,468Computer and mathematical occupations
100,745Law enforcement workers including supervisors
95,944Business and financial operations occupations
91,225Health diagnosing and treating practitioners and other technical occupations
Companies with biggest federal contracts located in this zip code (BETHPAGE, NY):
NORTHROP GRUMMAN SYSTEMS CORPO (600 GRUMMAN ROAD WEST) : $2,375,455,346 in 1734 contractsfrom 1999 to 2006
Contracts for Defense Aircraft -- Operational Systems Development (R&D), Defense Aircraft -- Basic Research (R&D), Airframe Structural Components, Defense Aircraft -- Management and Support (R&D), and moreby Navy, Defense Advanced Research Projects Agency, Department of Defense, Air Force, and others Signed by year:2000: $115,968,443; 2001: $380,844,211; 2002: $360,527,346; 2003: $533,445,707; 2004: $700,337,911; 2005: $256,388,890; 2006: $16,395,307.
Biggest contracts:
$278,278,410 with Navy for Defense Aircraft -- Operational Systems Development (R&D). Signed on 2004-10-06. Completion date: 2012-12-31.
$192,998,815 with Navy for Defense Aircraft -- Basic Research (R&D). Taking place in FL. Signed on 2004-11-18. Completion date: 2005-11-18.
$182,989,151 with Navy for Airframe Structural Components. Signed on 2001-12-26. Completion date: 2004-12-31.
$160,000,000 with Navy for Defense Aircraft -- Operational Systems Development (R&D). Signed on 2003-12-23. Completion date: 2012-12-31.
NORTHROP GRUMMAN CORPORATION (S OYSTER BAY RD) : $649,971,762 in 90 contractsfrom 1999 to 2005
Contracts for Aircraft, Fixed Wing, Defense Aircraft -- Operational Systems Development (R&D), Logistics Support Services, Miscellaneous Aircraft Accessories and Components, and moreby Navy, NASA, Army Signed by year:2000: $362,218,637; 2001: $44,835,733; 2002: $9,362,131; 2003: $0; 2004: -$172,289; 2005: $4,221,292; 2006: $0.
Biggest contracts:
$227,418,065 with Navy for Aircraft, Fixed Wing. Signed on 2000-11-27. Completion date: 2006-02-28.
$104,600,000, same as above.Signed on 1999-12-21. Completion date: 1999-12-31.
$53,559,403 with Navy for Defense Aircraft -- Operational Systems Development (R&D). Signed on 1999-11-18. Completion date: 2000-09-30.
$49,018,069 with Navy for Aircraft, Fixed Wing. Signed on 1999-10-01. Completion date: 2006-02-28.
NORTHROP GRUMMAN CORPORATION (S OYSTER BAY RD) : $110,743,740 in 75 contractsfrom 1999 to 2004
Contracts for Radar Equipment, Airborne, Defense Electronics and Communication Equipment -- Operational Systems Development (R&D), Defense Electronics and Communication Equipment -- Engineering Development (R&D), Other Defense -- Applied Research and Exploratory Development (R&D), and moreby Navy, Air Force, NASA Signed by year:2000: $19,388,141; 2001: -$644,356; 2002: $56,500; 2003: $0; 2004: $978,854; 2005: $0; 2006: $0.
Biggest contracts:
$69,000,000 with Navy for Radar Equipment, Airborne. Signed on 1999-11-10. Completion date: 2004-10-31.
$7,076,413 with Air Force for Defense Electronics and Communication Equipment -- Operational Systems Development (R&D). Taking place in FL. Signed on 1999-11-04. Completion date: 1999-10-30.
$6,093,316 with Air Force for Defense Electronics and Communication Equipment -- Engineering Development (R&D). Taking place in FL. Signed on 2000-01-11. Completion date: 2002-07-31.
$5,525,862 with Air Force for Defense Electronics and Communication Equipment -- Operational Systems Development (R&D). Taking place in FL. Signed on 1999-11-02. Completion date: 2002-07-31.
FIELD GRUMMAN SUPPORT SERVICES (S OYSTER BAY RD) : $18,358,808 in 77 contractsfrom 1999 to 2005
Contracts for Installation of Equipment -- Aircraft Components and Accessories, Maintenance, Repair and Rebuilding of Equipment -- Aircraft and Airframe Structural Components, Aircraft Hydraulic, Vacuum, and De-icing System Components, Valves, Nonpowered, and moreby Navy, Defense Logistics Agency, Air Force, Department of State, and others Signed by year:2000: $1,505,772; 2001: $2,113,866; 2002: $390,558; 2003: $3,393,000; 2004: $4,191,310; 2005: $5,470; 2006: $0.
Biggest contracts:
$3,800,000 with Navy for Installation of Equipment -- Aircraft Components and Accessories. Taking place in CA. Signed on 1999-12-22. Completion date: 2000-12-31.
$2,667,395 with Navy for Maintenance, Repair and Rebuilding of Equipment -- Aircraft and Airframe Structural Components. Taking place in GA. Signed on 1999-10-01. Completion date: 2000-09-30.
$1,656,515 with Defense Logistics Agency for Aircraft Hydraulic, Vacuum, and De-icing System Components. Signed on 2003-10-31. Completion date: 2005-07-31.
$1,642,417 with Navy for Installation of Equipment -- Aircraft Components and Accessories. Taking place in CA. Signed on 2000-02-03. Completion date: 2000-07-31.
HOWE MACHINE & TOOL CORP (236 PARK AVE; small business) : $12,774,155 in 740 contractsfrom 2000 to 2006
Contracts for Valves, Nonpowered, Converters, Electrical, Nonrotating, Shipboard Alarm and Signal Systems, Vehicular Cab, Body, and Frame Structural Components, and moreby Navy, Defense Logistics Agency, U.S. Coast Guard Signed by year:2000: $63,344; 2001: $497,665; 2002: $237,219; 2003: $216,846; 2004: $2,806,465; 2005: $6,400,233; 2006: $2,552,383.
Biggest contracts:
$132,080 with Navy for Valves, Nonpowered. Taking place in CA. Signed on 2005-08-16. Completion date: 2006-03-15.
$130,490 with Navy for Converters, Electrical, Nonrotating. Taking place in CA. Signed on 2005-08-16. Completion date: 2006-01-30.
$100,674 with Defense Logistics Agency for Shipboard Alarm and Signal Systems. Signed on 2001-02-16. Completion date: 2001-06-16.
$100,000 with Defense Logistics Agency for Vehicular Cab, Body, and Frame Structural Components. Signed on 2005-10-13. Completion date: 2006-05-01.
NORTHROP GRUMMAN CORPORATION (1111 STEWART AVE) : $7,150,614 in 30 contractsfrom 1999 to 2006
Contracts for Engineering and Technical Services by Navy Signed by year:2000: $2,999,436; 2001: $0; 2002: $0; 2003: $0; 2004: $670,139; 2005: $476,089; 2006: -$28,588.
Biggest contracts:
$1,000,000 with Navy for Engineering and Technical Services. Taking place in CA. Signed on 2000-09-28. Completion date: 2001-09-30.
$946,936, same as above.Signed on 2000-09-28. Completion date: 2001-09-30.
$728,835, same as above.Signed on 1999-11-01. Completion date: 2000-08-31.
$700,000, same as above.Signed on 1999-11-15. Completion date: 2000-08-31.
PEERLESS ELECTRONICS INC (700 HICKSVILLE RD; small business) : $4,080,130 in 392 contractsfrom 2001 to 2006
Contracts for Relays and Solenoids, Circuit Breakers, Switches, Miscellaneous Items, and moreby Defense Logistics Agency, Navy, Air Force, Department of Defense, and others Signed by year:2000: $0; 2001: $0; 2002: $0; 2003: $318,749; 2004: $1,101,478; 2005: $1,479,456; 2006: $1,180,447.
Biggest contracts:
$97,086 with Defense Logistics Agency for Relays and Solenoids. Signed on 2004-12-02. Completion date: 2005-03-02.
$93,944 with Defense Logistics Agency for Circuit Breakers. Signed on 2004-01-26. Completion date: 2004-07-13.
$73,104 with Defense Logistics Agency for Relays and Solenoids. Signed on 2004-03-05. Completion date: 2004-09-18.
$70,509, same as above.Signed on 2006-01-11. Completion date: 2006-11-07.
GRUMMAN AEROSPACE CORPORATION (S OYSTER BAY RD) : $3,409,896 in 24 contractsfrom 2004 to 2006
Contracts for Miscellaneous Aircraft Accessories and Components, Airframe Structural Components, Miscellaneous Communication Equipment, Automatic Pilot Mechanisms and Airborne Gyro Components, and moreby Navy Signed by year:2000: $0; 2001: $0; 2002: $0; 2003: $0; 2004: $674,738; 2005: $2,431,709; 2006: $303,449.
Biggest contracts:
$1,482,700 with Navy for Miscellaneous Aircraft Accessories and Components. Signed on 2005-09-28. Completion date: 2006-09-28.
$477,738 with Navy for Airframe Structural Components. Taking place in FL. Signed on 2004-06-22. Completion date: 2005-02-28.
$99,000 with Navy for Miscellaneous Communication Equipment. Signed on 2004-12-06. Completion date: 2005-02-04.
$98,000 with Navy for Automatic Pilot Mechanisms and Airborne Gyro Components. Signed on 2005-04-04. Completion date: 2006-04-04.
DEBRUIN, A JAMES & SONS LLP (11 UNION AVE; small business) : $831,000 in 19 contractsfrom 2004 to 2006
Contracts for Architect - Engineer Services (including landscaping, interior layout, and designing) by U.S. Army Corps of Engineers - civil program financing only, Army Signed by year:2000: $0; 2001: $0; 2002: $0; 2003: $0; 2004: $70,000; 2005: $624,000; 2006: $137,000.
Biggest contracts:
$75,000 with U.S. Army Corps of Engineers - civil program financing only for Architect - Engineer Services (including landscaping, interior layout, and designing). Taking place in NJ. Signed on 2005-04-25. Completion date: 2005-07-25.
$75,000 with Army for Architect - Engineer Services (including landscaping, interior layout, and designing). Taking place in NJ. Signed on 2005-04-25. Completion date: 2005-07-25.
$70,000, same as above.Signed on 2005-08-25. Completion date: 2005-11-25.
$70,000 with U.S. Army Corps of Engineers - civil program financing only for Architect - Engineer Services (including landscaping, interior layout, and designing). Taking place in NJ. Signed on 2005-08-25. Completion date: 2005-11-25.
NORTHROP GRUMMAN CORPORATION (609 S OYSTER BAY RD) : $271,889 in 4 contractsfrom 1999 to 2000
$99,695 with Navy for Other Administrative Support Services. Signed on 1999-10-01. Completion date: 1999-06-11.
$81,570 with Navy for Connectors, Electrical. Taking place in VA. Signed on 2000-02-08. Completion date: 2000-10-16.
$63,186 with Navy for Electrical and Electronic assemblies, Boards, Cards, and Associated Hardware. Signed on 2000-04-26. Completion date: 2000-08-29.
$27,438 with Navy for Electrical and Electronic assemblies, Boards, Cards, and Associated Hardware. Taking place in VA. Signed on 2000-02-08. Completion date: 2000-06-23.
Top industries in this zip code by the number of employees in 2005:
2002 - 2018 National Fire Incident Reporting System (NFIRS) incidents
According to the data from the years 2002 - 2018 the average number of fire incidents per year is 15. The highest number of reported fire incidents - 60 took place in 2005, and the least - 1 in 2014. The data has a declining trend.
When looking into fire subcategories, the most reports belonged to: Structure Fires (47.8%), and Outside Fires (31.8%).
Fire incident types reported to NFIRS in Zip Code 11714


 Nearest zip codes: 11804, 11756, 11803, 11801, 11735, 11783.
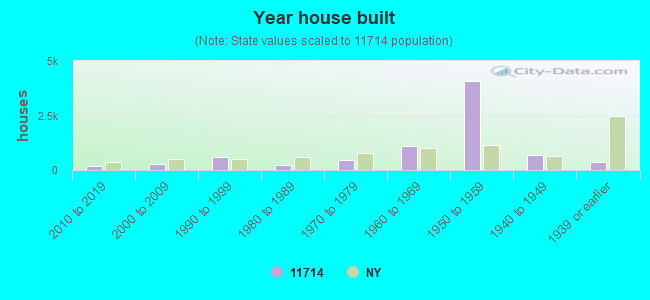


 According to the data from the years 2002 - 2018 the average number of fire incidents per year is 15. The highest number of reported fire incidents - 60 took place in 2005, and the least - 1 in 2014. The data has a declining trend.
 When looking into fire subcategories, the most reports belonged to: Structure Fires (47.8%), and Outside Fires (31.8%).