Estimated zip code population in 2022: 41,785 Zip code population in 2010: 42,791 Zip code population in 2000: 43,952
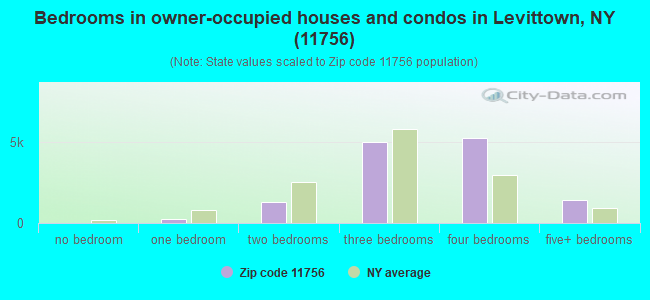
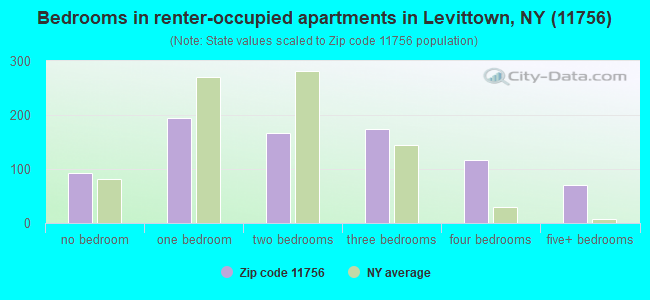
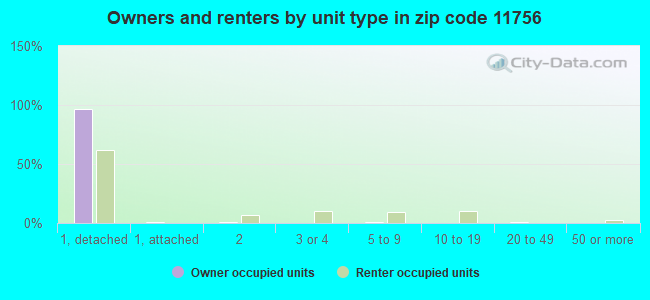
Houses and condos: 14,318 Renter-occupied apartments: 822
% of renters here:
6%
State:
46%
March 2022 cost of living index in zip code 11756: 149.1 (very high, U.S. average is 100)
Land area: 5.5 sq. mi. Water area: 0.0 sq. mi.
Population density: 7,567 people per square mile
(high).
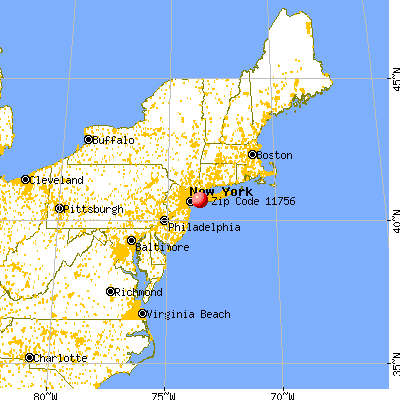
OSM Map
General Map
Google Map
MSN Map
OSM Map
General Map
Google Map
MSN Map
OSM Map
General Map
Google Map
MSN Map
OSM Map
General Map
Google Map
MSN Map
Please wait while loading the map...
Real estate property taxes paid for housing units in 2022:
This zip code:
1.9% ($9,805)
New York:
1.5% ($6,180)
Median real estate property taxes paid for housing units with mortgages in 2022: $9,858 (1.8%) Median real estate property taxes paid for housing units with no mortgage in 2022: $9,755 (2.0%)
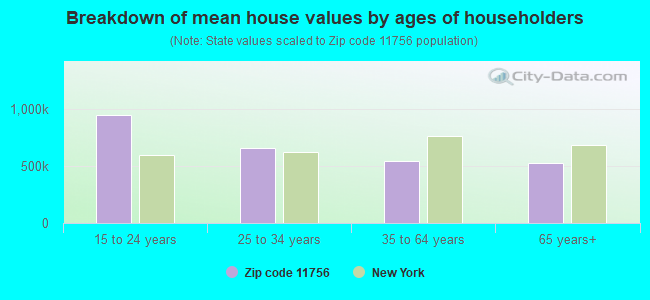
Estimated median house/condo value in 2022: $527,369
11756:
$527,369
New York:
$400,400
According to our research of New York and other state lists, there were 10 registered sex offenders living in 11756 zip code as of April 27, 2024. The ratio of all residents to sex offenders in zip code 11756 is 4,327 to 1. The ratio of registered sex offenders to all residents in this zip code is much lower than the state average.
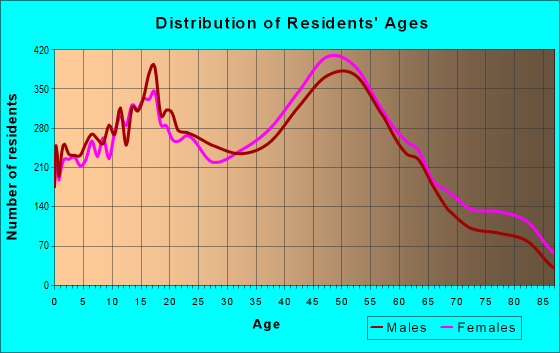
Median resident age:
This zip code:
43.0 years
New York median age:
40.0 years
Average household size:
This zip code:
2.9 people
New York:
2.5 people
Averages for the 2020 tax year for zip code 11756, filed in 2021:
Average Adjusted Gross Income (AGI) in 2020: $79,066 (Individual Income Tax Returns)
Here:
$79,066
State:
$90,930
Salary/wage: $71,918 (reported on 83.0% of returns)
Here:
$71,918
State:
$72,104
(% of AGI for various income ranges: 1088.2% for AGIs below $25k, 3486.9% for AGIs $25k-50k, 6485.2% for AGIs $50k-75k, 9286.9% for AGIs $75k-100k, 18161.1% for AGIs $100k-200k, 56876.2% for AGIs over 200k)
Taxable interest for individuals: $795 (reported on 48.5% of returns)
This zip code:
$795
New York:
$3,075
(% of AGI for various income ranges: 22.7% for AGIs below $25k, 24.9% for AGIs $25k-50k, 46.8% for AGIs $50k-75k, 66.7% for AGIs $75k-100k, 100.1% for AGIs $100k-200k, 308.7% for AGIs over 200k)
Ordinary dividends: $2,678 (reported on 22.4% of returns)
Here:
$2,678
State:
$11,095
(% of AGI for various income ranges: 29.1% for AGIs below $25k, 32.9% for AGIs $25k-50k, 65.2% for AGIs $50k-75k, 99.9% for AGIs $75k-100k, 166.3% for AGIs $100k-200k, 535.8% for AGIs over 200k)
Net capital gain/loss in AGI: +$6,686 (reported on 19.9% of returns)
Here:
+$6,686
State:
+$44,925
(% of AGI for various income ranges: 8.7% for AGIs below $25k, 26.2% for AGIs $25k-50k, 69.8% for AGIs $50k-75k, 101.3% for AGIs $75k-100k, 249.3% for AGIs $100k-200k, 3395.8% for AGIs over 200k)
Profit/loss from business: +$8,859 (reported on 13.3% of returns)
Here:
+$8,859
State:
+$14,940
(% of AGI for various income ranges: 137.5% for AGIs below $25k, 147.6% for AGIs $25k-50k, 148.0% for AGIs $50k-75k, 172.9% for AGIs $75k-100k, 191.0% for AGIs $100k-200k, 827.9% for AGIs over 200k)
Taxable individual retirement arrangement distribution: $15,920 (reported on 8.5% of returns)
11756:
$15,920
New York:
$19,609
(% of AGI for various income ranges: 53.0% for AGIs below $25k, 82.0% for AGIs $25k-50k, 173.0% for AGIs $50k-75k, 274.3% for AGIs $75k-100k, 381.9% for AGIs $100k-200k, 929.2% for AGIs over 200k)
Self-employed (Keogh) retirement plans: $13,867 (reported on 0.3% of returns)
11756:
$13,867
New York:
$32,497
(% of AGI for various income ranges: 12.5% for AGIs $100k-200k, 76.8% for AGIs over 200k)
Total itemized deductions: $26,555 (reported on 17.0% of returns)
Here:
$26,555
State:
$39,326
(% of AGI for various income ranges: 127.2% for AGIs below $25k, 250.0% for AGIs $25k-50k, 582.0% for AGIs $50k-75k, 862.6% for AGIs $75k-100k, 1301.1% for AGIs $100k-200k, 3530.4% for AGIs over 200k)
Charity contributions: $3,626 (reported on 14.3% of returns)
Here:
$3,626
State:
$15,420
(% of AGI for various income ranges: 6.6% for AGIs below $25k, 17.1% for AGIs $25k-50k, 52.3% for AGIs $50k-75k, 80.8% for AGIs $75k-100k, 168.5% for AGIs $100k-200k, 545.7% for AGIs over 200k)
Taxes paid: $9,513 (reported on 16.9% of returns)
11756:
$9,513
State:
$9,183
(% of AGI for various income ranges: 49.1% for AGIs below $25k, 98.1% for AGIs $25k-50k, 226.6% for AGIs $50k-75k, 327.6% for AGIs $75k-100k, 471.1% for AGIs $100k-200k, 988.9% for AGIs over 200k)
Earned income credit: $1,758 (reported on 7.9% of returns)
Here:
$1,758
State:
$2,138
(% of AGI for various income ranges: 47.8% for AGIs below $25k, 43.6% for AGIs $25k-50k, 0.7% for AGIs $50k-75k)
Percentage of individuals using paid preparers for their 2020 taxes: 95.5%
Here:
95%
State:
95%
(% for various income ranges: 93.3% for AGIs below $25k, 96.0% for AGIs $25k-50k, 96.2% for AGIs $50k-75k, 96.2% for AGIs $75k-100k, 96.3% for AGIs $100k-200k, 96.4% for AGIs over 200k)
Averages for the 2012 tax year for zip code 11756, filed in 2013:
Average Adjusted Gross Income (AGI) in 2012: $68,600 (Individual Income Tax Returns)
Here:
$68,600
State:
$77,088
Salary/wage: $61,057 (reported on 85.9% of returns)
Here:
$61,057
State:
$60,593
(% of AGI for various income ranges: 70.5% for AGIs below $25k, 78.3% for AGIs $25k-50k, 77.3% for AGIs $50k-75k, 77.0% for AGIs $75k-100k, 84.9% for AGIs $100k-200k, 54.2% for AGIs over 200k)
Taxable interest for individuals: $718 (reported on 50.8% of returns)
This zip code:
$718
New York:
$3,125
(% of AGI for various income ranges: 1.4% for AGIs below $25k, 0.7% for AGIs $25k-50k, 0.7% for AGIs $50k-75k, 0.5% for AGIs $75k-100k, 0.4% for AGIs $100k-200k, 0.4% for AGIs over 200k)
Ordinary dividends: $2,000 (reported on 22.7% of returns)
Here:
$2,000
State:
$10,299
(% of AGI for various income ranges: 1.7% for AGIs below $25k, 0.8% for AGIs $25k-50k, 0.9% for AGIs $50k-75k, 0.7% for AGIs $75k-100k, 0.5% for AGIs $100k-200k, 0.5% for AGIs over 200k)
Net capital gain/loss in AGI: +$1,250 (reported on 15.8% of returns)
Here:
+$1,250
State:
+$42,474
(% of AGI for various income ranges: 0.2% for AGIs $100k-200k, 1.4% for AGIs over 200k)
Profit/loss from business: +$9,749 (reported on 10.7% of returns)
Here:
+$9,749
State:
+$16,168
(% of AGI for various income ranges: 7.0% for AGIs below $25k, 2.7% for AGIs $25k-50k, 1.5% for AGIs $50k-75k, 1.2% for AGIs $75k-100k, 0.9% for AGIs $100k-200k, 0.8% for AGIs over 200k)
Taxable individual retirement arrangement distribution: $12,770 (reported on 10.0% of returns)
11756:
$12,770
New York:
$17,621
(% of AGI for various income ranges: 3.3% for AGIs below $25k, 2.4% for AGIs $25k-50k, 2.0% for AGIs $50k-75k, 2.3% for AGIs $75k-100k, 1.6% for AGIs $100k-200k, 1.1% for AGIs over 200k)
Self-employment retirement plans: $8,933 (reported on 0.3% of returns)
11756:
$8,933
New York:
$27,330
Total itemized deductions: $26,108 (25% of AGI, reported on 52.1% of returns)
Here:
$26,108
State:
$34,985
Here:
24.8% of AGI
State:
21.3% of AGI
(% of AGI for various income ranges: 16.5% for AGIs below $25k, 17.9% for AGIs $25k-50k, 21.4% for AGIs $50k-75k, 23.0% for AGIs $75k-100k, 22.0% for AGIs $100k-200k, 12.3% for AGIs over 200k)
Charity contributions: $2,250 (reported on 47.2% of returns)
Here:
$2,250
State:
$5,572
(% of AGI for various income ranges: 0.8% for AGIs below $25k, 1.3% for AGIs $25k-50k, 1.7% for AGIs $50k-75k, 1.8% for AGIs $75k-100k, 1.7% for AGIs $100k-200k, 1.4% for AGIs over 200k)
Taxes paid: $12,913 (reported on 52.0% of returns)
11756:
$12,913
State:
$18,656
(% of AGI for various income ranges: 7.1% for AGIs below $25k, 7.8% for AGIs $25k-50k, 9.8% for AGIs $50k-75k, 11.0% for AGIs $75k-100k, 11.1% for AGIs $100k-200k, 7.4% for AGIs over 200k)
Earned income credit: $1,867 (reported on 8.4% of returns)
Here:
$1,867
State:
$2,230
(% of AGI for various income ranges: 3.1% for AGIs below $25k, 0.6% for AGIs $25k-50k)
Percentage of individuals using paid preparers for their 2012 taxes: 70.0%
Here:
70%
State:
66%
(% for various income ranges: 62.9% for AGIs below $25k, 66.8% for AGIs $25k-50k, 71.6% for AGIs $50k-75k, 76.1% for AGIs $75k-100k, 77.6% for AGIs $100k-200k, 79.3% for AGIs over 200k)
Averages for the 2004 tax year for zip code 11756, filed in 2005:
Average Adjusted Gross Income (AGI) in 2004: $55,700 (Individual Income Tax Returns)
Here:
$55,700
State:
$59,519
Salary/wage: $51,899 (reported on 86.1% of returns)
Here:
$51,899
State:
$50,673
(% of AGI for various income ranges: 95.6% for AGIs below $10k, 68.2% for AGIs $10k-25k, 81.1% for AGIs $25k-50k, 81.9% for AGIs $50k-75k, 85.9% for AGIs $75k-100k, 77.3% for AGIs over 100k)
Taxable interest for individuals: $830 (reported on 65.8% of returns)
This zip code:
$830
New York:
$2,377
(% of AGI for various income ranges: 5.6% for AGIs below $10k, 2.6% for AGIs $10k-25k, 1.2% for AGIs $25k-50k, 1.0% for AGIs $50k-75k, 0.8% for AGIs $75k-100k, 0.7% for AGIs over 100k)
Taxable dividends: $1,526 (reported on 28.7% of returns)
Here:
$1,526
State:
$5,394
(% of AGI for various income ranges: 3.3% for AGIs below $10k, 1.7% for AGIs $10k-25k, 0.8% for AGIs $25k-50k, 0.7% for AGIs $50k-75k, 0.5% for AGIs $75k-100k, 0.8% for AGIs over 100k)
Net capital gain/loss: +$1,754 (reported on 21.0% of returns)
Here:
+$1,754
State:
+$23,581
(% of AGI for various income ranges: -3.2% for AGIs below $10k, -0.1% for AGIs $10k-25k, -0.1% for AGIs $25k-50k, -0.2% for AGIs $50k-75k, 0.3% for AGIs $75k-100k, 1.8% for AGIs over 100k)
Profit/loss from business: +$10,066 (reported on 11.0% of returns)
Here:
+$10,066
State:
+$13,809
(% of AGI for various income ranges: 8.3% for AGIs below $10k, 6.5% for AGIs $10k-25k, 2.6% for AGIs $25k-50k, 1.7% for AGIs $50k-75k, 0.9% for AGIs $75k-100k, 1.7% for AGIs over 100k)
IRA payment deduction: $3,173 (reported on 3.3% of returns)
11756:
$3,173
New York:
$3,115
(% of AGI for various income ranges: 0.3% for AGIs below $10k, 0.3% for AGIs $10k-25k, 0.3% for AGIs $25k-50k, 0.2% for AGIs $50k-75k, 0.2% for AGIs $75k-100k, 0.1% for AGIs over 100k)
Self-employed pension: $10,270 (reported on 0.4% of returns)
Here:
$10,270
New York:
$19,016
(% of AGI for various income ranges: 0.1% for AGIs $25k-50k, 0.1% for AGIs $50k-75k, 0.0% for AGIs $75k-100k, 0.1% for AGIs over 100k)
Total itemized deductions: $21,892 (27% of AGI, reported on 55.4% of returns)
Here:
$21,892
State:
$25,864
Here:
26.9% of AGI
State:
21.9% of AGI
(% of AGI for various income ranges: 16.7% for AGIs below $10k, 19.4% for AGIs $10k-25k, 21.2% for AGIs $25k-50k, 25.1% for AGIs $50k-75k, 25.1% for AGIs $75k-100k, 19.1% for AGIs over 100k)
Charity contributions deductions: $2,478 (3% of AGI, reported on 52.7% of returns)
Here:
$2,478
State:
$4,439
Here:
3.0% of AGI
State:
3.6% of AGI
(% of AGI for various income ranges: 0.8% for AGIs below $10k, 1.6% for AGIs $10k-25k, 2.1% for AGIs $25k-50k, 2.6% for AGIs $50k-75k, 2.6% for AGIs $75k-100k, 2.3% for AGIs over 100k)
Total tax: $7,097 (reported on 81.7% of returns)
11756:
$7,097
State:
$11,730
(% of AGI for various income ranges: 3.0% for AGIs below $10k, 4.3% for AGIs $10k-25k, 7.2% for AGIs $25k-50k, 8.3% for AGIs $50k-75k, 8.7% for AGIs $75k-100k, 14.6% for AGIs over 100k)
Earned income credit: $1,435 (reported on 6.8% of returns)
Here:
$1,435
State:
$1,757
Percentage of individuals using paid preparers for their 2004 taxes: 70.7%
Here:
71%
State:
67%
(% for various income ranges: 58.4% for AGIs below $10k, 67.3% for AGIs $10k-25k, 69.8% for AGIs $25k-50k, 75.9% for AGIs $50k-75k, 77.2% for AGIs $75k-100k, 77.8% for AGIs over 100k)
Likely homosexual households (counted as self-reported same-sex unmarried-partner households)
Lesbian couples: 0.2% of all households
Gay men: 0.0% of all households
Household received Food Stamps/SNAP in the past 12 months: 371 Household did not receive Food Stamps/SNAP in the past 12 months: 13,597
Women who had a birth in the past 12 months: 540 (505 now married, 28 unmarried) Women who did not have a birth in the past 12 months: 8,747 (3,622 now married, 5,103 unmarried)
Housing units in zip code 11756 with a mortgage: 8,824 (1,182 second mortgage, 35 home equity loan, 1,020 both second mortgage and home equity loan) Houses without a mortgage: 459
Median monthly owner costs for units with a mortgage: $3,142 Median monthly owner costs for units without a mortgage: $1,329
Residents with income below the poverty level in 2022:
This zip code:
3.3%
Whole state:
14.3%
Residents with income below 50% of the poverty level in 2022:
This zip code:
1.4%
Whole state:
6.8%
Median number of rooms in houses and condos:
Here:
6.7
State:
6.3
Median number of rooms in apartments:
Here:
5.6
State:
3.8
Notable locations in this zip code not listed on our city pages
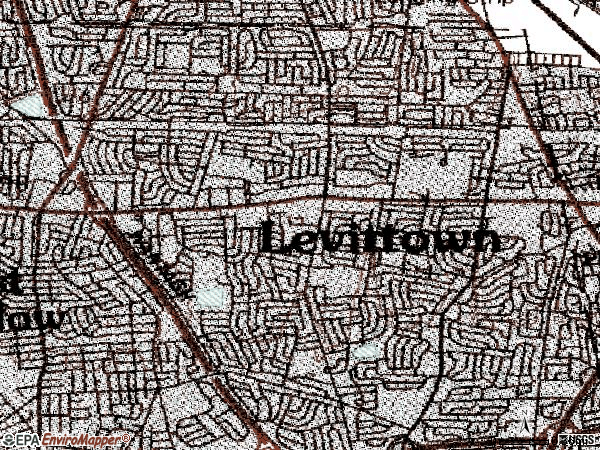
Notable locations in zip code 11756: East Meadow Fire Department Station 3 (A), Levittown Fire Department (B), Levittown Fire Department Station 2 (C), Levittown Public Library (D). Display/hide their locations on the map
Churches in zip code 11756 include: First Church of Christ Scientist (A), Saint John Orthodox Church (B), Good Shepherd Lutheran Church (C), Levittown Baptist Church (D), Levittown Presbyterian Church (E), No Greater Love Fellowship Church (F), Saint Bernard's Roman Catholic Church (G), Saint Francis Episcopal Church (H), Segunda Iglesia Pentecostal (I). Display/hide their locations on the map
Parks in zip code 11756 include: South Village Green (1), Jersalem Avenue Field (2), Polaris Field (3), North Village Green (4), East Village Green (5). Display/hide their locations on the map
5,836 married couples with children.
788 single-parent households (251 men, 537 women).
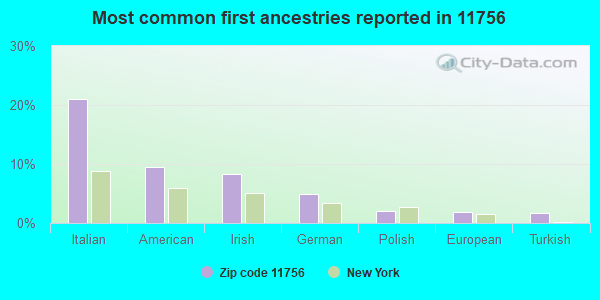
75.6% of residents of 11756 zip code speak English at home.
11.1% of residents speak Spanish at home (76% very well, 16% well, 6% not well, 1% not at all).
6.7% of residents speak other Indo-European language at home (80% very well, 14% well, 6% not well, 1% not at all).
5.6% of residents speak Asian or Pacific Island language at home (58% very well, 23% well, 15% not well, 4% not at all).
0.6% of residents speak other language at home (76% very well, 5% well, 18% not well).
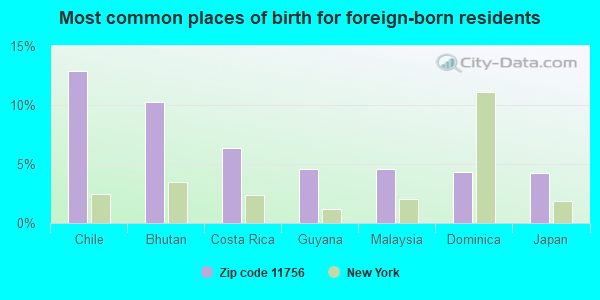
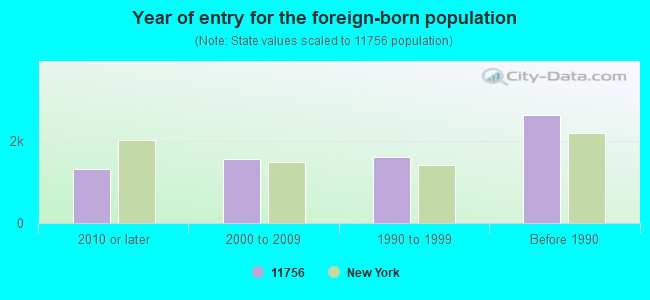
Foreign born population: 6,504 (15.6%) (78.1% of them are naturalized citizens)
Major facilities with environmental interests located in this zip code:
AMERICAN DRIVE IN CLEANERS (3801 HEMPSTEAD TURNPIKE in LEVITTOWN, NY)
SUPERFUND (Superfund database) (Integrated Compliance Information System) - ICIS-02-2002-2007, FORMAL ENFORCEMENT ACTION, Small Quantity Generators, between 100 kg and 1000 kg of hazardous waste/month (Resource Conservation and Recovery Act (tracking hazardous waste)) - notification HAZARDOUS WASTE BIENNIAL REPORTER (Resource Conservation and Recovery Act (tracking hazardous waste)) Large Quantity Generators, more that 1000 kg of hazardous waste/month (Resource Conservation and Recovery Act (tracking hazardous waste)) Alternative names: AMERICAN CLEANERS, AMERICAN DRIVEIN CLEANERS - YARD
ANN S DRY CLEANERS (3101 NORTH JERUSALEM RD in LEVITTOWN, NY)
AIR MINOR (AIRS/AFS) STATE MASTER (New York facility tracking) - AIR PROGRAM Business SIC classification: DRYCLEANING PLANTS, EXCEPT RUG CLEANING Alternative names: ANN'S DRY CLEANERS
ABBEY LANE SCHOOL ( in LEVITTOWN, NY)
(Geographic Names Information System) (National Center for Education Statistics) - STATE ID-280205030002 Organizations: LEVITTOWN UFSD (SCHOOL DISTRICT)
ISLAND TREES HS ( in LEVITTOWN, NY)
(National Center for Education Statistics) - STATE ID-280226030006 Organizations: ISLAND TREES UFSD (SCHOOL DISTRICT)
ISLAND TREES MS ( in LEVITTOWN, NY)
(National Center for Education Statistics) - STATE ID-280226030002 Organizations: ISLAND TREES UFSD (SCHOOL DISTRICT)
HEMPSTEAD TOWN OF AZALEA TANK (COR OF AZALEA & HILLTOP RD in LEVITTOWN, NY)
Large Quantity Generators, more that 1000 kg of hazardous waste/month (Resource Conservation and Recovery Act (tracking hazardous waste)) - notification TRANSPORTER (Resource Conservation and Recovery Act (tracking hazardous waste)) - notification Organizations: TOWN OF HEMPSTEAD (CONTACT/OWNER)
AMOCO (2665 HEMPSTEAD TNPK in LEVITTOWN, NY)
(Resource Conservation and Recovery Act (tracking hazardous waste))
COUNTRY FORD (210 GARDINERS AVE in LEVITTOWN, NY)
Small Quantity Generators, between 100 kg and 1000 kg of hazardous waste/month (Resource Conservation and Recovery Act (tracking hazardous waste)) (Resource Conservation and Recovery Act (tracking hazardous waste)) Alternative names: A-1 JRC COLLISION INC
GETTY SERVICE STATION (3730 HEMPSTEAD TNPK in LEVITTOWN, NY)
(Resource Conservation and Recovery Act (tracking hazardous waste))
GOLDBERG STEVEN DDS (3601 HEMPSTEAD TNPK in LEVITTOWN, NY)
(Resource Conservation and Recovery Act (tracking hazardous waste))
GOODYEAR TIRE & RUBBER CO (3181 HEMPSTEAD TNPK in LEVITTOWN, NY)
(Resource Conservation and Recovery Act (tracking hazardous waste))
CORVETTES UNLIMITED (3718 HEMPSTEAD TNPK in LEVITTOWN, NY)
(Resource Conservation and Recovery Act (tracking hazardous waste))
Housing units lacking complete plumbing facilities: 0.1% Housing units lacking complete kitchen facilities: 0.7%
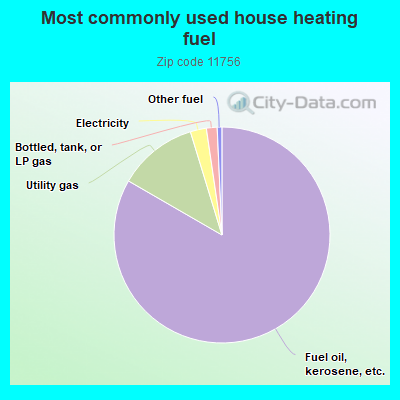
83.1%Fuel oil, kerosene, etc.
11.9%Utility gas
2.4%Electricity
1.6%Bottled, tank, or LP gas
0.7%Other fuel
Population in 1990: 44,967.
Place of birth for U.S.-born residents:
This state: 32,428
Northeast: 898
Midwest: 143
South: 512
West: 492
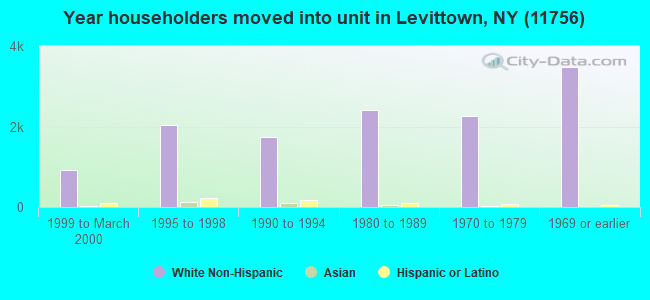
76% of the 11756 zip code residents lived in the same house 5 years ago. Out of people who lived in different houses, 62% lived in this county. Out of people who lived in different counties, 50% lived in New York.
95% of the 11756 zip code residents lived in the same house 1 year ago. Out of people who lived in different houses, 29% moved from this county. Out of people who lived in different houses, 59% moved from different county within same state. Out of people who lived in different houses, 4% moved from different state. Out of people who lived in different houses, 8% moved from abroad.
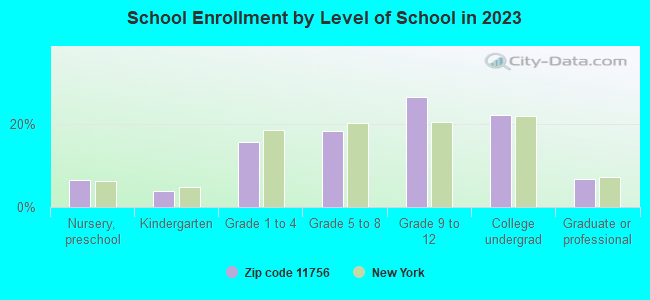
Private vs. public school enrollment:
Students in private schools in grades 1 to 8 (elementary and middle school): 231
Here:
7.7%
New York:
15.6%
Students in private schools in grades 9 to 12 (high school): 49
Here:
2.5%
New York:
15.0%
Students in private undergraduate colleges: 693
Here:
33.3%
New York:
39.2%
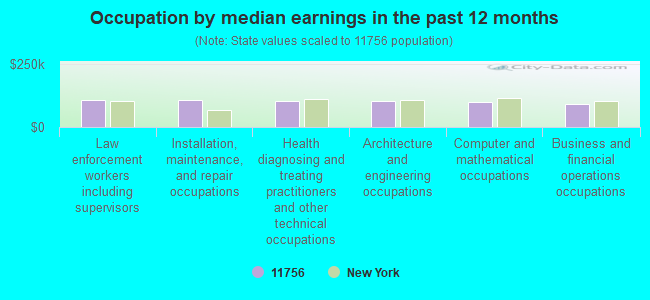
Occupation by median earnings in the past 12 months ($)
107,416Law enforcement workers including supervisors
106,599Installation, maintenance, and repair occupations
102,775Health diagnosing and treating practitioners and other technical occupations
101,449Architecture and engineering occupations
98,482Computer and mathematical occupations
92,395Business and financial operations occupations
Companies with federal contracts located in this zip code:
MARTIN MILITARY INC (3684 MARTIN ST in LEVITTOWN, NY; small business) : $15,250,902 in 1423 contractsfrom 2002 to 2006
Contracts for Miscellaneous Items, Miscellaneous Communication Equipment, Resistors, Capacitors, and moreby Defense Logistics Agency, Navy Signed by year:2000: $0; 2001: $0; 2002: $26,400; 2003: $70,516; 2004: $3,704,667; 2005: $6,998,315; 2006: $4,451,004.
Biggest contracts:
$99,754 with Defense Logistics Agency for Miscellaneous Items. Signed on 2005-05-10. Completion date: 2006-01-05.
$99,492 with Defense Logistics Agency for Miscellaneous Communication Equipment. Signed on 2005-01-20. Completion date: 2005-11-26.
$88,075 with Defense Logistics Agency for Resistors. Signed on 2006-03-16. Completion date: 2007-03-06.
$86,500 with Defense Logistics Agency for Capacitors. Signed on 2004-07-30. Completion date: 2004-11-27.
STANDARD CONNECTION (3684 MARTIN ST in LEVITTOWN, NY; small business) : $5,510 in 2 contractsin 2004
$2,755 with Defense Logistics Agency for Antennas, Waveguides, and Related Equipment. Signed on 2004-11-03. Completion date: 2005-02-02.
$2,755, same as above.Signed on 2004-11-03. Completion date: 2005-02-02.
Top industries in this zip code by the number of employees in 2005:
2002 - 2018 National Fire Incident Reporting System (NFIRS) incidents
Based on the data from the years 2002 - 2018 the average number of fire incidents per year is 63. The highest number of reported fire incidents - 134 took place in 2005, and the least - 0 in 2004. The data has a decreasing trend.
When looking into fire subcategories, the most reports belonged to: Outside Fires (44.2%), and Structure Fires (35.7%).
Fire incident types reported to NFIRS in Zip Code 11756


 Nearest zip codes: 11714, 11801, 11554, 11783, 11710, 11590.
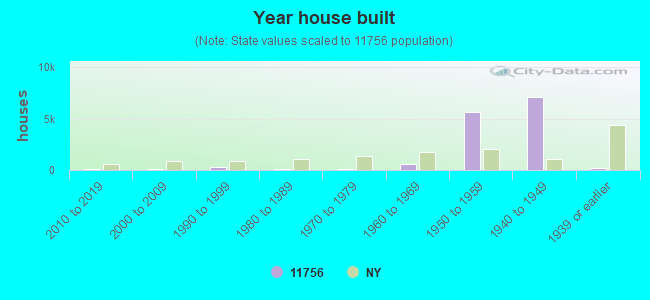


 Based on the data from the years 2002 - 2018 the average number of fire incidents per year is 63. The highest number of reported fire incidents - 134 took place in 2005, and the least - 0 in 2004. The data has a decreasing trend.
 When looking into fire subcategories, the most reports belonged to: Outside Fires (44.2%), and Structure Fires (35.7%).