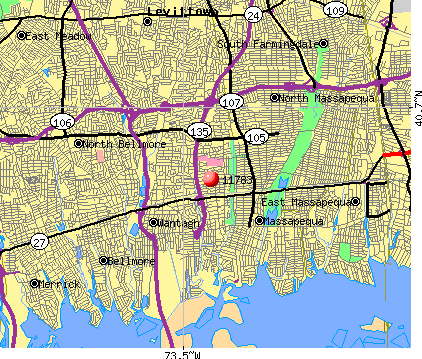
Cities: Seaford, NY (72.36%) ,
North Wantagh, NY (10.83%) ,
Levittown, NY (10.15%) ,
North Massapequa, NY (4.98%) ,
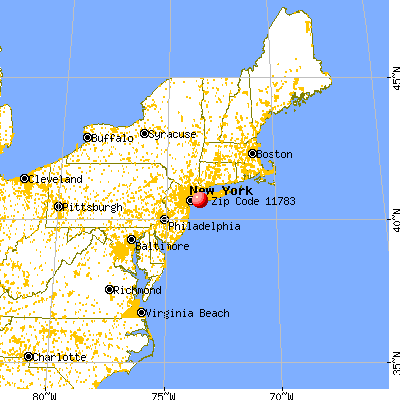
Plainedge, NY (1.68%) County: Nassau County, NY Estimated zip code population in 2022: 21,568
Zip code population in 2010: 21,288
Zip code population in 2000: 22,162
Houses and condos: 7,385
Renter-occupied apartments: 300
% of renters here:
4%State:
46%
March 2022 cost of living index in zip code 11783: 150.6
(very high, U.S. average is 100)
Land area: 3.5
sq. mi.
Water area: 0.0
sq. mi.
Population density: 6,082 people per square mile (high).
OSM Map
General Map
Google Map
MSN Map
OSM Map
General Map
Google Map
MSN Map
OSM Map
General Map
Google Map
MSN Map
OSM Map
General Map
Google Map
MSN Map
Please wait while loading the map...
Real estate property taxes paid for housing units in 2022:
This zip code:
1.6% ($9,805)New York:
1.5% ($6,180)
Median real estate property taxes paid for housing units with mortgages in 2022: $9,858 (1.5%)
Median real estate property taxes paid for housing units with no mortgage in 2022: $9,755 (1.6%)
Profiles of local businesses
Business Search - 14 Million verified businesses
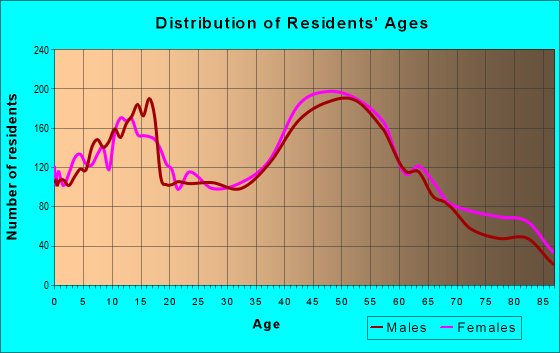
Males: 10,973 Females: 10,595
For population 25 years and over in 11783:
High school or higher: 97.0%Bachelor's degree or higher: 46.0%Graduate or professional degree: 19.8%Unemployed: 3.7%Mean travel time to work (commute): 37.9 minutes
For population 15 years and over in 11783:
Never married: 31.0%Now married: 56.4%Separated: 0.6%Widowed: 5.8%Divorced: 6.2%
Zip code 11783 compared to state average:
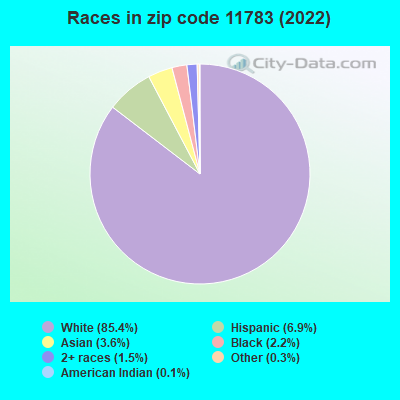
Median household income above state average. Median house value above state average. Black race population percentage significantly below state average. Hispanic race population percentage below state average. Foreign-born population percentage significantly below state average. Renting percentage significantly below state average. Length of stay since moving in significantly above state average. Number of rooms per house above state average. 18,422 85.4% White 1,484 6.9% Hispanic or Latino 768 3.6% Asian 474 2.2% Black 332 1.5% Two or more races 58 0.3% Some other race 28 0.1% American Indian
Data:
Median household income ($)
Median household income (% change since 2000)
Household income diversity
Ratio of average income to average house value (%)
Ratio of average income to average rent
Median household income ($) - White
Median household income ($) - Black or African American
Median household income ($) - Asian
Median household income ($) - Hispanic or Latino
Median household income ($) - American Indian and Alaska Native
Median household income ($) - Multirace
Median household income ($) - Other Race
Median household income for houses/condos with a mortgage ($)
Median household income for apartments without a mortgage ($)
Races - White alone (%)
Races - White alone (% change since 2000)
Races - Black alone (%)
Races - Black alone (% change since 2000)
Races - American Indian alone (%)
Races - American Indian alone (% change since 2000)
Races - Asian alone (%)
Races - Asian alone (% change since 2000)
Races - Hispanic (%)
Races - Hispanic (% change since 2000)
Races - Native Hawaiian and Other Pacific Islander alone (%)
Races - Native Hawaiian and Other Pacific Islander alone (% change since 2000)
Races - Two or more races (%)
Races - Two or more races (% change since 2000)
Races - Other race alone (%)
Races - Other race alone (% change since 2000)
Racial diversity
Unemployment (%)
Unemployment (% change since 2000)
Unemployment (%) - White
Unemployment (%) - Black or African American
Unemployment (%) - Asian
Unemployment (%) - Hispanic or Latino
Unemployment (%) - American Indian and Alaska Native
Unemployment (%) - Multirace
Unemployment (%) - Other Race
Population density (people per square mile)
Population - Males (%)
Population - Females (%)
Population - Males (%) - White
Population - Males (%) - Black or African American
Population - Males (%) - Asian
Population - Males (%) - Hispanic or Latino
Population - Males (%) - American Indian and Alaska Native
Population - Males (%) - Multirace
Population - Males (%) - Other Race
Population - Females (%) - White
Population - Females (%) - Black or African American
Population - Females (%) - Asian
Population - Females (%) - Hispanic or Latino
Population - Females (%) - American Indian and Alaska Native
Population - Females (%) - Multirace
Population - Females (%) - Other Race
Coronavirus confirmed cases (Apr 27, 2024)
Deaths caused by coronavirus (Apr 27, 2024)
Coronavirus confirmed cases (per 100k population) (Apr 27, 2024)
Deaths caused by coronavirus (per 100k population) (Apr 27, 2024)
Daily increase in number of cases (Apr 27, 2024)
Weekly increase in number of cases (Apr 27, 2024)
Cases doubled (in days) (Apr 27, 2024)
Hospitalized patients (Apr 18, 2022)
Negative test results (Apr 18, 2022)
Total test results (Apr 18, 2022)
COVID Vaccine doses distributed (per 100k population) (Sep 19, 2023)
COVID Vaccine doses administered (per 100k population) (Sep 19, 2023)
COVID Vaccine doses distributed (Sep 19, 2023)
COVID Vaccine doses administered (Sep 19, 2023)
Likely homosexual households (%)
Likely homosexual households (% change since 2000)
Likely homosexual households - Lesbian couples (%)
Likely homosexual households - Lesbian couples (% change since 2000)
Likely homosexual households - Gay men (%)
Likely homosexual households - Gay men (% change since 2000)
Cost of living index
Median gross rent ($)
Median contract rent ($)
Median monthly housing costs ($)
Median house or condo value ($)
Median house or condo value ($ change since 2000)
Mean house or condo value by units in structure - 1, detached ($)
Mean house or condo value by units in structure - 1, attached ($)
Mean house or condo value by units in structure - 2 ($)
Mean house or condo value by units in structure by units in structure - 3 or 4 ($)
Mean house or condo value by units in structure - 5 or more ($)
Mean house or condo value by units in structure - Boat, RV, van, etc. ($)
Mean house or condo value by units in structure - Mobile home ($)
Median house or condo value ($) - White
Median house or condo value ($) - Black or African American
Median house or condo value ($) - Asian
Median house or condo value ($) - Hispanic or Latino
Median house or condo value ($) - American Indian and Alaska Native
Median house or condo value ($) - Multirace
Median house or condo value ($) - Other Race
Median resident age
Resident age diversity
Median resident age - Males
Median resident age - Females
Median resident age - White
Median resident age - Black or African American
Median resident age - Asian
Median resident age - Hispanic or Latino
Median resident age - American Indian and Alaska Native
Median resident age - Multirace
Median resident age - Other Race
Median resident age - Males - White
Median resident age - Males - Black or African American
Median resident age - Males - Asian
Median resident age - Males - Hispanic or Latino
Median resident age - Males - American Indian and Alaska Native
Median resident age - Males - Multirace
Median resident age - Males - Other Race
Median resident age - Females - White
Median resident age - Females - Black or African American
Median resident age - Females - Asian
Median resident age - Females - Hispanic or Latino
Median resident age - Females - American Indian and Alaska Native
Median resident age - Females - Multirace
Median resident age - Females - Other Race
Commute - mean travel time to work (minutes)
Travel time to work - Less than 5 minutes (%)
Travel time to work - Less than 5 minutes (% change since 2000)
Travel time to work - 5 to 9 minutes (%)
Travel time to work - 5 to 9 minutes (% change since 2000)
Travel time to work - 10 to 19 minutes (%)
Travel time to work - 10 to 19 minutes (% change since 2000)
Travel time to work - 20 to 29 minutes (%)
Travel time to work - 20 to 29 minutes (% change since 2000)
Travel time to work - 30 to 39 minutes (%)
Travel time to work - 30 to 39 minutes (% change since 2000)
Travel time to work - 40 to 59 minutes (%)
Travel time to work - 40 to 59 minutes (% change since 2000)
Travel time to work - 60 to 89 minutes (%)
Travel time to work - 60 to 89 minutes (% change since 2000)
Travel time to work - 90 or more minutes (%)
Travel time to work - 90 or more minutes (% change since 2000)
Marital status - Never married (%)
Marital status - Now married (%)
Marital status - Separated (%)
Marital status - Widowed (%)
Marital status - Divorced (%)
Median family income ($)
Median family income (% change since 2000)
Median non-family income ($)
Median non-family income (% change since 2000)
Median per capita income ($)
Median per capita income (% change since 2000)
Median family income ($) - White
Median family income ($) - Black or African American
Median family income ($) - Asian
Median family income ($) - Hispanic or Latino
Median family income ($) - American Indian and Alaska Native
Median family income ($) - Multirace
Median family income ($) - Other Race
Median year house/condo built
Median year apartment built
Year house built - Built 2005 or later (%)
Year house built - Built 2000 to 2004 (%)
Year house built - Built 1990 to 1999 (%)
Year house built - Built 1980 to 1989 (%)
Year house built - Built 1970 to 1979 (%)
Year house built - Built 1960 to 1969 (%)
Year house built - Built 1950 to 1959 (%)
Year house built - Built 1940 to 1949 (%)
Year house built - Built 1939 or earlier (%)
Average household size
Household density (households per square mile)
Average household size - White
Average household size - Black or African American
Average household size - Asian
Average household size - Hispanic or Latino
Average household size - American Indian and Alaska Native
Average household size - Multirace
Average household size - Other Race
Occupied housing units (%)
Vacant housing units (%)
Owner occupied housing units (%)
Renter occupied housing units (%)
Vacancy status - For rent (%)
Vacancy status - For sale only (%)
Vacancy status - Rented or sold, not occupied (%)
Vacancy status - For seasonal, recreational, or occasional use (%)
Vacancy status - For migrant workers (%)
Vacancy status - Other vacant (%)
Residents with income below the poverty level (%)
Residents with income below 50% of the poverty level (%)
Children below poverty level (%)
Poor families by family type - Married-couple family (%)
Poor families by family type - Male, no wife present (%)
Poor families by family type - Female, no husband present (%)
Poverty status for native-born residents (%)
Poverty status for foreign-born residents (%)
Poverty among high school graduates not in families (%)
Poverty among people who did not graduate high school not in families (%)
Residents with income below the poverty level (%) - White
Residents with income below the poverty level (%) - Black or African American
Residents with income below the poverty level (%) - Asian
Residents with income below the poverty level (%) - Hispanic or Latino
Residents with income below the poverty level (%) - American Indian and Alaska Native
Residents with income below the poverty level (%) - Multirace
Residents with income below the poverty level (%) - Other Race
Air pollution - Air Quality Index (AQI)
Air pollution - CO
Air pollution - NO2
Air pollution - SO2
Air pollution - Ozone
Air pollution - PM10
Air pollution - PM25
Air pollution - Pb
Crime - Murders per 100,000 population
Crime - Rapes per 100,000 population
Crime - Robberies per 100,000 population
Crime - Assaults per 100,000 population
Crime - Burglaries per 100,000 population
Crime - Thefts per 100,000 population
Crime - Auto thefts per 100,000 population
Crime - Arson per 100,000 population
Crime - City-data.com crime index
Crime - Violent crime index
Crime - Property crime index
Crime - Murders per 100,000 population (5 year average)
Crime - Rapes per 100,000 population (5 year average)
Crime - Robberies per 100,000 population (5 year average)
Crime - Assaults per 100,000 population (5 year average)
Crime - Burglaries per 100,000 population (5 year average)
Crime - Thefts per 100,000 population (5 year average)
Crime - Auto thefts per 100,000 population (5 year average)
Crime - Arson per 100,000 population (5 year average)
Crime - City-data.com crime index (5 year average)
Crime - Violent crime index (5 year average)
Crime - Property crime index (5 year average)
1996 Presidential Elections Results (%) - Democratic Party (Clinton)
1996 Presidential Elections Results (%) - Republican Party (Dole)
1996 Presidential Elections Results (%) - Other
2000 Presidential Elections Results (%) - Democratic Party (Gore)
2000 Presidential Elections Results (%) - Republican Party (Bush)
2000 Presidential Elections Results (%) - Other
2004 Presidential Elections Results (%) - Democratic Party (Kerry)
2004 Presidential Elections Results (%) - Republican Party (Bush)
2004 Presidential Elections Results (%) - Other
2008 Presidential Elections Results (%) - Democratic Party (Obama)
2008 Presidential Elections Results (%) - Republican Party (McCain)
2008 Presidential Elections Results (%) - Other
2012 Presidential Elections Results (%) - Democratic Party (Obama)
2012 Presidential Elections Results (%) - Republican Party (Romney)
2012 Presidential Elections Results (%) - Other
2016 Presidential Elections Results (%) - Democratic Party (Clinton)
2016 Presidential Elections Results (%) - Republican Party (Trump)
2016 Presidential Elections Results (%) - Other
2020 Presidential Elections Results (%) - Democratic Party (Biden)
2020 Presidential Elections Results (%) - Republican Party (Trump)
2020 Presidential Elections Results (%) - Other
Ancestries Reported - Arab (%)
Ancestries Reported - Czech (%)
Ancestries Reported - Danish (%)
Ancestries Reported - Dutch (%)
Ancestries Reported - English (%)
Ancestries Reported - French (%)
Ancestries Reported - French Canadian (%)
Ancestries Reported - German (%)
Ancestries Reported - Greek (%)
Ancestries Reported - Hungarian (%)
Ancestries Reported - Irish (%)
Ancestries Reported - Italian (%)
Ancestries Reported - Lithuanian (%)
Ancestries Reported - Norwegian (%)
Ancestries Reported - Polish (%)
Ancestries Reported - Portuguese (%)
Ancestries Reported - Russian (%)
Ancestries Reported - Scotch-Irish (%)
Ancestries Reported - Scottish (%)
Ancestries Reported - Slovak (%)
Ancestries Reported - Subsaharan African (%)
Ancestries Reported - Swedish (%)
Ancestries Reported - Swiss (%)
Ancestries Reported - Ukrainian (%)
Ancestries Reported - United States (%)
Ancestries Reported - Welsh (%)
Ancestries Reported - West Indian (%)
Ancestries Reported - Other (%)
Educational Attainment - No schooling completed (%)
Educational Attainment - Less than high school (%)
Educational Attainment - High school or equivalent (%)
Educational Attainment - Less than 1 year of college (%)
Educational Attainment - 1 or more years of college (%)
Educational Attainment - Associate degree (%)
Educational Attainment - Bachelor's degree (%)
Educational Attainment - Master's degree (%)
Educational Attainment - Professional school degree (%)
Educational Attainment - Doctorate degree (%)
School Enrollment - Nursery, preschool (%)
School Enrollment - Kindergarten (%)
School Enrollment - Grade 1 to 4 (%)
School Enrollment - Grade 5 to 8 (%)
School Enrollment - Grade 9 to 12 (%)
School Enrollment - College undergrad (%)
School Enrollment - Graduate or professional (%)
School Enrollment - Not enrolled in school (%)
School enrollment - Public schools (%)
School enrollment - Private schools (%)
School enrollment - Not enrolled (%)
Median number of rooms in houses and condos
Median number of rooms in apartments
Housing units lacking complete plumbing facilities (%)
Housing units lacking complete kitchen facilities (%)
Density of houses
Urban houses (%)
Rural houses (%)
Households with people 60 years and over (%)
Households with people 65 years and over (%)
Households with people 75 years and over (%)
Households with one or more nonrelatives (%)
Households with no nonrelatives (%)
Population in households (%)
Family households (%)
Nonfamily households (%)
Population in families (%)
Family households with own children (%)
Median number of bedrooms in owner occupied houses
Mean number of bedrooms in owner occupied houses
Median number of bedrooms in renter occupied houses
Mean number of bedrooms in renter occupied houses
Median number of vehichles in owner occupied houses
Mean number of vehichles in owner occupied houses
Median number of vehichles in renter occupied houses
Mean number of vehichles in renter occupied houses
Mortgage status - with mortgage (%)
Mortgage status - with second mortgage (%)
Mortgage status - with home equity loan (%)
Mortgage status - with both second mortgage and home equity loan (%)
Mortgage status - without a mortgage (%)
Average family size
Average family size - White
Average family size - Black or African American
Average family size - Asian
Average family size - Hispanic or Latino
Average family size - American Indian and Alaska Native
Average family size - Multirace
Average family size - Other Race
Geographical mobility - Same house 1 year ago (%)
Geographical mobility - Moved within same county (%)
Geographical mobility - Moved from different county within same state (%)
Geographical mobility - Moved from different state (%)
Geographical mobility - Moved from abroad (%)
Place of birth - Born in state of residence (%)
Place of birth - Born in other state (%)
Place of birth - Native, outside of US (%)
Place of birth - Foreign born (%)
Housing units in structures - 1, detached (%)
Housing units in structures - 1, attached (%)
Housing units in structures - 2 (%)
Housing units in structures - 3 or 4 (%)
Housing units in structures - 5 to 9 (%)
Housing units in structures - 10 to 19 (%)
Housing units in structures - 20 to 49 (%)
Housing units in structures - 50 or more (%)
Housing units in structures - Mobile home (%)
Housing units in structures - Boat, RV, van, etc. (%)
House/condo owner moved in on average (years ago)
Renter moved in on average (years ago)
Year householder moved into unit - Moved in 1999 to March 2000 (%)
Year householder moved into unit - Moved in 1995 to 1998 (%)
Year householder moved into unit - Moved in 1990 to 1994 (%)
Year householder moved into unit - Moved in 1980 to 1989 (%)
Year householder moved into unit - Moved in 1970 to 1979 (%)
Year householder moved into unit - Moved in 1969 or earlier (%)
Means of transportation to work - Drove car alone (%)
Means of transportation to work - Carpooled (%)
Means of transportation to work - Public transportation (%)
Means of transportation to work - Bus or trolley bus (%)
Means of transportation to work - Streetcar or trolley car (%)
Means of transportation to work - Subway or elevated (%)
Means of transportation to work - Railroad (%)
Means of transportation to work - Ferryboat (%)
Means of transportation to work - Taxicab (%)
Means of transportation to work - Motorcycle (%)
Means of transportation to work - Bicycle (%)
Means of transportation to work - Walked (%)
Means of transportation to work - Other means (%)
Working at home (%)
Industry diversity
Most Common Industries - Agriculture, forestry, fishing and hunting, and mining (%)
Most Common Industries - Agriculture, forestry, fishing and hunting (%)
Most Common Industries - Mining, quarrying, and oil and gas extraction (%)
Most Common Industries - Construction (%)
Most Common Industries - Manufacturing (%)
Most Common Industries - Wholesale trade (%)
Most Common Industries - Retail trade (%)
Most Common Industries - Transportation and warehousing, and utilities (%)
Most Common Industries - Transportation and warehousing (%)
Most Common Industries - Utilities (%)
Most Common Industries - Information (%)
Most Common Industries - Finance and insurance, and real estate and rental and leasing (%)
Most Common Industries - Finance and insurance (%)
Most Common Industries - Real estate and rental and leasing (%)
Most Common Industries - Professional, scientific, and management, and administrative and waste management services (%)
Most Common Industries - Professional, scientific, and technical services (%)
Most Common Industries - Management of companies and enterprises (%)
Most Common Industries - Administrative and support and waste management services (%)
Most Common Industries - Educational services, and health care and social assistance (%)
Most Common Industries - Educational services (%)
Most Common Industries - Health care and social assistance (%)
Most Common Industries - Arts, entertainment, and recreation, and accommodation and food services (%)
Most Common Industries - Arts, entertainment, and recreation (%)
Most Common Industries - Accommodation and food services (%)
Most Common Industries - Other services, except public administration (%)
Most Common Industries - Public administration (%)
Occupation diversity
Most Common Occupations - Management, business, science, and arts occupations (%)
Most Common Occupations - Management, business, and financial occupations (%)
Most Common Occupations - Management occupations (%)
Most Common Occupations - Business and financial operations occupations (%)
Most Common Occupations - Computer, engineering, and science occupations (%)
Most Common Occupations - Computer and mathematical occupations (%)
Most Common Occupations - Architecture and engineering occupations (%)
Most Common Occupations - Life, physical, and social science occupations (%)
Most Common Occupations - Education, legal, community service, arts, and media occupations (%)
Most Common Occupations - Community and social service occupations (%)
Most Common Occupations - Legal occupations (%)
Most Common Occupations - Education, training, and library occupations (%)
Most Common Occupations - Arts, design, entertainment, sports, and media occupations (%)
Most Common Occupations - Healthcare practitioners and technical occupations (%)
Most Common Occupations - Health diagnosing and treating practitioners and other technical occupations (%)
Most Common Occupations - Health technologists and technicians (%)
Most Common Occupations - Service occupations (%)
Most Common Occupations - Healthcare support occupations (%)
Most Common Occupations - Protective service occupations (%)
Most Common Occupations - Fire fighting and prevention, and other protective service workers including supervisors (%)
Most Common Occupations - Law enforcement workers including supervisors (%)
Most Common Occupations - Food preparation and serving related occupations (%)
Most Common Occupations - Building and grounds cleaning and maintenance occupations (%)
Most Common Occupations - Personal care and service occupations (%)
Most Common Occupations - Sales and office occupations (%)
Most Common Occupations - Sales and related occupations (%)
Most Common Occupations - Office and administrative support occupations (%)
Most Common Occupations - Natural resources, construction, and maintenance occupations (%)
Most Common Occupations - Farming, fishing, and forestry occupations (%)
Most Common Occupations - Construction and extraction occupations (%)
Most Common Occupations - Installation, maintenance, and repair occupations (%)
Most Common Occupations - Production, transportation, and material moving occupations (%)
Most Common Occupations - Production occupations (%)
Most Common Occupations - Transportation occupations (%)
Most Common Occupations - Material moving occupations (%)
People in Group quarters - Institutionalized population (%)
People in Group quarters - Correctional institutions (%)
People in Group quarters - Federal prisons and detention centers (%)
People in Group quarters - Halfway houses (%)
People in Group quarters - Local jails and other confinement facilities (including police lockups) (%)
People in Group quarters - Military disciplinary barracks (%)
People in Group quarters - State prisons (%)
People in Group quarters - Other types of correctional institutions (%)
People in Group quarters - Nursing homes (%)
People in Group quarters - Hospitals/wards, hospices, and schools for the handicapped (%)
People in Group quarters - Hospitals/wards and hospices for chronically ill (%)
People in Group quarters - Hospices or homes for chronically ill (%)
People in Group quarters - Military hospitals or wards for chronically ill (%)
People in Group quarters - Other hospitals or wards for chronically ill (%)
People in Group quarters - Hospitals or wards for drug/alcohol abuse (%)
People in Group quarters - Mental (Psychiatric) hospitals or wards (%)
People in Group quarters - Schools, hospitals, or wards for the mentally retarded (%)
People in Group quarters - Schools, hospitals, or wards for the physically handicapped (%)
People in Group quarters - Institutions for the deaf (%)
People in Group quarters - Institutions for the blind (%)
People in Group quarters - Orthopedic wards and institutions for the physically handicapped (%)
People in Group quarters - Wards in general hospitals for patients who have no usual home elsewhere (%)
People in Group quarters - Wards in military hospitals for patients who have no usual home elsewhere (%)
People in Group quarters - Juvenile institutions (%)
People in Group quarters - Long-term care (%)
People in Group quarters - Homes for abused, dependent, and neglected children (%)
People in Group quarters - Residential treatment centers for emotionally disturbed children (%)
People in Group quarters - Training schools for juvenile delinquents (%)
People in Group quarters - Short-term care, detention or diagnostic centers for delinquent children (%)
People in Group quarters - Type of juvenile institution unknown (%)
People in Group quarters - Noninstitutionalized population (%)
People in Group quarters - College dormitories (includes college quarters off campus) (%)
People in Group quarters - Military quarters (%)
People in Group quarters - On base (%)
People in Group quarters - Barracks, unaccompanied personnel housing (UPH), (Enlisted/Officer), ;and similar group living quarters for military personnel (%)
People in Group quarters - Transient quarters for temporary residents (%)
People in Group quarters - Military ships (%)
People in Group quarters - Group homes (%)
People in Group quarters - Homes or halfway houses for drug/alcohol abuse (%)
People in Group quarters - Homes for the mentally ill (%)
People in Group quarters - Homes for the mentally retarded (%)
People in Group quarters - Homes for the physically handicapped (%)
People in Group quarters - Other group homes (%)
People in Group quarters - Religious group quarters (%)
People in Group quarters - Dormitories (%)
People in Group quarters - Agriculture workers' dormitories on farms (%)
People in Group quarters - Job Corps and vocational training facilities (%)
People in Group quarters - Other workers' dormitories (%)
People in Group quarters - Crews of maritime vessels (%)
People in Group quarters - Other nonhousehold living situations (%)
People in Group quarters - Other noninstitutional group quarters (%)
Residents speaking English at home (%)
Residents speaking English at home - Born in the United States (%)
Residents speaking English at home - Native, born elsewhere (%)
Residents speaking English at home - Foreign born (%)
Residents speaking Spanish at home (%)
Residents speaking Spanish at home - Born in the United States (%)
Residents speaking Spanish at home - Native, born elsewhere (%)
Residents speaking Spanish at home - Foreign born (%)
Residents speaking other language at home (%)
Residents speaking other language at home - Born in the United States (%)
Residents speaking other language at home - Native, born elsewhere (%)
Residents speaking other language at home - Foreign born (%)
Class of Workers - Employee of private company (%)
Class of Workers - Self-employed in own incorporated business (%)
Class of Workers - Private not-for-profit wage and salary workers (%)
Class of Workers - Local government workers (%)
Class of Workers - State government workers (%)
Class of Workers - Federal government workers (%)
Class of Workers - Self-employed workers in own not incorporated business and Unpaid family workers (%)
House heating fuel used in houses and condos - Utility gas (%)
House heating fuel used in houses and condos - Bottled, tank, or LP gas (%)
House heating fuel used in houses and condos - Electricity (%)
House heating fuel used in houses and condos - Fuel oil, kerosene, etc. (%)
House heating fuel used in houses and condos - Coal or coke (%)
House heating fuel used in houses and condos - Wood (%)
House heating fuel used in houses and condos - Solar energy (%)
House heating fuel used in houses and condos - Other fuel (%)
House heating fuel used in houses and condos - No fuel used (%)
House heating fuel used in apartments - Utility gas (%)
House heating fuel used in apartments - Bottled, tank, or LP gas (%)
House heating fuel used in apartments - Electricity (%)
House heating fuel used in apartments - Fuel oil, kerosene, etc. (%)
House heating fuel used in apartments - Coal or coke (%)
House heating fuel used in apartments - Wood (%)
House heating fuel used in apartments - Solar energy (%)
House heating fuel used in apartments - Other fuel (%)
House heating fuel used in apartments - No fuel used (%)
Armed forces status - In Armed Forces (%)
Armed forces status - Civilian (%)
Armed forces status - Civilian - Veteran (%)
Armed forces status - Civilian - Nonveteran (%)
Fatal accidents locations in years 2005-2021
Fatal accidents locations in 2005
Fatal accidents locations in 2006
Fatal accidents locations in 2007
Fatal accidents locations in 2008
Fatal accidents locations in 2009
Fatal accidents locations in 2010
Fatal accidents locations in 2011
Fatal accidents locations in 2012
Fatal accidents locations in 2013
Fatal accidents locations in 2014
Fatal accidents locations in 2015
Fatal accidents locations in 2016
Fatal accidents locations in 2017
Fatal accidents locations in 2018
Fatal accidents locations in 2019
Fatal accidents locations in 2020
Fatal accidents locations in 2021
Alcohol use - People drinking some alcohol every month (%)
Alcohol use - People not drinking at all (%)
Alcohol use - Average days/month drinking alcohol
Alcohol use - Average drinks/week
Alcohol use - Average days/year people drink much
Audiometry - Average condition of hearing (%)
Audiometry - People that can hear a whisper from across a quiet room (%)
Audiometry - People that can hear normal voice from across a quiet room (%)
Audiometry - Ears ringing, roaring, buzzing (%)
Audiometry - Had a job exposure to loud noise (%)
Audiometry - Had off-work exposure to loud noise (%)
Blood Pressure & Cholesterol - Has high blood pressure (%)
Blood Pressure & Cholesterol - Checking blood pressure at home (%)
Blood Pressure & Cholesterol - Frequently checking blood cholesterol (%)
Blood Pressure & Cholesterol - Has high cholesterol level (%)
Consumer Behavior - Money monthly spent on food at supermarket/grocery store
Consumer Behavior - Money monthly spent on food at other stores
Consumer Behavior - Money monthly spent on eating out
Consumer Behavior - Money monthly spent on carryout/delivered foods
Consumer Behavior - Income spent on food at supermarket/grocery store (%)
Consumer Behavior - Income spent on food at other stores (%)
Consumer Behavior - Income spent on eating out (%)
Consumer Behavior - Income spent on carryout/delivered foods (%)
Current Health Status - General health condition (%)
Current Health Status - Blood donors (%)
Current Health Status - Has blood ever tested for HIV virus (%)
Current Health Status - Left-handed people (%)
Dermatology - People using sunscreen (%)
Diabetes - Diabetics (%)
Diabetes - Had a blood test for high blood sugar (%)
Diabetes - People taking insulin (%)
Diet Behavior & Nutrition - Diet health (%)
Diet Behavior & Nutrition - Milk product consumption (# of products/month)
Diet Behavior & Nutrition - Meals not home prepared (#/week)
Diet Behavior & Nutrition - Meals from fast food or pizza place (#/week)
Diet Behavior & Nutrition - Ready-to-eat foods (#/month)
Diet Behavior & Nutrition - Frozen meals/pizza (#/month)
Drug Use - People that ever used marijuana or hashish (%)
Drug Use - Ever used hard drugs (%)
Drug Use - Ever used any form of cocaine (%)
Drug Use - Ever used heroin (%)
Drug Use - Ever used methamphetamine (%)
Health Insurance - People covered by health insurance (%)
Kidney Conditions-Urology - Avg. # of times urinating at night
Medical Conditions - People with asthma (%)
Medical Conditions - People with anemia (%)
Medical Conditions - People with psoriasis (%)
Medical Conditions - People with overweight (%)
Medical Conditions - Elderly people having difficulties in thinking or remembering (%)
Medical Conditions - People who ever received blood transfusion (%)
Medical Conditions - People having trouble seeing even with glass/contacts (%)
Medical Conditions - People with arthritis (%)
Medical Conditions - People with gout (%)
Medical Conditions - People with congestive heart failure (%)
Medical Conditions - People with coronary heart disease (%)
Medical Conditions - People with angina pectoris (%)
Medical Conditions - People who ever had heart attack (%)
Medical Conditions - People who ever had stroke (%)
Medical Conditions - People with emphysema (%)
Medical Conditions - People with thyroid problem (%)
Medical Conditions - People with chronic bronchitis (%)
Medical Conditions - People with any liver condition (%)
Medical Conditions - People who ever had cancer or malignancy (%)
Mental Health - People who have little interest in doing things (%)
Mental Health - People feeling down, depressed, or hopeless (%)
Mental Health - People who have trouble sleeping or sleeping too much (%)
Mental Health - People feeling tired or having little energy (%)
Mental Health - People with poor appetite or overeating (%)
Mental Health - People feeling bad about themself (%)
Mental Health - People who have trouble concentrating on things (%)
Mental Health - People moving or speaking slowly or too fast (%)
Mental Health - People having thoughts they would be better off dead (%)
Oral Health - Average years since last visit a dentist
Oral Health - People embarrassed because of mouth (%)
Oral Health - People with gum disease (%)
Oral Health - General health of teeth and gums (%)
Oral Health - Average days a week using dental floss/device
Oral Health - Average days a week using mouthwash for dental problem
Oral Health - Average number of teeth
Pesticide Use - Households using pesticides to control insects (%)
Pesticide Use - Households using pesticides to kill weeds (%)
Physical Activity - People doing vigorous-intensity work activities (%)
Physical Activity - People doing moderate-intensity work activities (%)
Physical Activity - People walking or bicycling (%)
Physical Activity - People doing vigorous-intensity recreational activities (%)
Physical Activity - People doing moderate-intensity recreational activities (%)
Physical Activity - Average hours a day doing sedentary activities
Physical Activity - Average hours a day watching TV or videos
Physical Activity - Average hours a day using computer
Physical Functioning - People having limitations keeping them from working (%)
Physical Functioning - People limited in amount of work they can do (%)
Physical Functioning - People that need special equipment to walk (%)
Physical Functioning - People experiencing confusion/memory problems (%)
Physical Functioning - People requiring special healthcare equipment (%)
Prescription Medications - Average number of prescription medicines taking
Preventive Aspirin Use - Adults 40+ taking low-dose aspirin (%)
Reproductive Health - Vaginal deliveries (%)
Reproductive Health - Cesarean deliveries (%)
Reproductive Health - Deliveries resulted in a live birth (%)
Reproductive Health - Pregnancies resulted in a delivery (%)
Reproductive Health - Women breastfeeding newborns (%)
Reproductive Health - Women that had a hysterectomy (%)
Reproductive Health - Women that had both ovaries removed (%)
Reproductive Health - Women that have ever taken birth control pills (%)
Reproductive Health - Women taking birth control pills (%)
Reproductive Health - Women that have ever used Depo-Provera or injectables (%)
Reproductive Health - Women that have ever used female hormones (%)
Sexual Behavior - People 18+ that ever had sex (vaginal, anal, or oral) (%)
Sexual Behavior - Males 18+ that ever had vaginal sex with a woman (%)
Sexual Behavior - Males 18+ that ever performed oral sex on a woman (%)
Sexual Behavior - Males 18+ that ever had anal sex with a woman (%)
Sexual Behavior - Males 18+ that ever had any sex with a man (%)
Sexual Behavior - Females 18+ that ever had vaginal sex with a man (%)
Sexual Behavior - Females 18+ that ever performed oral sex on a man (%)
Sexual Behavior - Females 18+ that ever had anal sex with a man (%)
Sexual Behavior - Females 18+ that ever had any kind of sex with a woman (%)
Sexual Behavior - Average age people first had sex
Sexual Behavior - Average number of female sex partners in lifetime (males 18+)
Sexual Behavior - Average number of female vaginal sex partners in lifetime (males 18+)
Sexual Behavior - Average age people first performed oral sex on a woman (18+)
Sexual Behavior - Average number of woman performed oral sex on in lifetime (18+)
Sexual Behavior - Average number of male sex partners in lifetime (males 18+)
Sexual Behavior - Average number of male anal sex partners in lifetime (males 18+)
Sexual Behavior - Average age people first performed oral sex on a man (18+)
Sexual Behavior - Average number of male oral sex partners in lifetime (18+)
Sexual Behavior - People using protection when performing oral sex (%)
Sexual Behavior - Average number of times people have vaginal or anal sex a year
Sexual Behavior - People having sex without condom (%)
Sexual Behavior - Average number of male sex partners in lifetime (females 18+)
Sexual Behavior - Average number of male vaginal sex partners in lifetime (females 18+)
Sexual Behavior - Average number of female sex partners in lifetime (females 18+)
Sexual Behavior - Circumcised males 18+ (%)
Sleep Disorders - Average hours sleeping at night
Sleep Disorders - People that has trouble sleeping (%)
Smoking-Cigarette Use - People smoking cigarettes (%)
Taste & Smell - People 40+ having problems with smell (%)
Taste & Smell - People 40+ having problems with taste (%)
Taste & Smell - People 40+ that ever had wisdom teeth removed (%)
Taste & Smell - People 40+ that ever had tonsils teeth removed (%)
Taste & Smell - People 40+ that ever had a loss of consciousness because of a head injury (%)
Taste & Smell - People 40+ that ever had a broken nose or other serious injury to face or skull (%)
Taste & Smell - People 40+ that ever had two or more sinus infections (%)
Weight - Average height (inches)
Weight - Average weight (pounds)
Weight - Average BMI
Weight - People that are obese (%)
Weight - People that ever were obese (%)
Weight - People trying to lose weight (%)
100%
urban population.
Estimated median house/condo value in 2022: $628,589
11783:
$628,589New York:
$400,400
Median resident age: This zip code:
41.6 yearsNew York median age:
40.0 years
Average household size: This zip code:
2.9 peopleNew York:
2.5 people
Averages for the 2020 tax year for zip code 11783, filed in 2021:
Average Adjusted Gross Income (AGI) in 2020: $104,258 (Individual Income Tax Returns) Here:
$104,258State:
$90,930
Salary/wage: $92,915 (reported on 81.7% of returns )Here:
$92,915State:
$72,104
(% of AGI for various income ranges: 1109.7% for AGIs below $25k , 3565.6% for AGIs $25k-50k , 6417.1% for AGIs $50k-75k , 9393.6% for AGIs $75k-100k , 17678.1% for AGIs $100k-200k , 64873.8% for AGIs over 200k ) Taxable interest for individuals: $1,374 (reported on 57.5% of returns )This zip code:
$1,374New York:
$3,075
(% of AGI for various income ranges: 44.5% for AGIs below $25k , 57.0% for AGIs $25k-50k , 85.9% for AGIs $50k-75k , 122.1% for AGIs $75k-100k , 153.7% for AGIs $100k-200k , 576.0% for AGIs over 200k ) Ordinary dividends: $3,829 (reported on 35.7% of returns )(% of AGI for various income ranges: 53.3% for AGIs below $25k , 91.6% for AGIs $25k-50k , 139.8% for AGIs $50k-75k , 184.9% for AGIs $75k-100k , 298.0% for AGIs $100k-200k , 1018.0% for AGIs over 200k ) Net capital gain/loss in AGI: +$9,009 (reported on 30.1% of returns )Here:
+$9,009State:
+$44,925
(% of AGI for various income ranges: 22.9% for AGIs below $25k , 77.5% for AGIs $25k-50k , 113.5% for AGIs $50k-75k , 139.1% for AGIs $75k-100k , 307.9% for AGIs $100k-200k , 4063.5% for AGIs over 200k ) Profit/loss from business: +$14,975 (reported on 12.1% of returns )Here:
+$14,975State:
+$14,940
(% of AGI for various income ranges: 85.5% for AGIs below $25k , 152.1% for AGIs $25k-50k , 132.9% for AGIs $50k-75k , 136.1% for AGIs $75k-100k , 351.9% for AGIs $100k-200k , 1635.5% for AGIs over 200k ) Taxable individual retirement arrangement distribution: $19,086 (reported on 12.1% of returns )11783:
$19,086New York:
$19,609
(% of AGI for various income ranges: 81.0% for AGIs below $25k , 172.5% for AGIs $25k-50k , 260.2% for AGIs $50k-75k , 406.4% for AGIs $75k-100k , 550.7% for AGIs $100k-200k , 1354.7% for AGIs over 200k ) Self-employed (Keogh) retirement plans: $22,190 (reported on 0.9% of returns )11783:
$22,190New York:
$32,497
(% of AGI for various income ranges: 30.9% for AGIs $100k-200k , 300.7% for AGIs over 200k ) Total itemized deductions: $27,468 (reported on 21.1% of returns )Here:
$27,468State:
$39,326
(% of AGI for various income ranges: 208.5% for AGIs below $25k , 277.3% for AGIs $25k-50k , 523.4% for AGIs $50k-75k , 978.3% for AGIs $75k-100k , 1515.9% for AGIs $100k-200k , 3625.8% for AGIs over 200k ) Charity contributions: $3,831 (reported on 18.9% of returns )(% of AGI for various income ranges: 8.4% for AGIs below $25k , 24.5% for AGIs $25k-50k , 49.7% for AGIs $50k-75k , 91.9% for AGIs $75k-100k , 177.1% for AGIs $100k-200k , 640.4% for AGIs over 200k ) Taxes paid: $9,512 (reported on 20.9% of returns )(% of AGI for various income ranges: 57.0% for AGIs below $25k , 101.7% for AGIs $25k-50k , 200.5% for AGIs $50k-75k , 373.9% for AGIs $75k-100k , 538.1% for AGIs $100k-200k , 1117.6% for AGIs over 200k ) Earned income credit: $1,427 (reported on 4.4% of returns )(% of AGI for various income ranges: 30.2% for AGIs below $25k , 24.1% for AGIs $25k-50k ) Percentage of individuals using paid preparers for their 2020 taxes: 95.4%(% for various income ranges: 93.1% for AGIs below $25k , 95.9% for AGIs $25k-50k , 96.7% for AGIs $50k-75k , 96.0% for AGIs $75k-100k , 96.1% for AGIs $100k-200k , 95.9% for AGIs over 200k )
Averages for the 2012 tax year for zip code 11783, filed in 2013:
Average Adjusted Gross Income (AGI) in 2012: $88,788 (Individual Income Tax Returns) Here:
$88,788State:
$77,088
Salary/wage: $80,933 (reported on 83.5% of returns )Here:
$80,933State:
$60,593
(% of AGI for various income ranges: 64.7% for AGIs below $25k , 72.2% for AGIs $25k-50k , 71.7% for AGIs $50k-75k , 70.4% for AGIs $75k-100k , 80.3% for AGIs $100k-200k , 76.1% for AGIs over 200k ) Taxable interest for individuals: $1,316 (reported on 61.5% of returns )This zip code:
$1,316New York:
$3,125
(% of AGI for various income ranges: 3.0% for AGIs below $25k , 1.2% for AGIs $25k-50k , 0.9% for AGIs $50k-75k , 0.9% for AGIs $75k-100k , 0.6% for AGIs $100k-200k , 1.0% for AGIs over 200k ) Ordinary dividends: $3,283 (reported on 34.7% of returns )(% of AGI for various income ranges: 3.6% for AGIs below $25k , 1.6% for AGIs $25k-50k , 1.3% for AGIs $50k-75k , 1.5% for AGIs $75k-100k , 0.9% for AGIs $100k-200k , 1.4% for AGIs over 200k ) Net capital gain/loss in AGI: +$4,486 (reported on 25.9% of returns )Here:
+$4,486State:
+$42,474
(% of AGI for various income ranges: 0.4% for AGIs $75k-100k , 0.3% for AGIs $100k-200k , 4.0% for AGIs over 200k ) Profit/loss from business: +$13,598 (reported on 12.1% of returns )Here:
+$13,598State:
+$16,168
(% of AGI for various income ranges: 8.1% for AGIs below $25k , 3.3% for AGIs $25k-50k , 2.1% for AGIs $50k-75k , 1.8% for AGIs $75k-100k , 1.5% for AGIs $100k-200k , 1.3% for AGIs over 200k ) Taxable individual retirement arrangement distribution: $14,761 (reported on 13.8% of returns )11783:
$14,761New York:
$17,621
(% of AGI for various income ranges: 6.1% for AGIs below $25k , 3.3% for AGIs $25k-50k , 3.5% for AGIs $50k-75k , 2.8% for AGIs $75k-100k , 2.2% for AGIs $100k-200k , 1.1% for AGIs over 200k ) Self-employment retirement plans: $19,688 (reported on 0.7% of returns )11783:
$19,688New York:
$27,330
(% of AGI for various income ranges: 0.4% for AGIs $50k-75k , 0.1% for AGIs $100k-200k , 0.3% for AGIs over 200k ) Total itemized deductions: $33,533 (26% of AGI, reported on 59.2% of returns )Here:
$33,533State:
$34,985
Here:
25.8% of AGIState:
21.3% of AGI
(% of AGI for various income ranges: 28.3% for AGIs below $25k , 23.4% for AGIs $25k-50k , 22.5% for AGIs $50k-75k , 26.5% for AGIs $75k-100k , 24.2% for AGIs $100k-200k , 17.3% for AGIs over 200k ) Charity contributions: $2,515 (reported on 54.9% of returns )(% of AGI for various income ranges: 1.1% for AGIs below $25k , 1.5% for AGIs $25k-50k , 1.7% for AGIs $50k-75k , 1.8% for AGIs $75k-100k , 1.7% for AGIs $100k-200k , 1.4% for AGIs over 200k ) Taxes paid: $17,016 (reported on 59.1% of returns )11783:
$17,016State:
$18,656
(% of AGI for various income ranges: 11.6% for AGIs below $25k , 9.7% for AGIs $25k-50k , 10.2% for AGIs $50k-75k , 11.9% for AGIs $75k-100k , 11.9% for AGIs $100k-200k , 11.0% for AGIs over 200k ) Earned income credit: $1,498 (reported on 5.3% of returns )(% of AGI for various income ranges: 2.0% for AGIs below $25k , 0.4% for AGIs $25k-50k ) Percentage of individuals using paid preparers for their 2012 taxes: 71.8%(% for various income ranges: 63.9% for AGIs below $25k , 67.3% for AGIs $25k-50k , 73.2% for AGIs $50k-75k , 78.5% for AGIs $75k-100k , 78.2% for AGIs $100k-200k , 75.7% for AGIs over 200k )
Averages for the 2004 tax year for zip code 11783, filed in 2005:
Average Adjusted Gross Income (AGI) in 2004: $68,926 (Individual Income Tax Returns) Here:
$68,926State:
$59,519
Salary/wage: $64,429 (reported on 83.0% of returns )Here:
$64,429State:
$50,673
(% of AGI for various income ranges: 121.7% for AGIs below $10k , 61.5% for AGIs $10k-25k , 76.5% for AGIs $25k-50k , 75.9% for AGIs $50k-75k , 79.5% for AGIs $75k-100k , 78.2% for AGIs over 100k ) Taxable interest for individuals: $1,443 (reported on 73.2% of returns )This zip code:
$1,443New York:
$2,377
(% of AGI for various income ranges: 13.5% for AGIs below $10k , 5.3% for AGIs $10k-25k , 2.1% for AGIs $25k-50k , 1.7% for AGIs $50k-75k , 1.4% for AGIs $75k-100k , 1.0% for AGIs over 100k ) Taxable dividends: $2,130 (reported on 40.2% of returns )(% of AGI for various income ranges: 8.5% for AGIs below $10k , 2.9% for AGIs $10k-25k , 1.5% for AGIs $25k-50k , 1.2% for AGIs $50k-75k , 1.0% for AGIs $75k-100k , 1.1% for AGIs over 100k ) Net capital gain/loss: +$3,762 (reported on 31.2% of returns )Here:
+$3,762State:
+$23,581
(% of AGI for various income ranges: -6.6% for AGIs below $10k , -0.9% for AGIs $10k-25k , -0.1% for AGIs $25k-50k , -0.0% for AGIs $50k-75k , 0.3% for AGIs $75k-100k , 3.1% for AGIs over 100k ) Profit/loss from business: +$11,960 (reported on 12.2% of returns )Here:
+$11,960State:
+$13,809
(% of AGI for various income ranges: 4.6% for AGIs below $10k , 5.7% for AGIs $10k-25k , 2.6% for AGIs $25k-50k , 2.0% for AGIs $50k-75k , 2.4% for AGIs $75k-100k , 1.7% for AGIs over 100k ) IRA payment deduction: $3,446 (reported on 4.4% of returns )11783:
$3,446New York:
$3,115
(% of AGI for various income ranges: 0.3% for AGIs $10k-25k , 0.4% for AGIs $25k-50k , 0.3% for AGIs $50k-75k , 0.3% for AGIs $75k-100k , 0.1% for AGIs over 100k ) Self-employed pension: $11,551 (reported on 0.9% of returns )Here:
$11,551New York:
$19,016
(% of AGI for various income ranges: 0.1% for AGIs $50k-75k , 0.1% for AGIs $75k-100k , 0.2% for AGIs over 100k ) Total itemized deductions: $24,715 (25% of AGI, reported on 60.1% of returns )Here:
$24,715State:
$25,864
Here:
24.9% of AGIState:
21.9% of AGI
(% of AGI for various income ranges: 40.7% for AGIs below $10k , 24.2% for AGIs $10k-25k , 21.3% for AGIs $25k-50k , 24.4% for AGIs $50k-75k , 25.1% for AGIs $75k-100k , 19.5% for AGIs over 100k ) Charity contributions deductions: $2,623 (3% of AGI, reported on 57.9% of returns )Here:
2.6% of AGIState:
3.6% of AGI
(% of AGI for various income ranges: 1.5% for AGIs below $10k , 2.0% for AGIs $10k-25k , 2.1% for AGIs $25k-50k , 2.6% for AGIs $50k-75k , 2.5% for AGIs $75k-100k , 2.0% for AGIs over 100k ) Total tax: $10,699 (reported on 83.5% of returns )11783:
$10,699State:
$11,730
(% of AGI for various income ranges: 3.7% for AGIs below $10k , 4.3% for AGIs $10k-25k , 7.5% for AGIs $25k-50k , 8.8% for AGIs $50k-75k , 9.2% for AGIs $75k-100k , 16.8% for AGIs over 100k ) Earned income credit: $1,319 (reported on 4.2% of returns )Percentage of individuals using paid preparers for their 2004 taxes: 70.4%(% for various income ranges: 59.8% for AGIs below $10k , 66.2% for AGIs $10k-25k , 67.9% for AGIs $25k-50k , 74.8% for AGIs $50k-75k , 76.9% for AGIs $75k-100k , 76.2% for AGIs over 100k )
Estimated median household income in 2022: This zip code:
$154,433New York:
$79,557
Nearest zip codes: 11758 ,
11793 ,
11762 ,
11710 ,
11756 ,
11714 .
Seaford Zip Code Map
Percentage of family households: This zip code:
55.6%New York:
41.3%
Percentage of households with unmarried partners: This zip code:
3.4%New York:
42.3%
Likely homosexual households (counted as self-reported same-sex unmarried-partner households)
Lesbian couples: 0.1% of all households Gay men: 0.1% of all households
Household received Food Stamps/SNAP in the past 12 months: 223Household did not receive Food Stamps/SNAP in the past 12 months: 6,923
Women who had a birth in the past 12 months: 321 (316 now married , 0 unmarried) Women who did not have a birth in the past 12 months: 4,687 (1,886 now married , 2,792 unmarried)
Housing units in zip code 11783 with a mortgage: 4,315 (504
second mortgage , 13
home equity loan , 430
both second mortgage and home equity loan )
Houses without a mortgage: 212
Median monthly owner costs for units with a mortgage: $3,455
Median monthly owner costs for units without a mortgage: $1,487
Residents with income below the poverty level in 2022:
This zip code:
2.3%Whole state:
14.3%
Residents with income below 50% of the poverty level in 2022:
This zip code:
1.4%Whole state:
6.8%
Median number of rooms in houses and condos: Median number of rooms in apartments:
Year house built (houses)
0 2020 or later248 2010 to 2019165 2000 to 2009101 1990 to 1999261 1980 to 1989491 1970 to 1979918 1960 to 19694,141 1950 to 1959322 1940 to 1949675 1939 or earlier
Zip code 11783 household income distribution in 2022 42 Less than $10,00045 $10,000 to $14,99918 $15,000 to $19,999153 $20,000 to $24,999121 $25,000 to $29,99947 $30,000 to $34,99994 $35,000 to $39,99967 $40,000 to $44,999104 $45,000 to $49,999215 $50,000 to $59,999360 $60,000 to $74,999577 $75,000 to $99,999985 $100,000 to $124,999640 $125,000 to $149,9991,105 $150,000 to $199,9992,567 $200,000 or moreEstimate of home value of owner-occupied houses/condos in 2022 in zip code 11783 7 $20,000 to $24,9994 $40,000 to $49,9992 $50,000 to $59,9993 $60,000 to $69,99911 $70,000 to $79,99916 $90,000 to $99,99912 $100,000 to $124,99916 $125,000 to $149,99958 $150,000 to $174,99920 $200,000 to $249,9997 $250,000 to $299,999289 $300,000 to $399,9991,215 $400,000 to $499,9994,570 $500,000 to $749,999936 $750,000 to $999,99979 $1,000,000 to $1,499,99920 $1,500,000 to $1,999,99929 $2,000,000 or moreRent paid by renters in 2022 in zip code 11783 9 $1,000 to $1,24932 $1,250 to $1,49931 $1,500 to $1,999118 $2,000 to $2,49917 $2,500 to $2,99943 $3,000 to $3,49934 $3,500 or more2 No cash rent
Median gross rent in 2022: $2,625.
Median price asked for vacant for-sale houses and condos in 2022: $616,724.
Estimated median house (or condo) value in 2022 for: White Non-Hispanic householders: $626,173Black or African American householders: $738,096Asian householders: $770,035Some other race householders: $603,896Two or more races householders: $577,056Hispanic or Latino householders: $595,039Estimated median house or condo value in 2022: $628,589
11783:
$628,589New York:
$400,400
Lower value quartile - upper value quartile: $534,848 - $719,449
Mean price in 2022: Detached houses: $835,207Here:
$835,207State:
$476,719
Townhouses or other attached units: $903,454Here:
$903,454State:
$699,270
In 2-unit structures: $617,412Here:
$617,412State:
$713,077
In 3-to-4-unit structures: $288,066Here:
$288,066State:
$764,568
In 5-or-more-unit structures: $450,684Here:
$450,684State:
$912,009
Mobile homes: $1,988,032Here:
$1,988,032State:
$88,925
Housing units in structures:
One, detached: 6,884One, attached: 58Two: 1253 or 4: 105 to 9: 4510 to 19: 7420 to 49: 5450 or more: 23Mobile homes: 46Unemployment : 3.7%
Means of transportation to work in zip code 11783 68.0% 7,882 Drove a car alone6.5% 749 Carpooled0.0% 1 Bus or trolley bus2.6% 303 Streetcar or trolley car9.2% 1,072 Subway or elevated0.1% 7 Motorcycle0.1% 16 Bicycle0.6% 66 Walked0.1% 15 Other means10.3% 1,196 Worked at homeTravel time to work (commute) in zip code 11783 122 Less than 5 minutes503 5 to 9 minutes995 10 to 14 minutes1,357 15 to 19 minutes1,047 20 to 24 minutes664 25 to 29 minutes1,306 30 to 34 minutes136 35 to 39 minutes488 40 to 44 minutes964 45 to 59 minutes1,795 60 to 89 minutes908 90 or more minutes
Neighborhoods in zip code 11783: Percentage of zip code residents living and working in this county: 62.5%
Household type by relationship:
Households: 21,568
Male householders: 3,618 (519 living alone ), Female householders: 3,637 (525 living alone )4,829 spouses (4,785 opposite-sex spouses ), 250 unmarried partners , (250 opposite-sex unmarried partners ), 7,773 children (7,455 natural , 147 adopted , 172 stepchildren ), 290 grandchildren , 59 brothers or sisters , 253 parents , 0 foster children , 280 other relatives , 352 non-relatives In group quarters: 120 (-1 institutionalized population )
Size of family households: 1,873 2-persons , 1,518 3-persons , 1,550 4-persons , 636 5-persons , 174 6-persons , 128 7-or-more-persons
Size of nonfamily households: 1,044 1-person , 185 2-persons , 28 3-persons
3,700 married couples with children. single-parent households (34 men , 349 women ).
88.2% of residents of 11783 zip code speak English at home. of residents speak Spanish at home (61% very well, 16% well, 23% not well ).of residents speak other Indo-European language at home (73% very well, 20% well, 7% not well ).of residents speak Asian or Pacific Island language at home (75% very well, 17% well, 6% not well, 2% not at all ).of residents speak other language at home (84% very well, 16% well ).
Foreign born population: 1,792 (8.3%)
(93.6%
of them are naturalized citizens )
This zip code:
8.3%Whole state:
22.7%
17% Greece 8% Chile 7% Haiti 5% China, excluding Hong Kong and Taiwan 3% Denmark 3% Colombia 3% Costa Rica 43% Italian 12% Irish 7% American 5% German 3% Polish 2% Russian 2% Jamaican
Year of entry for the foreign-born population
81 2010 or later 401 2000 to 2009 302 1990 to 1999 1,093 Before 1990
Facilities with environmental interests located in this zip code:
GETTY SERVICE STATION (4030 MERRICK RD in SEAFORD, NY)
AIR MINOR (AIRS/AFS) STATE MASTER (New York facility tracking) - GROUNDWATER PROGRAM (Resource Conservation and Recovery Act (tracking hazardous waste)) Business SIC classification: GASOLINE SERVICE STATIONSOrganizations: GETTY PETROLEUM MARKETING INC (LEGALLY RESPONSIBLE PARTY)
ANTHONY'S MARINA (2740 PECONIC AVE in SEAFORD, NY)
(Integrated Compliance Information System) - ICIS-02-2001-7912, FORMAL ENFORCEMENT ACTION Business SIC classification: MARINAS
AMOCO GAS STATION (3736 MERRICK BLVD in SEAFORD, NY)
(Resource Conservation and Recovery Act (tracking hazardous waste))
HEMPSTEAD TOWN OF SEAMAN NECK PARK (2700 SEAMAN NECK RD in SEAFORD, NY)
(Resource Conservation and Recovery Act (tracking hazardous waste))
CLIFFORD ALAN GRECO DDS PC (4100 DUFF PL in SEAFORD, NY)
(Resource Conservation and Recovery Act (tracking hazardous waste))
Housing units lacking complete plumbing facilities: 0.4%
Housing units lacking complete kitchen facilities: 0.1%
59.6% Utility gas 38.0% Fuel oil, kerosene, etc. 1.4% Electricity
Population in 1990: 21,644. Population change in the 1990s: +518 (+2.4%).
Place of birth for U.S.-born residents:
This state: 18,662Northeast: 247Midwest: 214South: 298West: 110
77% of the 11783 zip code residents lived in the same house 5 years ago.
Out of people who lived in different houses, 67% lived in this county.
Out of people who lived in different counties, 50% lived in New York.
95% of the 11783 zip code residents lived in the same house 1 year ago.
Out of people who lived in different houses, 63% moved from this county.
Out of people who lived in different houses, 32% moved from different county within same state.
Out of people who lived in different houses, 2% moved from different state.
Private vs. public school enrollment:
Students in private schools in grades 1 to 8 (elementary and middle school): 28
Students in private schools in grades 9 to 12 (high school): 288
Students in private undergraduate colleges: 333
Occupation by median earnings in the past 12 months ($)
156,408 Legal occupations 108,109 Management occupations 106,145 Transportation occupations 99,600 Health diagnosing and treating practitioners and other technical occupations 96,573 Law enforcement workers including supervisors 92,373 Business and financial operations occupations
Top industries in this zip code by the number of employees in 2005:
Educational Services: Elementary and Secondary Schools (250-499 employees: 1 establishment, 10-19 employees: 1 establishment)Other Services (except Public Administration): Religious Organizations (50-99: 2, 20-49: 2)Accommodation and Food Services: Full-Service Restaurants (20-49: 2, 10-19: 2, 5-9: 8, 1-4: 3)Accommodation and Food Services: Limited-Service Restaurants (20-49: 2, 10-19: 1, 5-9: 2, 1-4: 10)Professional, Scientific, and Technical Services: Testing Laboratories (50-99: 1, 10-19: 2, 1-4: 1)Construction: Plumbing, Heating, and Air-Conditioning Contractors (20-49: 1, 10-19: 2, 5-9: 1, 1-4: 12)Administrative and Support and Waste Management and Remediation Services: Security Guards and Patrol Services (50-99: 1, 10-19: 1)Health Care and Social Assistance: Child Day Care Services (20-49: 2, 10-19: 1, 1-4: 3)Health Care and Social Assistance: Offices of Physicians (except Mental Health Specialists) (20-49: 1, 10-19: 2, 5-9: 1, 1-4: 3)
People in group quarters in 2010:
71 people in group homes intended for adults
14 people in other noninstitutional facilities
People in group quarters in 2000:
32 people in homes for the mentally retarded
23 people in religious group quarters
8 people in other noninstitutional group quarters
Fatal accident statistics in 2013:
Fatal accident count: 3Vehicles involved in fatal accidents: 5Fatal accidents caused by drunken drivers: 0Fatalities: 3Persons involved in fatal accidents: 5Pedestrians involved in fatal accidents: 1
Fatal accident statistics in 2011:
Fatal accident count: 1Vehicles involved in fatal accidents: 1Fatal accidents caused by drunken drivers: 0Fatalities: 1Persons involved in fatal accidents: 1Pedestrians involved in fatal accidents: 1
Home Mortgage Disclosure Act Aggregated Statistics For Year 2009(Based on 6 full and 6 partial tracts) A) FHA, FSA/RHS & VA B) Conventional C) Refinancings D) Home Improvement Loans F) Non-occupant Loans on Number Average Value Number Average Value Number Average Value Number Average Value Number Average Value
LOANS ORIGINATED 87 $395,522 199 $322,691 612 $275,641 48 $157,366 13 $235,088 APPLICATIONS APPROVED, NOT ACCEPTED 12 $374,393 23 $297,713 80 $263,239 5 $146,692 0 $0 APPLICATIONS DENIED 13 $385,270 44 $301,357 305 $323,553 39 $74,238 15 $262,859 APPLICATIONS WITHDRAWN 16 $350,984 22 $369,968 180 $302,101 20 $221,780 2 $295,830 FILES CLOSED FOR INCOMPLETENESS 6 $407,718 2 $301,070 50 $325,530 2 $38,970 2 $297,130
Aggregated Statistics For Year 2008(Based on 6 full and 6 partial tracts) A) FHA, FSA/RHS & VA B) Conventional C) Refinancings D) Home Improvement Loans F) Non-occupant Loans on Number Average Value Number Average Value Number Average Value Number Average Value Number Average Value
LOANS ORIGINATED 34 $397,191 230 $333,755 268 $264,828 81 $104,283 5 $237,566 APPLICATIONS APPROVED, NOT ACCEPTED 2 $349,740 44 $339,153 56 $315,057 6 $98,995 2 $256,385 APPLICATIONS DENIED 11 $338,672 74 $321,740 209 $324,756 51 $71,310 9 $283,571 APPLICATIONS WITHDRAWN 7 $385,769 37 $369,479 133 $313,803 10 $38,820 4 $259,560 FILES CLOSED FOR INCOMPLETENESS 1 $453,320 11 $365,677 30 $282,822 4 $136,388 0 $0
Aggregated Statistics For Year 2007(Based on 6 full and 6 partial tracts) A) FHA, FSA/RHS & VA B) Conventional C) Refinancings D) Home Improvement Loans E) Loans on Dwellings For 5+ Families F) Non-occupant Loans on Number Average Value Number Average Value Number Average Value Number Average Value Number Average Value Number Average Value
LOANS ORIGINATED 0 $0 401 $309,874 529 $267,037 122 $137,242 2 $581,800 39 $322,190 APPLICATIONS APPROVED, NOT ACCEPTED 0 $0 106 $261,989 95 $267,770 58 $111,542 0 $0 4 $416,470 APPLICATIONS DENIED 4 $235,305 127 $314,060 313 $390,323 70 $124,594 0 $0 11 $348,977 APPLICATIONS WITHDRAWN 0 $0 53 $327,036 159 $318,868 26 $163,605 0 $0 10 $312,907 FILES CLOSED FOR INCOMPLETENESS 0 $0 17 $345,447 54 $251,577 16 $124,280 0 $0 0 $0
Aggregated Statistics For Year 2006(Based on 6 full and 6 partial tracts) A) FHA, FSA/RHS & VA B) Conventional C) Refinancings D) Home Improvement Loans F) Non-occupant Loans on G) Loans On Manufactured Number Average Value Number Average Value Number Average Value Number Average Value Number Average Value Number Average Value
LOANS ORIGINATED 2 $304,925 464 $300,498 671 $255,206 172 $100,223 29 $297,822 2 $108,470 APPLICATIONS APPROVED, NOT ACCEPTED 0 $0 66 $294,176 137 $272,888 30 $91,931 5 $431,052 0 $0 APPLICATIONS DENIED 0 $0 108 $316,169 310 $298,292 40 $129,705 24 $295,580 0 $0 APPLICATIONS WITHDRAWN 0 $0 46 $436,972 293 $290,532 23 $92,581 15 $303,657 0 $0 FILES CLOSED FOR INCOMPLETENESS 0 $0 29 $323,594 59 $336,649 10 $149,823 2 $147,170 0 $0
Aggregated Statistics For Year 2005(Based on 6 full and 6 partial tracts) B) Conventional C) Refinancings D) Home Improvement Loans F) Non-occupant Loans on G) Loans On Manufactured Number Average Value Number Average Value Number Average Value Number Average Value Number Average Value
LOANS ORIGINATED 490 $317,385 798 $274,239 120 $89,042 30 $271,053 0 $0 APPLICATIONS APPROVED, NOT ACCEPTED 77 $336,621 132 $229,899 45 $93,732 14 $240,759 0 $0 APPLICATIONS DENIED 87 $316,242 303 $280,350 87 $113,555 14 $267,254 6 $79,735 APPLICATIONS WITHDRAWN 75 $321,897 375 $262,574 29 $103,889 19 $345,757 0 $0 FILES CLOSED FOR INCOMPLETENESS 35 $294,326 160 $281,587 16 $123,586 0 $0 0 $0
Aggregated Statistics For Year 2004(Based on 6 full and 6 partial tracts) A) FHA, FSA/RHS & VA B) Conventional C) Refinancings D) Home Improvement Loans E) Loans on Dwellings For 5+ Families F) Non-occupant Loans on G) Loans On Manufactured Number Average Value Number Average Value Number Average Value Number Average Value Number Average Value Number Average Value Number Average Value
LOANS ORIGINATED 4 $226,502 494 $279,207 886 $234,905 141 $96,967 2 $1,035,405 49 $252,816 2 $48,710 APPLICATIONS APPROVED, NOT ACCEPTED 0 $0 94 $296,499 182 $237,156 37 $101,850 0 $0 10 $296,795 0 $0 APPLICATIONS DENIED 0 $0 83 $305,077 278 $262,822 83 $98,872 0 $0 18 $289,524 2 $24,440 APPLICATIONS WITHDRAWN 0 $0 65 $270,012 317 $242,935 34 $150,709 0 $0 12 $303,343 2 $68,985 FILES CLOSED FOR INCOMPLETENESS 0 $0 34 $261,810 139 $233,688 6 $171,402 0 $0 4 $297,755 0 $0
Aggregated Statistics For Year 2003(Based on 6 full and 6 partial tracts) A) FHA, FSA/RHS & VA B) Conventional C) Refinancings D) Home Improvement Loans E) Loans on Dwellings For 5+ Families F) Non-occupant Loans on Number Average Value Number Average Value Number Average Value Number Average Value Number Average Value Number Average Value
LOANS ORIGINATED 17 $224,659 462 $259,989 2,204 $197,239 98 $58,607 4 $270,192 33 $199,063 APPLICATIONS APPROVED, NOT ACCEPTED 0 $0 53 $278,149 360 $181,839 24 $43,751 0 $0 4 $292,635 APPLICATIONS DENIED 1 $328,560 60 $294,645 473 $215,732 57 $56,262 0 $0 12 $184,228 APPLICATIONS WITHDRAWN 4 $233,020 37 $251,009 478 $207,328 24 $50,167 2 $1,035,405 11 $187,534 FILES CLOSED FOR INCOMPLETENESS 0 $0 12 $253,510 74 $204,884 4 $81,560 0 $0 4 $212,158
Aggregated Statistics For Year 2002(Based on 6 full and 6 partial tracts) A) FHA, FSA/RHS & VA B) Conventional C) Refinancings D) Home Improvement Loans F) Non-occupant Loans on Number Average Value Number Average Value Number Average Value Number Average Value Number Average Value
LOANS ORIGINATED 8 $223,199 450 $236,739 1,472 $178,962 131 $65,237 23 $162,340 APPLICATIONS APPROVED, NOT ACCEPTED 0 $0 57 $222,312 269 $163,942 34 $58,668 9 $178,230 APPLICATIONS DENIED 2 $128,595 45 $241,242 251 $180,875 66 $65,263 4 $131,685 APPLICATIONS WITHDRAWN 0 $0 44 $272,393 325 $184,213 61 $51,708 13 $158,971 FILES CLOSED FOR INCOMPLETENESS 0 $0 22 $283,080 140 $193,088 7 $87,183 5 $166,300
Aggregated Statistics For Year 2001(Based on 6 full and 6 partial tracts) A) FHA, FSA/RHS & VA B) Conventional C) Refinancings D) Home Improvement Loans F) Non-occupant Loans on Number Average Value Number Average Value Number Average Value Number Average Value Number Average Value
LOANS ORIGINATED 10 $219,482 461 $204,597 1,039 $164,290 152 $60,988 23 $163,463 APPLICATIONS APPROVED, NOT ACCEPTED 0 $0 58 $183,554 187 $126,073 61 $68,666 4 $109,950 APPLICATIONS DENIED 2 $237,650 45 $215,286 265 $149,387 61 $63,441 4 $173,895 APPLICATIONS WITHDRAWN 4 $216,370 38 $214,768 245 $148,266 42 $54,864 2 $252,320 FILES CLOSED FOR INCOMPLETENESS 0 $0 8 $210,556 51 $146,274 7 $50,673 0 $0
Aggregated Statistics For Year 2000(Based on 6 full and 6 partial tracts) A) FHA, FSA/RHS & VA B) Conventional C) Refinancings D) Home Improvement Loans F) Non-occupant Loans on Number Average Value Number Average Value Number Average Value Number Average Value Number Average Value
LOANS ORIGINATED 16 $182,327 391 $181,616 287 $111,111 125 $37,429 26 $154,095 APPLICATIONS APPROVED, NOT ACCEPTED 0 $0 36 $226,313 57 $109,531 61 $34,179 2 $30,570 APPLICATIONS DENIED 2 $210,040 65 $207,522 172 $113,148 62 $36,433 6 $102,162 APPLICATIONS WITHDRAWN 4 $109,598 34 $192,945 190 $94,779 32 $57,187 2 $64,095 FILES CLOSED FOR INCOMPLETENESS 0 $0 8 $172,920 40 $151,148 14 $42,725 0 $0
Aggregated Statistics For Year 1999(Based on 1 full and 7 partial tracts) A) FHA, FSA/RHS & VA B) Conventional C) Refinancings D) Home Improvement Loans F) Non-occupant Loans on Number Average Value Number Average Value Number Average Value Number Average Value Number Average Value
LOANS ORIGINATED 5 $173,038 227 $171,280 312 $127,782 68 $34,688 5 $85,914 APPLICATIONS APPROVED, NOT ACCEPTED 0 $0 23 $157,347 89 $138,592 13 $33,819 2 $101,850 APPLICATIONS DENIED 0 $0 27 $169,311 102 $128,091 36 $41,937 6 $161,812 APPLICATIONS WITHDRAWN 2 $138,120 17 $163,299 111 $104,716 29 $81,708 1 $99,590 FILES CLOSED FOR INCOMPLETENESS 1 $160,830 8 $204,024 24 $140,066 1 $21,390 1 $103,850
Private Mortgage Insurance Companies Aggregated Statistics For Year 2009(Based on 6 full and 6 partial tracts) A) Conventional B) Refinancings Number Average Value Number Average Value
LOANS ORIGINATED 55 $343,491 25 $380,216 APPLICATIONS APPROVED, NOT ACCEPTED 6 $341,142 12 $362,324 APPLICATIONS DENIED 2 $666,755 16 $362,278 APPLICATIONS WITHDRAWN 10 $428,755 10 $395,482 FILES CLOSED FOR INCOMPLETENESS 4 $340,945 0 $0
Aggregated Statistics For Year 2008(Based on 6 full and 6 partial tracts) A) Conventional B) Refinancings Number Average Value Number Average Value
LOANS ORIGINATED 74 $356,102 7 $423,647 APPLICATIONS APPROVED, NOT ACCEPTED 42 $382,223 4 $451,018 APPLICATIONS DENIED 3 $314,013 2 $396,425 APPLICATIONS WITHDRAWN 4 $358,115 0 $0 FILES CLOSED FOR INCOMPLETENESS 2 $411,205 0 $0
Aggregated Statistics For Year 2007(Based on 6 full and 6 partial tracts) A) Conventional B) Refinancings C) Non-occupant Loans on Number Average Value Number Average Value Number Average Value
LOANS ORIGINATED 47 $410,121 10 $417,372 0 $0 APPLICATIONS APPROVED, NOT ACCEPTED 12 $412,348 3 $567,867 2 $539,705 APPLICATIONS DENIED 0 $0 0 $0 0 $0 APPLICATIONS WITHDRAWN 4 $389,822 0 $0 0 $0 FILES CLOSED FOR INCOMPLETENESS 0 $0 0 $0 0 $0
Aggregated Statistics For Year 2006(Based on 6 full and 6 partial tracts) A) Conventional B) Refinancings C) Non-occupant Loans on Number Average Value Number Average Value Number Average Value
LOANS ORIGINATED 12 $397,202 11 $435,578 2 $368,250 APPLICATIONS APPROVED, NOT ACCEPTED 3 $414,610 2 $546,525 2 $371,170 APPLICATIONS DENIED 0 $0 0 $0 0 $0 APPLICATIONS WITHDRAWN 0 $0 1 $496,550 0 $0 FILES CLOSED FOR INCOMPLETENESS 1 $501,490 0 $0 0 $0
Aggregated Statistics For Year 2005(Based on 6 full and 6 partial tracts) A) Conventional B) Refinancings Number Average Value Number Average Value
LOANS ORIGINATED 15 $353,613 5 $407,966 APPLICATIONS APPROVED, NOT ACCEPTED 6 $392,390 0 $0 APPLICATIONS DENIED 0 $0 0 $0 APPLICATIONS WITHDRAWN 0 $0 1 $469,380 FILES CLOSED FOR INCOMPLETENESS 0 $0 0 $0
Aggregated Statistics For Year 2004(Based on 6 full and 6 partial tracts) A) Conventional B) Refinancings C) Non-occupant Loans on Number Average Value Number Average Value Number Average Value
LOANS ORIGINATED 36 $327,428 10 $338,517 2 $298,105 APPLICATIONS APPROVED, NOT ACCEPTED 11 $336,902 3 $390,103 2 $266,930 APPLICATIONS DENIED 0 $0 2 $274,100 0 $0 APPLICATIONS WITHDRAWN 2 $278,515 2 $282,520 0 $0 FILES CLOSED FOR INCOMPLETENESS 0 $0 0 $0 0 $0
Aggregated Statistics For Year 2003(Based on 6 full and 6 partial tracts) A) Conventional B) Refinancings C) Non-occupant Loans on Number Average Value Number Average Value Number Average Value
LOANS ORIGINATED 59 $294,432 26 $279,392 0 $0 APPLICATIONS APPROVED, NOT ACCEPTED 23 $303,249 11 $279,398 0 $0 APPLICATIONS DENIED 5 $273,644 0 $0 2 $361,430 APPLICATIONS WITHDRAWN 11 $314,366 2 $289,735 0 $0 FILES CLOSED FOR INCOMPLETENESS 0 $0 0 $0 0 $0
Aggregated Statistics For Year 2002(Based on 6 full and 6 partial tracts) A) Conventional B) Refinancings C) Non-occupant Loans on Number Average Value Number Average Value Number Average Value
LOANS ORIGINATED 68 $266,322 21 $251,546 2 $203,610 APPLICATIONS APPROVED, NOT ACCEPTED 30 $280,636 15 $223,649 0 $0 APPLICATIONS DENIED 4 $138,285 0 $0 2 $42,865 APPLICATIONS WITHDRAWN 5 $267,924 2 $229,950 0 $0 FILES CLOSED FOR INCOMPLETENESS 0 $0 0 $0 0 $0
Aggregated Statistics For Year 2001(Based on 6 full and 6 partial tracts) A) Conventional B) Refinancings C) Non-occupant Loans on Number Average Value Number Average Value Number Average Value
LOANS ORIGINATED 86 $231,530 25 $233,988 2 $158,795 APPLICATIONS APPROVED, NOT ACCEPTED 41 $246,312 7 $245,363 4 $195,815 APPLICATIONS DENIED 4 $251,532 0 $0 0 $0 APPLICATIONS WITHDRAWN 0 $0 0 $0 0 $0 FILES CLOSED FOR INCOMPLETENESS 4 $103,540 0 $0 0 $0
Aggregated Statistics For Year 2000(Based on 6 full and 6 partial tracts) A) Conventional B) Refinancings C) Non-occupant Loans on Number Average Value Number Average Value Number Average Value
LOANS ORIGINATED 114 $206,648 6 $244,178 3 $289,503 APPLICATIONS APPROVED, NOT ACCEPTED 19 $205,546 10 $204,679 0 $0 APPLICATIONS DENIED 1 $334,740 0 $0 0 $0 APPLICATIONS WITHDRAWN 2 $179,470 0 $0 2 $179,470 FILES CLOSED FOR INCOMPLETENESS 0 $0 0 $0 0 $0
Aggregated Statistics For Year 1999(Based on 1 full and 7 partial tracts) A) Conventional B) Refinancings Number Average Value Number Average Value
LOANS ORIGINATED 70 $191,472 7 $161,351 APPLICATIONS APPROVED, NOT ACCEPTED 7 $197,054 3 $203,717 APPLICATIONS DENIED 3 $192,860 1 $289,490 APPLICATIONS WITHDRAWN 1 $141,530 0 $0 FILES CLOSED FOR INCOMPLETENESS 0 $0 1 $125,900
2002 - 2018 National Fire Incident Reporting System (NFIRS) incidents See full 2006 National Fire Incident Reporting System statistics for zip code 11783, New York
Most common first names in zip code 11783 among deceased individuals Name Count Lived (average)
John 237 73.0 years Mary 175 79.9 years Joseph 155 72.4 years William 143 73.2 years Anna 104 83.3 years Frank 98 73.5 years Charles 90 73.3 years Margaret 89 77.0 years George 84 72.8 years James 83 72.3 years
Most common last names in zip code 11783 among deceased individuals Last name Count Lived (average)
Meyer 22 73.0 years Miller 20 72.4 years Smith 20 76.9 years Kelly 19 75.1 years Ryan 19 70.1 years Weber 14 77.1 years Sullivan 13 73.4 years Obrien 12 73.9 years Johnson 11 72.6 years Murphy 11 72.3 years
Businesses in zip code 11783
Name Count Name Count
7-Eleven 3 Nissan 1 Baskin-Robbins 1 Pathmark 1 Blockbuster 1 Rite Aid 1 Burger King 1 Taco Bell 1 CVS 1 U-Haul 1 Dunkin Donuts 2 UPS 1 FedEx 1 Wendy's 1 H&R Block 1


 Nearest zip codes: 11758, 11793, 11762, 11710, 11756, 11714.
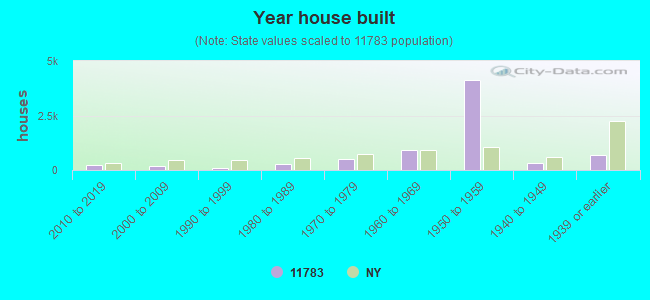
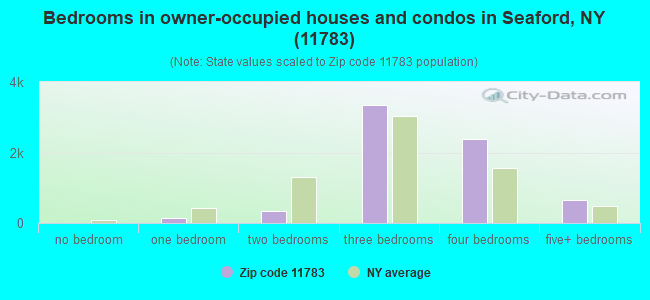
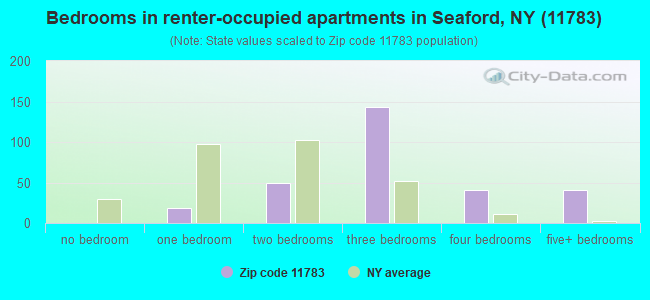
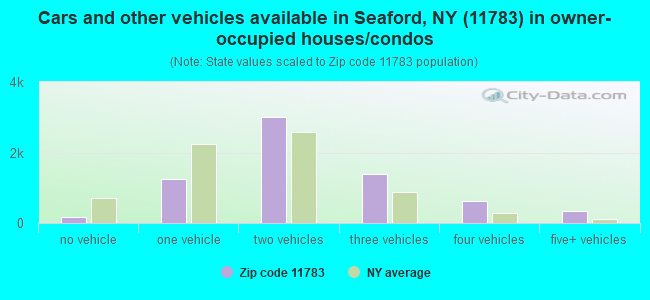
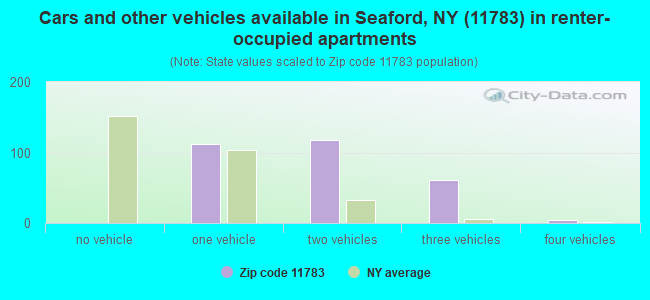


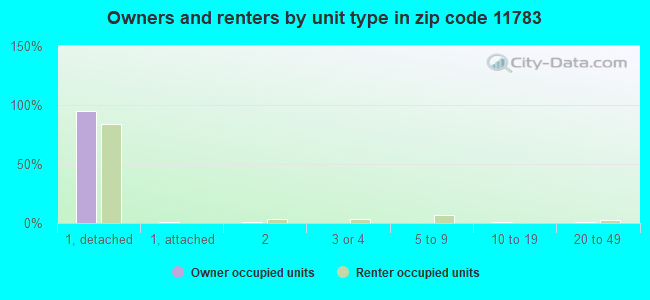
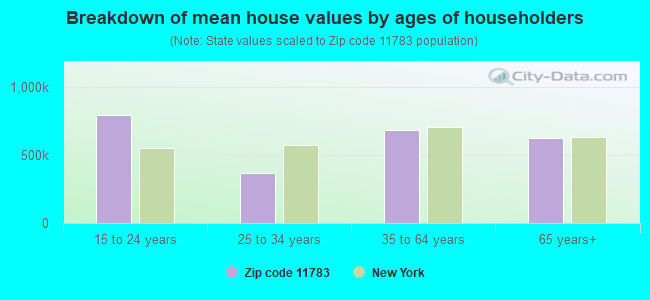


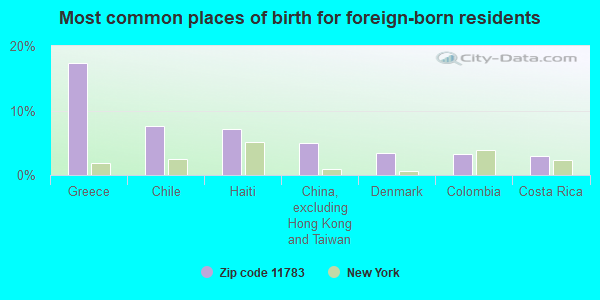
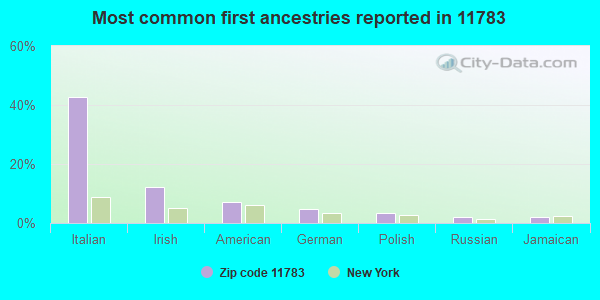
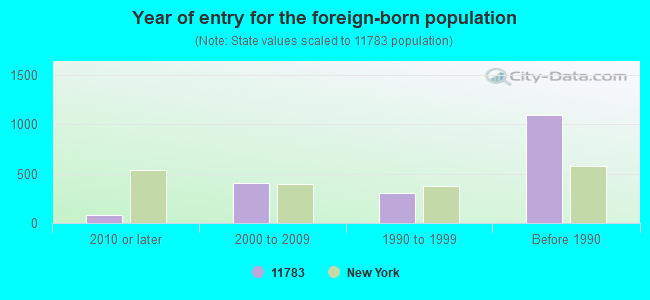

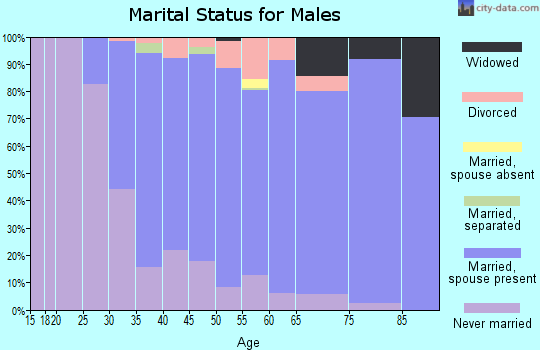
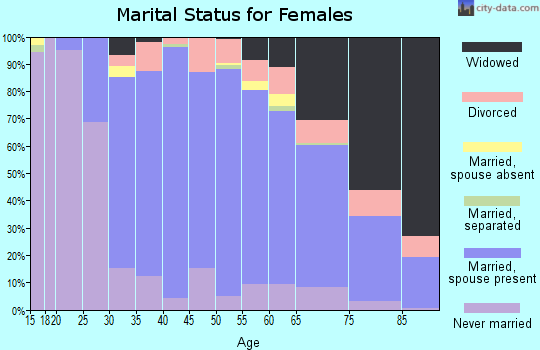
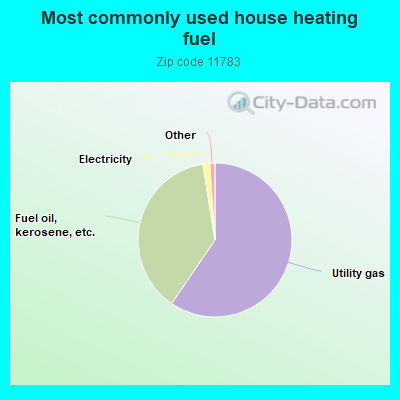
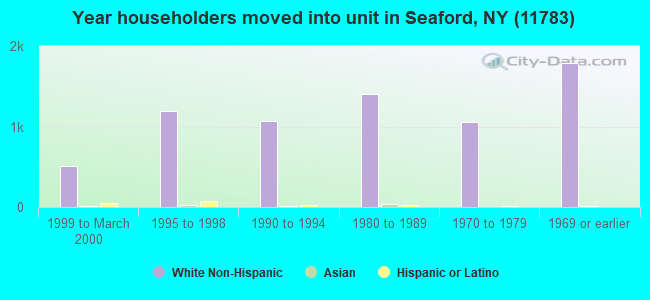
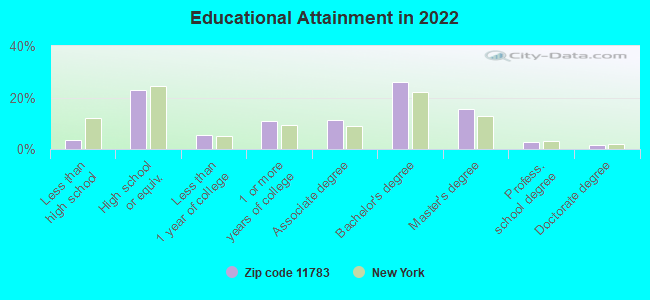
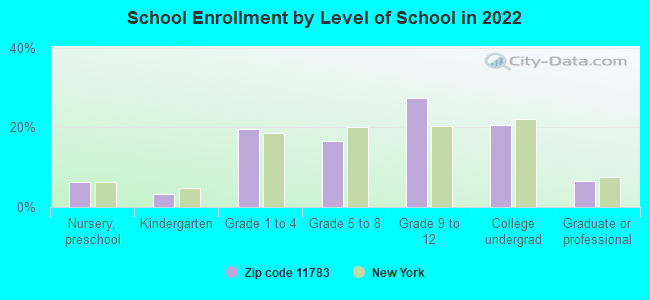
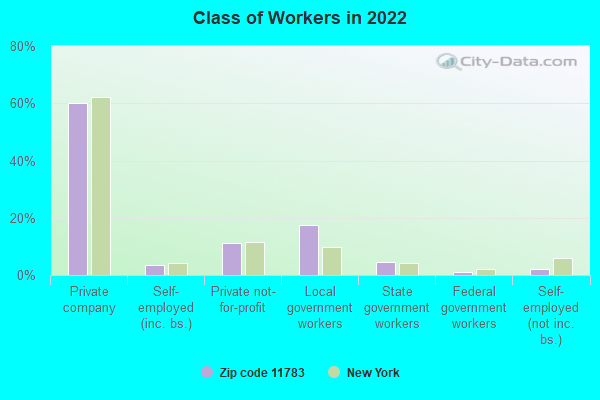
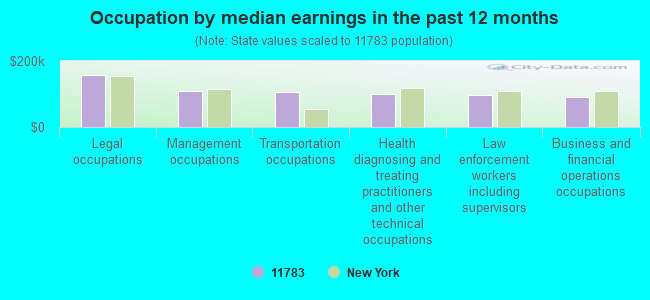
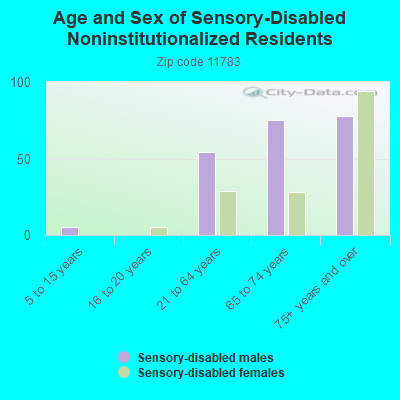
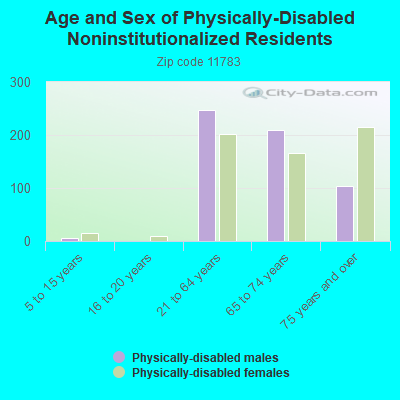
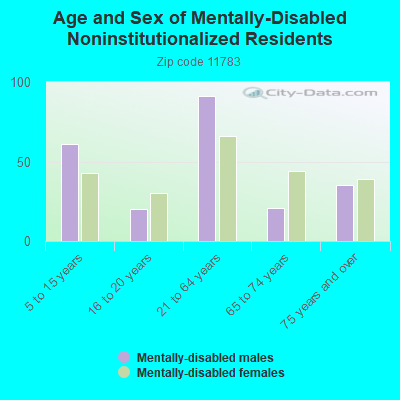
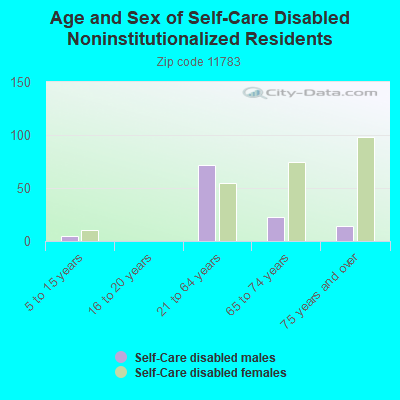
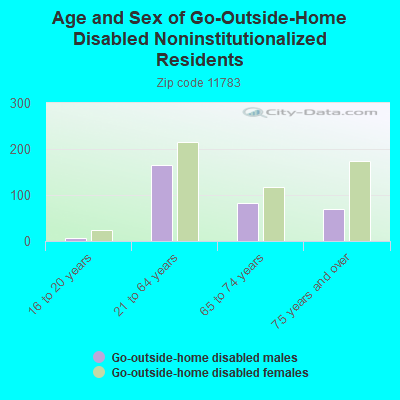
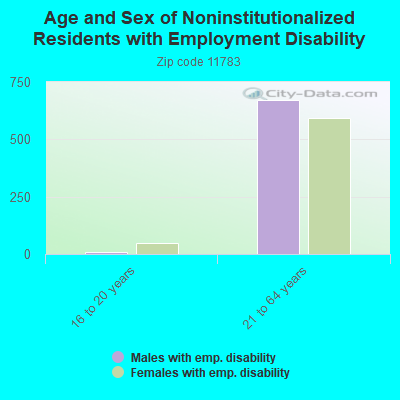
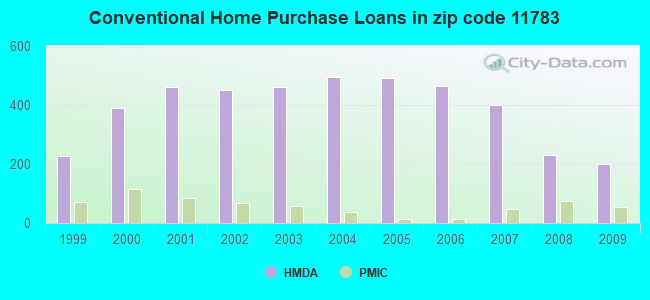
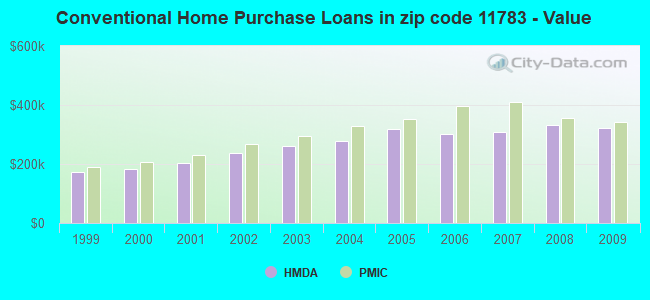
 Based on the data from the years 2002 - 2018 the average number of fire incidents per year is 6. The highest number of reported fire incidents - 55 took place in 2002, and the least - 0 in 2004. The data has a decreasing trend.
 When looking into fire subcategories, the most reports belonged to: Outside Fires (56.0%), and Structure Fires (34.9%).