Estimated zip code population in 2022: 53,341 Zip code population in 2010: 53,804 Zip code population in 2000: 54,933
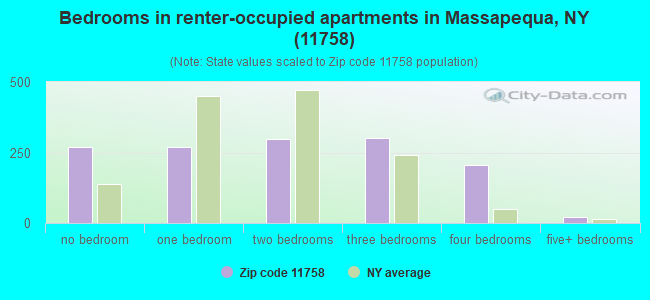
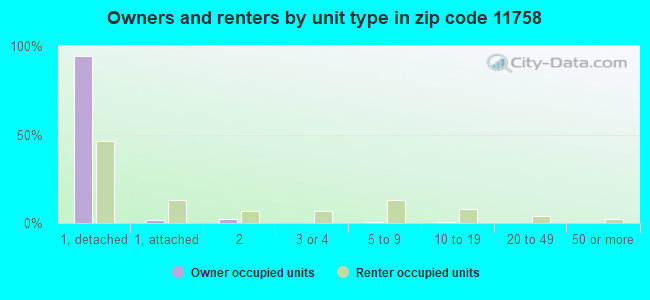
Houses and condos: 19,715 Renter-occupied apartments: 1,347
% of renters here:
7%
State:
46%
March 2022 cost of living index in zip code 11758: 149.5 (very high, U.S. average is 100)
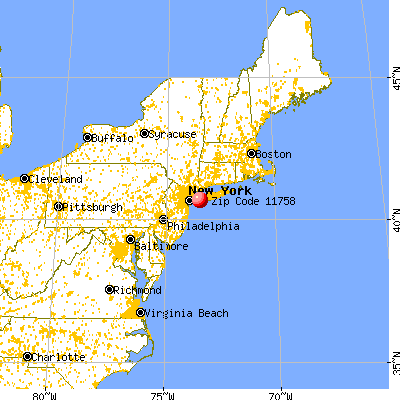
Land area: 11.0 sq. mi. Water area: 0.6 sq. mi.
Population density: 4,845 people per square mile
(average).
OSM Map
General Map
Google Map
MSN Map
OSM Map
General Map
Google Map
MSN Map
OSM Map
General Map
Google Map
MSN Map
OSM Map
General Map
Google Map
MSN Map
Please wait while loading the map...
Real estate property taxes paid for housing units in 2022:
This zip code:
1.6% ($9,805)
New York:
1.5% ($6,180)
Median real estate property taxes paid for housing units with mortgages in 2022: $9,858 (1.5%) Median real estate property taxes paid for housing units with no mortgage in 2022: $9,755 (1.7%)
Estimated median house/condo value in 2022: $625,879
11758:
$625,879
New York:
$400,400
According to our research of New York and other state lists, there were 9 registered sex offenders living in 11758 zip code as of April 27, 2024. The ratio of all residents to sex offenders in zip code 11758 is 6,191 to 1. The ratio of registered sex offenders to all residents in this zip code is much lower than the state average.
Median resident age:
This zip code:
46.2 years
New York median age:
40.0 years
Average household size:
This zip code:
2.7 people
New York:
2.5 people
Averages for the 2020 tax year for zip code 11758, filed in 2021:
Average Adjusted Gross Income (AGI) in 2020: $111,873 (Individual Income Tax Returns)
Here:
$111,873
State:
$90,930
Salary/wage: $93,336 (reported on 81.1% of returns)
Here:
$93,336
State:
$72,104
(% of AGI for various income ranges: 1134.2% for AGIs below $25k, 3626.5% for AGIs $25k-50k, 6467.9% for AGIs $50k-75k, 9299.1% for AGIs $75k-100k, 18088.8% for AGIs $100k-200k, 67661.6% for AGIs over 200k)
Taxable interest for individuals: $1,791 (reported on 55.7% of returns)
This zip code:
$1,791
New York:
$3,075
(% of AGI for various income ranges: 43.1% for AGIs below $25k, 58.1% for AGIs $25k-50k, 89.1% for AGIs $50k-75k, 130.7% for AGIs $75k-100k, 184.4% for AGIs $100k-200k, 920.9% for AGIs over 200k)
Ordinary dividends: $5,075 (reported on 34.6% of returns)
Here:
$5,075
State:
$11,095
(% of AGI for various income ranges: 60.9% for AGIs below $25k, 88.0% for AGIs $25k-50k, 138.1% for AGIs $50k-75k, 221.7% for AGIs $75k-100k, 324.1% for AGIs $100k-200k, 1739.5% for AGIs over 200k)
Net capital gain/loss in AGI: +$15,625 (reported on 30.5% of returns)
Here:
+$15,625
State:
+$44,925
(% of AGI for various income ranges: 22.7% for AGIs below $25k, 58.5% for AGIs $25k-50k, 106.8% for AGIs $50k-75k, 195.2% for AGIs $75k-100k, 441.8% for AGIs $100k-200k, 7750.6% for AGIs over 200k)
Profit/loss from business: +$17,381 (reported on 13.1% of returns)
Here:
+$17,381
State:
+$14,940
(% of AGI for various income ranges: 108.5% for AGIs below $25k, 144.9% for AGIs $25k-50k, 112.3% for AGIs $50k-75k, 189.8% for AGIs $75k-100k, 355.5% for AGIs $100k-200k, 2535.9% for AGIs over 200k)
Taxable individual retirement arrangement distribution: $18,814 (reported on 11.5% of returns)
11758:
$18,814
New York:
$19,609
(% of AGI for various income ranges: 82.3% for AGIs below $25k, 153.4% for AGIs $25k-50k, 268.2% for AGIs $50k-75k, 384.5% for AGIs $75k-100k, 600.0% for AGIs $100k-200k, 1155.3% for AGIs over 200k)
Self-employed (Keogh) retirement plans: $26,619 (reported on 0.9% of returns)
11758:
$26,619
New York:
$32,497
(% of AGI for various income ranges: 5.9% for AGIs $25k-50k, 33.6% for AGIs $100k-200k, 363.4% for AGIs over 200k)
Total itemized deductions: $29,020 (reported on 21.7% of returns)
Here:
$29,020
State:
$39,326
(% of AGI for various income ranges: 174.4% for AGIs below $25k, 327.3% for AGIs $25k-50k, 652.2% for AGIs $50k-75k, 962.8% for AGIs $75k-100k, 1616.4% for AGIs $100k-200k, 4607.0% for AGIs over 200k)
Charity contributions: $4,315 (reported on 19.7% of returns)
Here:
$4,315
State:
$15,420
(% of AGI for various income ranges: 8.4% for AGIs below $25k, 25.3% for AGIs $25k-50k, 61.1% for AGIs $50k-75k, 102.0% for AGIs $75k-100k, 194.8% for AGIs $100k-200k, 852.9% for AGIs over 200k)
Taxes paid: $9,561 (reported on 21.7% of returns)
11758:
$9,561
State:
$9,183
(% of AGI for various income ranges: 60.8% for AGIs below $25k, 125.0% for AGIs $25k-50k, 233.8% for AGIs $50k-75k, 360.5% for AGIs $75k-100k, 573.8% for AGIs $100k-200k, 1251.0% for AGIs over 200k)
Earned income credit: $1,616 (reported on 5.1% of returns)
Here:
$1,616
State:
$2,138
(% of AGI for various income ranges: 37.0% for AGIs below $25k, 31.1% for AGIs $25k-50k)
Percentage of individuals using paid preparers for their 2020 taxes: 95.5%
Here:
96%
State:
95%
(% for various income ranges: 94.1% for AGIs below $25k, 95.5% for AGIs $25k-50k, 96.3% for AGIs $50k-75k, 95.9% for AGIs $75k-100k, 95.9% for AGIs $100k-200k, 96.4% for AGIs over 200k)
Averages for the 2012 tax year for zip code 11758, filed in 2013:
Average Adjusted Gross Income (AGI) in 2012: $88,150 (Individual Income Tax Returns)
Here:
$88,150
State:
$77,088
Salary/wage: $77,399 (reported on 82.3% of returns)
Here:
$77,399
State:
$60,593
(% of AGI for various income ranges: 67.0% for AGIs below $25k, 73.0% for AGIs $25k-50k, 70.1% for AGIs $50k-75k, 70.4% for AGIs $75k-100k, 78.3% for AGIs $100k-200k, 67.7% for AGIs over 200k)
Taxable interest for individuals: $1,414 (reported on 58.9% of returns)
This zip code:
$1,414
New York:
$3,125
(% of AGI for various income ranges: 2.6% for AGIs below $25k, 1.3% for AGIs $25k-50k, 1.1% for AGIs $50k-75k, 1.0% for AGIs $75k-100k, 0.7% for AGIs $100k-200k, 0.9% for AGIs over 200k)
Ordinary dividends: $3,889 (reported on 34.3% of returns)
Here:
$3,889
State:
$10,299
(% of AGI for various income ranges: 3.1% for AGIs below $25k, 1.7% for AGIs $25k-50k, 1.5% for AGIs $50k-75k, 1.5% for AGIs $75k-100k, 1.1% for AGIs $100k-200k, 1.7% for AGIs over 200k)
Net capital gain/loss in AGI: +$8,530 (reported on 26.6% of returns)
Here:
+$8,530
State:
+$42,474
(% of AGI for various income ranges: 0.3% for AGIs $50k-75k, 0.2% for AGIs $75k-100k, 0.4% for AGIs $100k-200k, 7.1% for AGIs over 200k)
Profit/loss from business: +$17,699 (reported on 12.5% of returns)
Here:
+$17,699
State:
+$16,168
(% of AGI for various income ranges: 6.7% for AGIs below $25k, 3.1% for AGIs $25k-50k, 2.4% for AGIs $50k-75k, 1.5% for AGIs $75k-100k, 2.0% for AGIs $100k-200k, 2.8% for AGIs over 200k)
Taxable individual retirement arrangement distribution: $14,625 (reported on 14.1% of returns)
11758:
$14,625
New York:
$17,621
(% of AGI for various income ranges: 4.8% for AGIs below $25k, 4.0% for AGIs $25k-50k, 3.5% for AGIs $50k-75k, 3.3% for AGIs $75k-100k, 2.3% for AGIs $100k-200k, 1.2% for AGIs over 200k)
Self-employment retirement plans: $23,938 (reported on 0.9% of returns)
11758:
$23,938
New York:
$27,330
(% of AGI for various income ranges: 0.2% for AGIs below $25k, 0.1% for AGIs $50k-75k, 0.1% for AGIs $100k-200k, 0.5% for AGIs over 200k)
Total itemized deductions: $36,476 (28% of AGI, reported on 57.3% of returns)
Here:
$36,476
State:
$34,985
Here:
27.5% of AGI
State:
21.3% of AGI
(% of AGI for various income ranges: 25.8% for AGIs below $25k, 22.5% for AGIs $25k-50k, 24.2% for AGIs $50k-75k, 27.3% for AGIs $75k-100k, 26.2% for AGIs $100k-200k, 19.9% for AGIs over 200k)
Charity contributions: $2,599 (reported on 52.9% of returns)
Here:
$2,599
State:
$5,572
(% of AGI for various income ranges: 1.2% for AGIs below $25k, 1.4% for AGIs $25k-50k, 1.7% for AGIs $50k-75k, 1.8% for AGIs $75k-100k, 1.6% for AGIs $100k-200k, 1.4% for AGIs over 200k)
Taxes paid: $17,100 (reported on 57.2% of returns)
11758:
$17,100
State:
$18,656
(% of AGI for various income ranges: 10.4% for AGIs below $25k, 9.2% for AGIs $25k-50k, 10.4% for AGIs $50k-75k, 11.6% for AGIs $75k-100k, 12.0% for AGIs $100k-200k, 10.7% for AGIs over 200k)
Earned income credit: $1,740 (reported on 6.2% of returns)
Here:
$1,740
State:
$2,230
(% of AGI for various income ranges: 2.6% for AGIs below $25k, 0.4% for AGIs $25k-50k)
Percentage of individuals using paid preparers for their 2012 taxes: 73.3%
Here:
73%
State:
66%
(% for various income ranges: 65.8% for AGIs below $25k, 69.7% for AGIs $25k-50k, 74.3% for AGIs $50k-75k, 79.1% for AGIs $75k-100k, 79.8% for AGIs $100k-200k, 80.1% for AGIs over 200k)
Averages for the 2004 tax year for zip code 11758, filed in 2005:
Average Adjusted Gross Income (AGI) in 2004: $70,862 (Individual Income Tax Returns)
Here:
$70,862
State:
$59,519
Salary/wage: $64,679 (reported on 82.0% of returns)
Here:
$64,679
State:
$50,673
(% of AGI for various income ranges: 121.1% for AGIs below $10k, 64.5% for AGIs $10k-25k, 75.3% for AGIs $25k-50k, 75.8% for AGIs $50k-75k, 79.8% for AGIs $75k-100k, 73.5% for AGIs over 100k)
Taxable interest for individuals: $1,580 (reported on 71.7% of returns)
This zip code:
$1,580
New York:
$2,377
(% of AGI for various income ranges: 14.4% for AGIs below $10k, 4.1% for AGIs $10k-25k, 2.2% for AGIs $25k-50k, 1.8% for AGIs $50k-75k, 1.2% for AGIs $75k-100k, 1.2% for AGIs over 100k)
Taxable dividends: $2,220 (reported on 40.6% of returns)
Here:
$2,220
State:
$5,394
(% of AGI for various income ranges: 9.5% for AGIs below $10k, 2.6% for AGIs $10k-25k, 1.3% for AGIs $25k-50k, 1.2% for AGIs $50k-75k, 1.0% for AGIs $75k-100k, 1.2% for AGIs over 100k)
Net capital gain/loss: +$9,222 (reported on 32.5% of returns)
Here:
+$9,222
State:
+$23,581
(% of AGI for various income ranges: -8.2% for AGIs below $10k, -0.1% for AGIs $10k-25k, 0.1% for AGIs $25k-50k, 0.1% for AGIs $50k-75k, 0.4% for AGIs $75k-100k, 7.3% for AGIs over 100k)
Profit/loss from business: +$15,540 (reported on 12.3% of returns)
Here:
+$15,540
State:
+$13,809
(% of AGI for various income ranges: 9.1% for AGIs below $10k, 5.1% for AGIs $10k-25k, 3.5% for AGIs $25k-50k, 2.4% for AGIs $50k-75k, 2.2% for AGIs $75k-100k, 2.5% for AGIs over 100k)
IRA payment deduction: $3,512 (reported on 4.2% of returns)
11758:
$3,512
New York:
$3,115
(% of AGI for various income ranges: 0.2% for AGIs below $10k, 0.3% for AGIs $10k-25k, 0.4% for AGIs $25k-50k, 0.3% for AGIs $50k-75k, 0.2% for AGIs $75k-100k, 0.1% for AGIs over 100k)
Self-employed pension: $14,632 (reported on 1.3% of returns)
Here:
$14,632
New York:
$19,016
(% of AGI for various income ranges: 0.1% for AGIs $10k-25k, 0.1% for AGIs $25k-50k, 0.1% for AGIs $50k-75k, 0.1% for AGIs $75k-100k, 0.4% for AGIs over 100k)
Total itemized deductions: $24,908 (24% of AGI, reported on 59.0% of returns)
Here:
$24,908
State:
$25,864
Here:
23.9% of AGI
State:
21.9% of AGI
(% of AGI for various income ranges: 32.7% for AGIs below $10k, 24.3% for AGIs $10k-25k, 22.0% for AGIs $25k-50k, 24.3% for AGIs $50k-75k, 25.0% for AGIs $75k-100k, 18.3% for AGIs over 100k)
Charity contributions deductions: $2,782 (3% of AGI, reported on 56.4% of returns)
Here:
$2,782
State:
$4,439
Here:
2.6% of AGI
State:
3.6% of AGI
(% of AGI for various income ranges: 1.5% for AGIs below $10k, 1.9% for AGIs $10k-25k, 2.3% for AGIs $25k-50k, 2.6% for AGIs $50k-75k, 2.6% for AGIs $75k-100k, 2.1% for AGIs over 100k)
Total tax: $11,849 (reported on 81.7% of returns)
11758:
$11,849
State:
$11,730
(% of AGI for various income ranges: 3.5% for AGIs below $10k, 4.2% for AGIs $10k-25k, 7.3% for AGIs $25k-50k, 8.9% for AGIs $50k-75k, 9.3% for AGIs $75k-100k, 17.7% for AGIs over 100k)
Earned income credit: $1,321 (reported on 4.6% of returns)
Here:
$1,321
State:
$1,757
Percentage of individuals using paid preparers for their 2004 taxes: 71.2%
Here:
71%
State:
67%
(% for various income ranges: 62.9% for AGIs below $10k, 65.9% for AGIs $10k-25k, 69.1% for AGIs $25k-50k, 75.1% for AGIs $50k-75k, 77.5% for AGIs $75k-100k, 77.1% for AGIs over 100k)
Likely homosexual households (counted as self-reported same-sex unmarried-partner households)
Lesbian couples: 0.4% of all households
Gay men: 0.1% of all households
Household received Food Stamps/SNAP in the past 12 months: 365 Household did not receive Food Stamps/SNAP in the past 12 months: 18,760
Women who had a birth in the past 12 months: 614 (598 now married, 6 unmarried) Women who did not have a birth in the past 12 months: 10,422 (4,538 now married, 5,847 unmarried)
Housing units in zip code 11758 with a mortgage: 10,874 (1,661 second mortgage, 66 home equity loan, 1,448 both second mortgage and home equity loan) Houses without a mortgage: 376
Median monthly owner costs for units with a mortgage: $3,494 Median monthly owner costs for units without a mortgage: $1,487
Residents with income below the poverty level in 2022:
This zip code:
4.2%
Whole state:
14.3%
Residents with income below 50% of the poverty level in 2022:
This zip code:
1.6%
Whole state:
6.8%
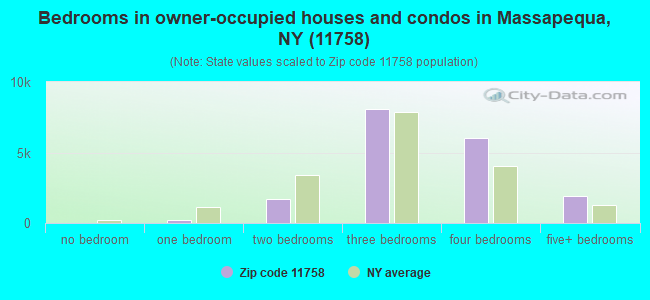
Median number of rooms in houses and condos:
Here:
7.0
State:
6.3
Median number of rooms in apartments:
Here:
4.1
State:
3.8
Notable locations in this zip code not listed on our city pages
Notable locations in zip code 11758: Massapequa Station (A), Plainedge Public Library (B), Central Avenue Branch Massapequa Public Library (C), Hicksville Road Firehouse (D). Display/hide their locations on the map
Churches in zip code 11758 include: Kingdom Hall of Jehovahs Witnesses (A), First Baptist Church (B), Congregation Beth-El (C), Community United Methodist Church (D), Massapequa Reformed Church (E), Powered by Christ Church (F), Saint Rose of Lima Church (G). Display/hide their locations on the map
7,956 married couples with children.
848 single-parent households (165 men, 683 women).
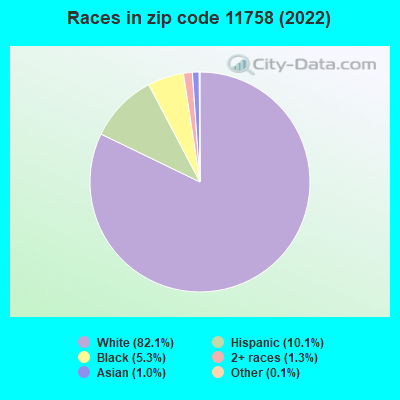
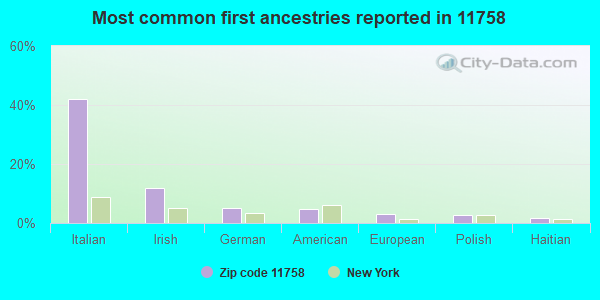
89.5% of residents of 11758 zip code speak English at home.
4.6% of residents speak Spanish at home (73% very well, 20% well, 6% not well).
4.8% of residents speak other Indo-European language at home (77% very well, 11% well, 11% not well, 1% not at all).
0.4% of residents speak Asian or Pacific Island language at home (38% very well, 49% well, 13% not well).
0.7% of residents speak other language at home (84% very well, 16% not well).
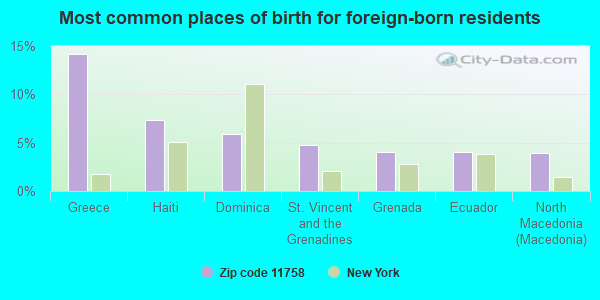
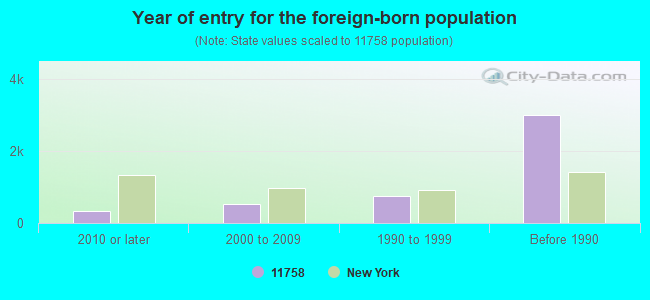
Foreign born population: 4,367 (8.2%) (74.8% of them are naturalized citizens)
Major facilities with environmental interests located in this zip code:
GENT UNIFORM (5680 MERRICK RD in MASSAPEQUA, NY)
AIR MINOR (AIRS/AFS) SUPERFUND (Superfund database) STATE MASTER (New York facility tracking) - AIR PROGRAM, HAZARDOUS WASTE PROGRAM HAZARDOUS WASTE BIENNIAL REPORTER (Resource Conservation and Recovery Act (tracking hazardous waste)) Large Quantity Generators, more that 1000 kg of hazardous waste/month (Resource Conservation and Recovery Act (tracking hazardous waste)) Business SIC classification: DRYCLEANING PLANTS, EXCEPT RUG CLEANING; INDUSTRIAL LAUNDERERS Business NAICS classification: INDUSTRIAL LAUNDERERS. Organizations: GENT UNIFORM RENTAL (LEGALLY RESPONSIBLE PARTY)
Alternative names: GENT CLEANER/RANGER ROVER NY0000007153, GENT UNIFORM CLEANERS, GENT UNIFORM RENTAL, GENT UNIFORM RENTAL CORP NYD044472876 RR, GENT UNIVORM RENTAL, STONE BOULEVARD
HESS #32550 (6201 SUNRISE HIGHWAY in MASSAPEQUA, NY)
STATE MASTER (New York facility tracking) - GROUNDWATER PROGRAM (Resource Conservation and Recovery Act (tracking hazardous waste)) Organizations: HESS CORPORATION, MERIT OIL OF NEW YORK INC (LEGALLY RESPONSIBLE PARTY)
Alternative names: MERIT OIL CORP, MERIT OIL OF NEW YORK INC, MERIT OIL PROPERTY
GETTY STATION (520 HICKSVILLE RD in MASSAPEQUA, NY)
STATE MASTER (New York facility tracking) - GROUNDWATER PROGRAM (Resource Conservation and Recovery Act (tracking hazardous waste)) Organizations: GETTY PETROLEUM MARKETING INC (LEGALLY RESPONSIBLE PARTY)
Alternative names: GETTY SERVICE STATION
ALBANY AVE ES ( in NORTH MASSAPEQUA, NY)
(National Center for Education Statistics) - STATE ID-280522030001 Organizations: FARMINGDALE UFSD (SCHOOL DISTRICT)
BERNER JHS ( in MASSAPEQUA, NY)
(National Center for Education Statistics) - STATE ID-280523030010 Organizations: MASSAPEQUA UFSD (SCHOOL DISTRICT)
GRACE EPISCOPAL CHURCH (23 CEDAR SHORE DRIVE in MASSAPEQUA, NY)
COMPLIANCE ACTIVITY (Tracking inspections of insecticide, fungicide, and rodenticide, and toxic substances) Alternative names: GRACE DAY SCHOOL
CHEVRON USA INC (BROADWAY & HICKSVILLE RD in MASSAPEQUA, NY)
(Resource Conservation and Recovery Act (tracking hazardous waste))
COMMUNITY CLINICAL LAB SVCS (126 HICKSVILLE RD in MASSAPEQUA, NY)
(Resource Conservation and Recovery Act (tracking hazardous waste)) Business NAICS classification: MEDICAL LABORATORIES. Organizations: ZWANGER-PESIRI DRS (CONTACT/OWNER)
AAMCO TRANSMISSION (4202 MERRICK RD in MASSAPEQUA, NY)
(Resource Conservation and Recovery Act (tracking hazardous waste))
ALBANY AVENUE ELEMENTARY SCHL (101 ALBANY AVE in N MASSAPEQUA, NY)
(Resource Conservation and Recovery Act (tracking hazardous waste)) Alternative names: ALBANY AVENUE ELEMENTARY SCHOOL
GENOVESE STORES INC 163 (33-37 HICKSVILLE RD in MASSAPEQUA, NY)
(Resource Conservation and Recovery Act (tracking hazardous waste))
GETTY SERVICE STATION (5200 MERRICK RD in MASSAPEQUA, NY)
(Resource Conservation and Recovery Act (tracking hazardous waste))
IMPERIAL FURNITURE FIN & REF (4181 MERRICK RD in MASSAPEQUA, NY)
(Resource Conservation and Recovery Act (tracking hazardous waste))
Housing units lacking complete plumbing facilities: 0.1% Housing units lacking complete kitchen facilities: 0.7%
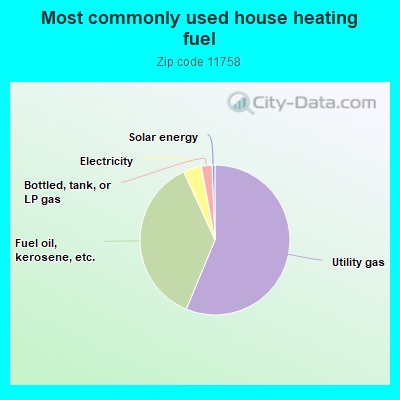
56.0%Utility gas
36.7%Fuel oil, kerosene, etc.
3.9%Electricity
2.3%Bottled, tank, or LP gas
0.6%Solar energy
Population in 1990: 42,863. Population change in the 1990s: +12,070 (+28.2%).
Place of birth for U.S.-born residents:
This state: 45,678
Northeast: 1,093
Midwest: 218
South: 770
West: 621
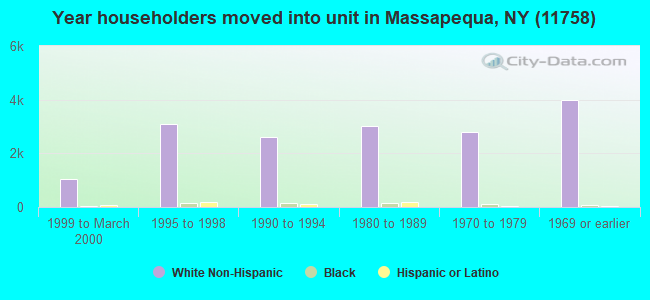
77% of the 11758 zip code residents lived in the same house 5 years ago. Out of people who lived in different houses, 60% lived in this county. Out of people who lived in different counties, 50% lived in New York.
95% of the 11758 zip code residents lived in the same house 1 year ago. Out of people who lived in different houses, 52% moved from this county. Out of people who lived in different houses, 29% moved from different county within same state. Out of people who lived in different houses, 16% moved from different state. Out of people who lived in different houses, 2% moved from abroad.
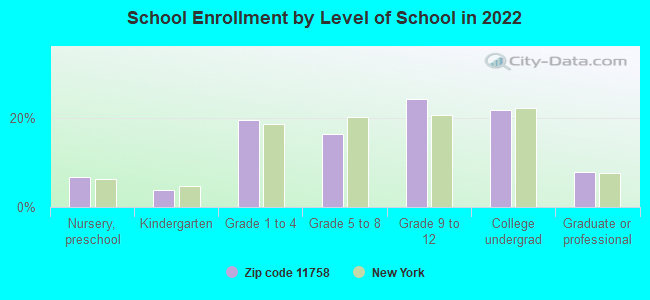
Private vs. public school enrollment:
Students in private schools in grades 1 to 8 (elementary and middle school): 256
Here:
6.4%
New York:
15.6%
Students in private schools in grades 9 to 12 (high school): 330
Here:
12.2%
New York:
15.0%
Students in private undergraduate colleges: 1,336
Here:
54.6%
New York:
39.2%
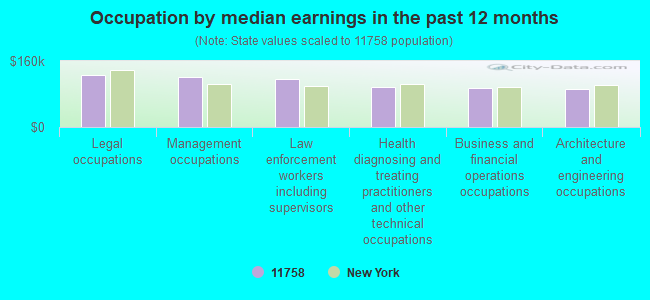
Occupation by median earnings in the past 12 months ($)
125,621Legal occupations
122,153Management occupations
115,808Law enforcement workers including supervisors
95,914Health diagnosing and treating practitioners and other technical occupations
93,536Business and financial operations occupations
92,632Architecture and engineering occupations
Companies with federal contracts located in this zip code:
KEM CONSTRUCTION CORPORATION (687 BROADWAY in MASSAPEQUA, NY; small business) : $4,153,790 in 13 contractsfrom 2000 to 2004
Contracts for Maintenance, Repair or Alteration of Real Property -- Hospitals and Infirmaries, Maintenance, Repair or Alteration of Real Property -- Other Hospital Buildings, Construction of Structures and Facilities -- Other Administrative Facilities and Service Buildings, Maintenance, Repair or Alteration of Real Property -- Other Administrative Facilities and Service Buildings by Department of Veterans Affairs, Army, United States Coast Guard (disused code: now 7008), Maritime Administration, and others Signed by year:2000: $516,000; 2001: $2,092,680; 2002: $360,390; 2003: $942,000; 2004: $242,720; 2005: $0; 2006: $0.
Biggest contracts:
$2,013,000 with Department of Veterans Affairs for Maintenance, Repair or Alteration of Real Property -- Hospitals and Infirmaries. Signed on 2001-09-15. Completion date: 2003-01-15.
$942,000, same as above.Signed on 2003-02-15. Completion date: 2003-09-15.
$493,000 with Department of Veterans Affairs for Maintenance, Repair or Alteration of Real Property -- Other Hospital Buildings. Signed on 2000-09-15. Completion date: 2001-08-15.
$187,320 with Army for Construction of Structures and Facilities -- Other Administrative Facilities and Service Buildings. Signed on 2004-09-20. Completion date: 2004-12-17.
ALL STATE TAPE COMPANY (85 HOLLYWOOD AVE in MASSAPEQUA, NY; small business) : $163,173 in 15 contractsfrom 2004 to 2006
Contracts for Miscellaneous Fabricated Nonmetallic Materials, Miscellaneous Printed Matter, Refrigeration and Air Conditioning Components, Rubber Fabricated Materials, and moreby Defense Logistics Agency Signed by year:2000: $0; 2001: $0; 2002: $0; 2003: $0; 2004: $76,475; 2005: $75,951; 2006: $10,747.
Biggest contracts:
$68,675 with Defense Logistics Agency for Miscellaneous Fabricated Nonmetallic Materials. Taking place in OH. Signed on 2004-08-12. Completion date: 2004-10-18.
$16,750 with Defense Logistics Agency for Miscellaneous Printed Matter. Signed on 2005-01-07. Completion date: 2005-02-22.
$14,319 with Defense Logistics Agency for Refrigeration and Air Conditioning Components. Signed on 2005-10-13. Completion date: 2005-11-28.
$13,990 with Defense Logistics Agency for Rubber Fabricated Materials. Signed on 2005-02-15. Completion date: 2005-03-23.
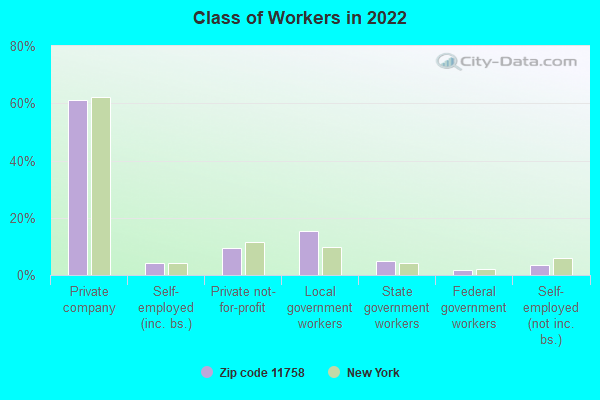
Top industries in this zip code by the number of employees in 2005:
Health Care and Social Assistance: Offices of Physicians (except Mental Health Specialists) (50-99 employees: 3 establishments, 20-49 employees: 8 establishments, 10-19 employees: 17 establishments, 5-9 employees: 15 establishments, 1-4 employees: 25 establishments)
2005 - 2018 National Fire Incident Reporting System (NFIRS) incidents
Based on the data from the years 2005 - 2018 the average number of fire incidents per year is 82. The highest number of reported fire incidents - 188 took place in 2005, and the least - 42 in 2014. The data has a decreasing trend.
When looking into fire subcategories, the most reports belonged to: Outside Fires (48.5%), and Structure Fires (42.5%).
Fire incident types reported to NFIRS in Zip Code 11758


 Nearest zip codes: 11762, 11783, 11701, 11793, 11726, 11735.


 Based on the data from the years 2005 - 2018 the average number of fire incidents per year is 82. The highest number of reported fire incidents - 188 took place in 2005, and the least - 42 in 2014. The data has a decreasing trend.
 When looking into fire subcategories, the most reports belonged to: Outside Fires (48.5%), and Structure Fires (42.5%).