Estimated zip code population in 2022: 31,817 Zip code population in 2010: 27,172 Zip code population in 2000: 22,897
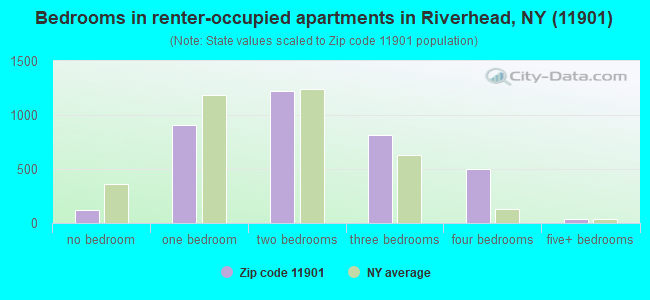
Houses and condos: 13,314 Renter-occupied apartments: 3,629
% of renters here:
31%
State:
46%
March 2022 cost of living index in zip code 11901: 149.8 (very high, U.S. average is 100)
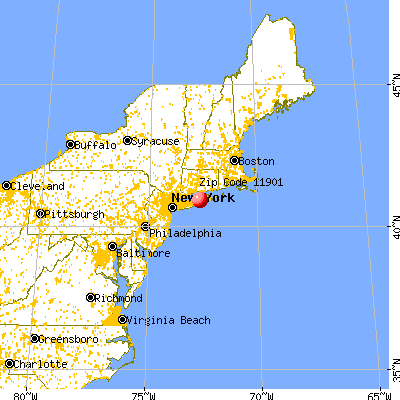
Land area: 55.2 sq. mi. Water area: 5.1 sq. mi.
Population density: 577 people per square mile
(low).
OSM Map
General Map
Google Map
MSN Map
OSM Map
General Map
Google Map
MSN Map
OSM Map
General Map
Google Map
MSN Map
OSM Map
General Map
Google Map
MSN Map
Please wait while loading the map...
Real estate property taxes paid for housing units in 2022:
This zip code:
1.3% ($5,387)
New York:
1.5% ($6,180)
Median real estate property taxes paid for housing units with mortgages in 2022: $6,323 (1.4%) Median real estate property taxes paid for housing units with no mortgage in 2022: $4,589 (1.2%)
Averages for the 2020 tax year for zip code 11901, filed in 2021:
Average Adjusted Gross Income (AGI) in 2020: $59,934 (Individual Income Tax Returns)
Here:
$59,934
State:
$90,930
Salary/wage: $49,840 (reported on 75.1% of returns)
Here:
$49,840
State:
$72,104
(% of AGI for various income ranges: 1361.6% for AGIs below $25k, 3807.4% for AGIs $25k-50k, 6714.7% for AGIs $50k-75k, 9207.7% for AGIs $75k-100k, 16496.6% for AGIs $100k-200k, 71100.7% for AGIs over 200k)
Taxable interest for individuals: $1,770 (reported on 31.8% of returns)
This zip code:
$1,770
New York:
$3,075
(% of AGI for various income ranges: 20.6% for AGIs below $25k, 26.5% for AGIs $25k-50k, 56.0% for AGIs $50k-75k, 111.0% for AGIs $75k-100k, 248.3% for AGIs $100k-200k, 2243.6% for AGIs over 200k)
Ordinary dividends: $6,145 (reported on 16.4% of returns)
Here:
$6,145
State:
$11,095
(% of AGI for various income ranges: 36.0% for AGIs below $25k, 50.1% for AGIs $25k-50k, 115.0% for AGIs $50k-75k, 240.4% for AGIs $75k-100k, 443.9% for AGIs $100k-200k, 3662.9% for AGIs over 200k)
Net capital gain/loss in AGI: +$24,152 (reported on 14.4% of returns)
Here:
+$24,152
State:
+$44,925
(% of AGI for various income ranges: 4.7% for AGIs below $25k, 18.8% for AGIs $25k-50k, 66.9% for AGIs $50k-75k, 169.3% for AGIs $75k-100k, 575.6% for AGIs $100k-200k, 30335.0% for AGIs over 200k)
Profit/loss from business: +$12,325 (reported on 18.0% of returns)
Here:
+$12,325
State:
+$14,940
(% of AGI for various income ranges: 403.0% for AGIs below $25k, 217.2% for AGIs $25k-50k, 233.5% for AGIs $50k-75k, 312.3% for AGIs $75k-100k, 594.0% for AGIs $100k-200k, 2862.1% for AGIs over 200k)
Taxable individual retirement arrangement distribution: $15,652 (reported on 8.0% of returns)
11901:
$15,652
New York:
$19,609
(% of AGI for various income ranges: 46.3% for AGIs below $25k, 79.9% for AGIs $25k-50k, 164.3% for AGIs $50k-75k, 376.4% for AGIs $75k-100k, 954.1% for AGIs $100k-200k, 1184.3% for AGIs over 200k)
Self-employed (Keogh) retirement plans: $21,060 (reported on 0.3% of returns)
11901:
$21,060
New York:
$32,497
(% of AGI for various income ranges: 53.7% for AGIs $100k-200k, 437.9% for AGIs over 200k)
Total itemized deductions: $28,358 (reported on 9.9% of returns)
Here:
$28,358
State:
$39,326
(% of AGI for various income ranges: 74.6% for AGIs below $25k, 180.0% for AGIs $25k-50k, 488.1% for AGIs $50k-75k, 906.6% for AGIs $75k-100k, 1412.1% for AGIs $100k-200k, 5928.6% for AGIs over 200k)
Charity contributions: $6,068 (reported on 8.1% of returns)
Here:
$6,068
State:
$15,420
(% of AGI for various income ranges: 4.3% for AGIs below $25k, 17.5% for AGIs $25k-50k, 49.3% for AGIs $50k-75k, 104.7% for AGIs $75k-100k, 232.7% for AGIs $100k-200k, 2248.6% for AGIs over 200k)
Taxes paid: $8,821 (reported on 9.8% of returns)
11901:
$8,821
State:
$9,183
(% of AGI for various income ranges: 20.7% for AGIs below $25k, 54.1% for AGIs $25k-50k, 181.2% for AGIs $50k-75k, 286.4% for AGIs $75k-100k, 471.6% for AGIs $100k-200k, 1367.1% for AGIs over 200k)
Earned income credit: $2,140 (reported on 14.4% of returns)
Here:
$2,140
State:
$2,138
(% of AGI for various income ranges: 97.4% for AGIs below $25k, 59.7% for AGIs $25k-50k, 1.2% for AGIs $50k-75k)
Percentage of individuals using paid preparers for their 2020 taxes: 91.6%
Here:
92%
State:
95%
(% for various income ranges: 86.3% for AGIs below $25k, 93.5% for AGIs $25k-50k, 95.2% for AGIs $50k-75k, 95.8% for AGIs $75k-100k, 95.0% for AGIs $100k-200k, 95.6% for AGIs over 200k)
Averages for the 2012 tax year for zip code 11901, filed in 2013:
Average Adjusted Gross Income (AGI) in 2012: $49,044 (Individual Income Tax Returns)
Here:
$49,044
State:
$77,088
Salary/wage: $42,234 (reported on 78.9% of returns)
Here:
$42,234
State:
$60,593
(% of AGI for various income ranges: 70.4% for AGIs below $25k, 78.4% for AGIs $25k-50k, 70.4% for AGIs $50k-75k, 66.9% for AGIs $75k-100k, 71.7% for AGIs $100k-200k, 46.6% for AGIs over 200k)
Taxable interest for individuals: $1,500 (reported on 37.3% of returns)
This zip code:
$1,500
New York:
$3,125
(% of AGI for various income ranges: 1.5% for AGIs below $25k, 0.9% for AGIs $25k-50k, 0.9% for AGIs $50k-75k, 0.9% for AGIs $75k-100k, 0.8% for AGIs $100k-200k, 2.2% for AGIs over 200k)
Ordinary dividends: $4,290 (reported on 17.9% of returns)
Here:
$4,290
State:
$10,299
(% of AGI for various income ranges: 1.7% for AGIs below $25k, 1.2% for AGIs $25k-50k, 1.1% for AGIs $50k-75k, 1.3% for AGIs $75k-100k, 1.3% for AGIs $100k-200k, 3.1% for AGIs over 200k)
Net capital gain/loss in AGI: +$6,086 (reported on 13.7% of returns)
Here:
+$6,086
State:
+$42,474
(% of AGI for various income ranges: 0.5% for AGIs $50k-75k, 0.2% for AGIs $75k-100k, 0.9% for AGIs $100k-200k, 8.7% for AGIs over 200k)
Profit/loss from business: +$10,957 (reported on 14.9% of returns)
Here:
+$10,957
State:
+$16,168
(% of AGI for various income ranges: 10.1% for AGIs below $25k, 3.2% for AGIs $25k-50k, 2.2% for AGIs $50k-75k, 2.0% for AGIs $75k-100k, 2.3% for AGIs $100k-200k, 2.7% for AGIs over 200k)
Taxable individual retirement arrangement distribution: $14,134 (reported on 10.2% of returns)
11901:
$14,134
New York:
$17,621
(% of AGI for various income ranges: 2.8% for AGIs below $25k, 2.4% for AGIs $25k-50k, 2.5% for AGIs $50k-75k, 3.4% for AGIs $75k-100k, 3.0% for AGIs $100k-200k, 3.7% for AGIs over 200k)
Self-employment retirement plans: $11,580 (reported on 0.4% of returns)
11901:
$11,580
New York:
$27,330
Total itemized deductions: $24,690 (27% of AGI, reported on 33.9% of returns)
Here:
$24,690
State:
$34,985
Here:
26.7% of AGI
State:
21.3% of AGI
(% of AGI for various income ranges: 11.4% for AGIs below $25k, 16.3% for AGIs $25k-50k, 17.5% for AGIs $50k-75k, 19.6% for AGIs $75k-100k, 19.7% for AGIs $100k-200k, 15.3% for AGIs over 200k)
Charity contributions: $2,859 (reported on 29.1% of returns)
Here:
$2,859
State:
$5,572
(% of AGI for various income ranges: 0.8% for AGIs below $25k, 1.2% for AGIs $25k-50k, 1.6% for AGIs $50k-75k, 1.7% for AGIs $75k-100k, 1.8% for AGIs $100k-200k, 2.7% for AGIs over 200k)
Taxes paid: $11,130 (reported on 33.8% of returns)
11901:
$11,130
State:
$18,656
(% of AGI for various income ranges: 4.0% for AGIs below $25k, 7.6% for AGIs $25k-50k, 6.5% for AGIs $50k-75k, 8.3% for AGIs $75k-100k, 9.2% for AGIs $100k-200k, 8.4% for AGIs over 200k)
Earned income credit: $2,103 (reported on 16.1% of returns)
Here:
$2,103
State:
$2,230
(% of AGI for various income ranges: 4.8% for AGIs below $25k, 0.8% for AGIs $25k-50k)
Percentage of individuals using paid preparers for their 2012 taxes: 68.9%
Here:
69%
State:
66%
(% for various income ranges: 64.6% for AGIs below $25k, 67.7% for AGIs $25k-50k, 72.1% for AGIs $50k-75k, 75.6% for AGIs $75k-100k, 78.3% for AGIs $100k-200k, 87.5% for AGIs over 200k)
Averages for the 2004 tax year for zip code 11901, filed in 2005:
Average Adjusted Gross Income (AGI) in 2004: $42,899 (Individual Income Tax Returns)
Here:
$42,899
State:
$59,519
Salary/wage: $37,224 (reported on 80.8% of returns)
Here:
$37,224
State:
$50,673
(% of AGI for various income ranges: 107.6% for AGIs below $10k, 70.9% for AGIs $10k-25k, 79.7% for AGIs $25k-50k, 76.7% for AGIs $50k-75k, 75.2% for AGIs $75k-100k, 55.1% for AGIs over 100k)
Taxable interest for individuals: $1,517 (reported on 52.1% of returns)
This zip code:
$1,517
New York:
$2,377
(% of AGI for various income ranges: 7.0% for AGIs below $10k, 2.5% for AGIs $10k-25k, 1.5% for AGIs $25k-50k, 1.5% for AGIs $50k-75k, 1.4% for AGIs $75k-100k, 2.0% for AGIs over 100k)
Taxable dividends: $2,782 (reported on 24.0% of returns)
Here:
$2,782
State:
$5,394
(% of AGI for various income ranges: 6.3% for AGIs below $10k, 1.9% for AGIs $10k-25k, 1.1% for AGIs $25k-50k, 1.2% for AGIs $50k-75k, 1.3% for AGIs $75k-100k, 1.9% for AGIs over 100k)
Net capital gain/loss: +$7,531 (reported on 18.0% of returns)
Here:
+$7,531
State:
+$23,581
(% of AGI for various income ranges: -1.6% for AGIs below $10k, 0.2% for AGIs $10k-25k, 0.1% for AGIs $25k-50k, 0.9% for AGIs $50k-75k, 1.6% for AGIs $75k-100k, 8.5% for AGIs over 100k)
Profit/loss from business: +$10,314 (reported on 13.1% of returns)
Here:
+$10,314
State:
+$13,809
(% of AGI for various income ranges: 14.6% for AGIs below $10k, 5.7% for AGIs $10k-25k, 2.8% for AGIs $25k-50k, 2.4% for AGIs $50k-75k, 2.1% for AGIs $75k-100k, 2.9% for AGIs over 100k)
Profit/loss from farming: +$3,947 (reported on 0.2% of returns)
Here:
+$3,947
State:
-$2,666
IRA payment deduction: $3,189 (reported on 2.7% of returns)
11901:
$3,189
New York:
$3,115
(% of AGI for various income ranges: 0.2% for AGIs $10k-25k, 0.3% for AGIs $25k-50k, 0.2% for AGIs $50k-75k, 0.2% for AGIs $75k-100k, 0.1% for AGIs over 100k)
Self-employed pension: $7,909 (reported on 0.6% of returns)
Here:
$7,909
New York:
$19,016
Total itemized deductions: $20,186 (26% of AGI, reported on 37.3% of returns)
Here:
$20,186
State:
$25,864
Here:
26.1% of AGI
State:
21.9% of AGI
(% of AGI for various income ranges: 13.0% for AGIs below $10k, 12.9% for AGIs $10k-25k, 15.8% for AGIs $25k-50k, 21.3% for AGIs $50k-75k, 20.7% for AGIs $75k-100k, 16.9% for AGIs over 100k)
Charity contributions deductions: $2,559 (3% of AGI, reported on 34.9% of returns)
Here:
$2,559
State:
$4,439
Here:
3.2% of AGI
State:
3.6% of AGI
(% of AGI for various income ranges: 0.9% for AGIs below $10k, 1.1% for AGIs $10k-25k, 1.8% for AGIs $25k-50k, 2.4% for AGIs $50k-75k, 2.6% for AGIs $75k-100k, 2.2% for AGIs over 100k)
Total tax: $6,442 (reported on 73.9% of returns)
11901:
$6,442
State:
$11,730
(% of AGI for various income ranges: 3.9% for AGIs below $10k, 3.9% for AGIs $10k-25k, 6.8% for AGIs $25k-50k, 8.9% for AGIs $50k-75k, 10.2% for AGIs $75k-100k, 18.5% for AGIs over 100k)
Earned income credit: $1,664 (reported on 15.3% of returns)
Here:
$1,664
State:
$1,757
Percentage of individuals using paid preparers for their 2004 taxes: 69.5%
Here:
70%
State:
67%
(% for various income ranges: 57.7% for AGIs below $10k, 70.9% for AGIs $10k-25k, 69.0% for AGIs $25k-50k, 74.6% for AGIs $50k-75k, 78.0% for AGIs $75k-100k, 81.2% for AGIs over 100k)
Likely homosexual households (counted as self-reported same-sex unmarried-partner households)
Lesbian couples: 0.2% of all households
Gay men: 0.1% of all households
Household received Food Stamps/SNAP in the past 12 months: 1,076 Household did not receive Food Stamps/SNAP in the past 12 months: 10,487
Women who had a birth in the past 12 months: 457 (206 now married, 256 unmarried) Women who did not have a birth in the past 12 months: 4,934 (1,582 now married, 3,362 unmarried)
Housing units in zip code 11901 with a mortgage: 3,986 (424 second mortgage, 322 both second mortgage and home equity loan) Houses without a mortgage: 243
Median monthly owner costs for units with a mortgage: $2,464 Median monthly owner costs for units without a mortgage: $1,202
Residents with income below the poverty level in 2022:
This zip code:
13.8%
Whole state:
14.3%
Residents with income below 50% of the poverty level in 2022:
This zip code:
7.6%
Whole state:
6.8%
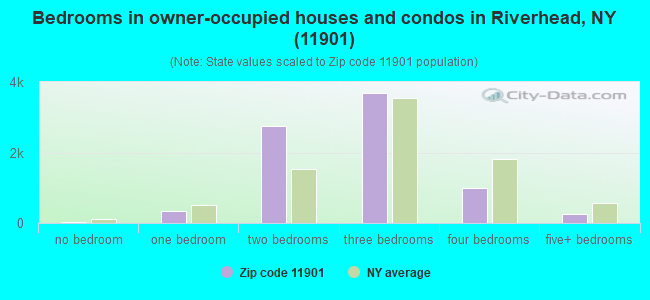
Median number of rooms in houses and condos:
Here:
5.7
State:
6.3
Median number of rooms in apartments:
Here:
4.5
State:
3.8
Notable locations in this zip code not listed on our city pages
Notable locations in zip code 11901: Cherry Creek Golf Links (A), Long Island National Golf Club (B), Indian Island Golf Course (C), New York State Research Farm (D), Tanger Factory Outlet Center (E), Riverhead Station (F), Sandy Pond Golf Course (G), Luce Landing (H), The Woods at Cherry Creek (I), Olde Vine Golf Club (J), Hampton Hills Golf and Country Club (K), Riverhead Sewage Treatment Plant (L), Camp Carey (M), Riverhead Raceway (N), Wells Farm (O), Anderson Farms (P), Hallockville Museum Farm (Q), Briermere Farms (R), North Wind Farm (S), Duffy Farms (T). Display/hide their locations on the map
Churches in zip code 11901 include: Saint Isidore's Roman Catholic Church (A), First Parish Church (B), Old Steeple Community Church (C), Church of the Harvest (D), Emmanuel Baptist Church (E), Saint John The Baptist Ukrainian Church (F), The Church of Jesus Christ of Latter Day Saints (G), Grace Episcopal Church (H), Saint John The Evangelist Roman Catholic Church (I). Display/hide their locations on the map
Cemeteries: Riverhead Cemetery (1), Saint Johns Cemetery (2), Aquebogue Cemetery (3), Northville Cemetery (4), Sound Avenue Cemetery (5). Display/hide their locations on the map
Lakes, reservoirs, and swamps: Lily Pond (A), Merritts Pond (B), Sears Pond (C), Sweezy Pond (D), Wildwood Lake (E), Bellows Pond (F), Cedar Pond (G), Cheney Pond (H). Display/hide their locations on the map
Rivers and creeks: Goose Creek (A), Peconic River (B), Birch Creek (C), Sawmill Creek (D), Mill Creek (E), Little River (F), Hubbard Creek (G). Display/hide their locations on the map
3,532 married couples with children.
1,486 single-parent households (153 men, 1,333 women).
71.0% of residents of 11901 zip code speak English at home.
22.7% of residents speak Spanish at home (39% very well, 29% well, 21% not well, 11% not at all).
5.7% of residents speak other Indo-European language at home (56% very well, 29% well, 15% not well).
0.3% of residents speak Asian or Pacific Island language at home (90% very well, 10% well).
0.9% of residents speak other language at home (71% very well, 12% well, 17% not well).
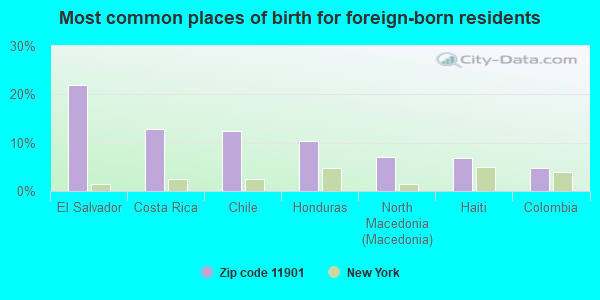
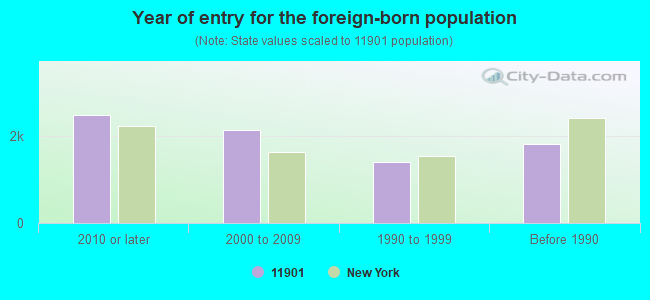
Foreign born population: 7,483 (23.5%) (43.6% of them are naturalized citizens)
Major facilities with environmental interests located in this zip code:
ADCHEM CORPORATION (1852 OLD COUNTRY ROAD in RIVERHEAD, NY)
AIR MAJOR (AIRS/AFS) STATE MASTER (New York facility tracking) - AIR PROGRAM, AIR MAJOR, HAZARDOUS WASTE PROGRAM CRITERIA AND HAZARDOUS AIR POLLUTANT INVENTORY (Inventory of air pollution sources) HAZARDOUS WASTE BIENNIAL REPORTER (Resource Conservation and Recovery Act (tracking hazardous waste)) Large Quantity Generators, more that 1000 kg of hazardous waste/month (Resource Conservation and Recovery Act (tracking hazardous waste)) - notification TRANSPORTER (Resource Conservation and Recovery Act (tracking hazardous waste)) TRI REPORTER (Tracking of toxic chemicals releasing facilities) Business SIC classification: COATED AND LAMINATED PAPER; ORTHOPEDIC, PROSTHETIC, AND SURGICAL APPLIANCES AND SUPPLIES Business NAICS classification: COATED AND LAMINATED PAPER MANUFACTURING.; COATED AND LAMINATED PAPER MANUFACTURING.; COATED AND LAMINATED PAPER MANUFACTURING. Organizations: RIVERHEAD INDUSTRIAL PROPERTIES (CONTACT/OWNER)
, GANNETT FLEMING ENGINEERS & ARCHITECTS (FACILITY APPLICATION CONTACT)
Alternative names: ADCHEM INDUSTRIES INC
HAZELTINE RIVERHEAD ELECTRONIC MFG PLANT (1750 OLD COUNTRY ROAD in RIVERHEAD, NY)
STATE MASTER (New York facility tracking) - AIR PROGRAM, GROUNDWATER PROGRAM, (Resource Conservation and Recovery Act (tracking hazardous waste)) TRI REPORTER (Tracking of toxic chemicals releasing facilities) Business SIC classification: TELEPHONE AND TELEGRAPH APPARATUS; AIRCRAFT PARTS AND AUXILIARY EQUIPMENT Organizations: H2M CORP (FACILITY APPLICATION CONTACT)
, HAZELTINE CORP (LEGALLY RESPONSIBLE PARTY)
, HAZELTINE EUROPE INC (LEGALLY RESPONSIBLE PARTY)
Alternative names: HAZELTINE CORP
CONOCOPHILLIPS COMPANY RIVERHEAD TERMINAL (212 SOUND SHORE ROAD in RIVERHEAD, NY)
AIR MAJOR (AIRS/AFS) OIL CONTROL (Facility Response Plan for oil discharge) CRITERIA AND HAZARDOUS AIR POLLUTANT INVENTORY (Inventory of air pollution sources) National Pollutant Discharge Elimination System NON-MAJOR (Tracking pollutant discharge elimination systems) - permit HAZARDOUS WASTE BIENNIAL REPORTER (Resource Conservation and Recovery Act (tracking hazardous waste)) Small Quantity Generators, between 100 kg and 1000 kg of hazardous waste/month (Resource Conservation and Recovery Act (tracking hazardous waste)) TRI REPORTER (Tracking of toxic chemicals releasing facilities) Business SIC classification: MARINE CARGO HANDLING; PETROLEUM BULK STATIONS AND TERMINALS Organizations: CONOCOPHILLIPS CO - RIVERHEAD TERMINAL (CONTACT/OPERATOR)
, TOSCO REFINING CO (CONTACT/OWNER)
Alternative names: NORTHVILLE RIVERHEAD TERMINAL, RIVERHEAD TERMINAL , RIVERHEAD TERMINAL-CONOCOPHILLIPS, TOSCO CORP. RIVERHEAD, TOSCO CORP - RIVERHEAD TERMINAL, TOSCO REFINING CO, TOSCO - RIVERHEAD TERMINAL
COLOSSAL AUTO BODY (36 RAYNOR AVE in RIVERHEAD, NY)
STATE MASTER (New York facility tracking) - HAZARDOUS WASTE PROGRAM (Resource Conservation and Recovery Act (tracking hazardous waste))
HESS STATION #32362 (870 OLD COUNTRY RD in RIVERHEAD, NY)
STATE MASTER (New York facility tracking) - GROUNDWATER PROGRAM, AIR PROGRAM, Conditionally Exempt Small Quantity Generators, less than 100 kg/month of hazardous waste (Resource Conservation and Recovery Act (tracking hazardous waste)) Business SIC classification: PETROLEUM AND PETROLEUM PRODUCTS WHOLESALERS, EXCEPT BULK STATIONS AND TERMINALS Organizations: HESS CORPORATION, AMERADA HESS CORP (LEGALLY RESPONSIBLE PARTY)
Alternative names: AMERADA HESS STATION 32362
HITMAN COLLISION (1471 PULASKI ST in RIVERHEAD, NY)
STATE MASTER (New York facility tracking) - AIR PROGRAM, HAZARDOUS WASTE PROGRAM (Resource Conservation and Recovery Act (tracking hazardous waste)) Business SIC classification: TOP, BODY, AND UPHOLSTERY REPAIR SHOPS AND PAINT SHOPS Business NAICS classification: AUTOMOTIVE BODY, PAINT, AND INTERIOR REPAIR AND MAINTENANCE.
AGWAY RIVERHEAD FERTILIZER CHEMICAL PLT (205 MARCY AVE in RIVERHEAD, NY)
AIR SYNTHETIC MINOR (AIRS/AFS) STATE MASTER (New York facility tracking) - HAZARDOUS WASTE PROGRAM Business SIC classification: PESTICIDES AND AGRICULTURAL CHEMICALS Organizations: AGWAY INC (LEGALLY RESPONSIBLE PARTY)
Alternative names: RIVERHEAD FERT CHEMICAL
GL PAVING PRODUCTS (3 YOUNGS AVENUE in RIVERHEAD, NY)
AIR SYNTHETIC MINOR (AIRS/AFS) STATE MASTER (New York facility tracking) - AIR PROGRAM Business SIC classification: ASPHALT PAVING MIXTURES AND BLOCKS Organizations: G L PAVING PRODUCTS INC (LEGALLY RESPONSIBLE PARTY)
AGWAY RIVERHEAD FERTILIZER PLANT (539 MARCY AVE in RIVERHEAD, NY)
GRAPHICS OF PECONIC INC (PLEASURE DR in RIVERHEAD, NY)
Small Quantity Generators, between 100 kg and 1000 kg of hazardous waste/month (Resource Conservation and Recovery Act (tracking hazardous waste)) TSD (Resource Conservation and Recovery Act (tracking hazardous waste)) Organizations: RICHARD FALCONE (CONTACT/OWNER)
HALLOCK CONVEYOR CORP (RTE 2 BOX 386 in RIVERHEAD, NY)
(Resource Conservation and Recovery Act (tracking hazardous waste)) Business NAICS classification: OTHER COMMERCIAL AND SERVICE INDUSTRY MACHINERY MANUFACTURING.; COMPUTER STORAGE DEVICE MANUFACTURING. Organizations: WILLIAM K HALLOCK (CONTACT/OWNER)
887 MANAGEMENT CORPORATION (887 OLD COUNTRY ROAD in RIVERHEAD, NY)
(Resource Conservation and Recovery Act (tracking hazardous waste))
AGWAY ENERGY PRODUCTS (1091 PULASKI RD in RIVERHEAD, NY)
(Resource Conservation and Recovery Act (tracking hazardous waste)) Business NAICS classification: HEATING OIL DEALERS.
Housing units lacking complete plumbing facilities: 1.1% Housing units lacking complete kitchen facilities: 0.4%
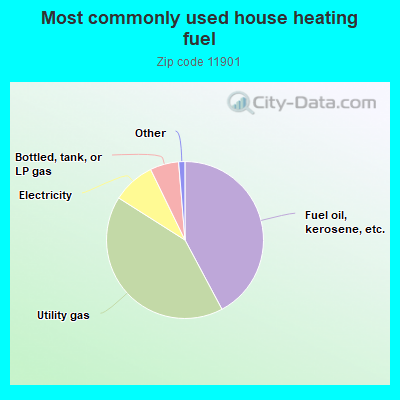
42.2%Fuel oil, kerosene, etc.
41.8%Utility gas
8.8%Electricity
5.9%Bottled, tank, or LP gas
0.6%Wood
0.5%No fuel used
Population in 1990: 20,705. Population change in the 1990s: +2,192 (+10.6%).
Place of birth for U.S.-born residents:
This state: 20,882
Northeast: 859
Midwest: 279
South: 1,605
West: 331
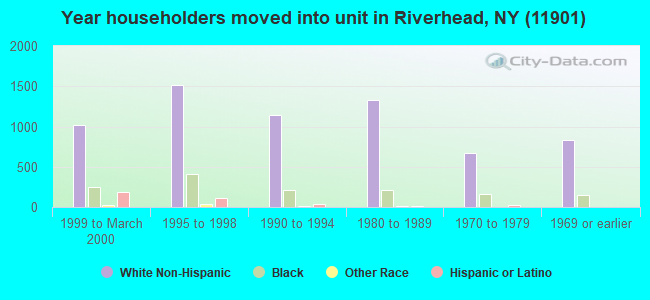
59% of the 11901 zip code residents lived in the same house 5 years ago. Out of people who lived in different houses, 69% lived in this county. Out of people who lived in different counties, 50% lived in New York.
89% of the 11901 zip code residents lived in the same house 1 year ago. Out of people who lived in different houses, 73% moved from this county. Out of people who lived in different houses, 20% moved from different county within same state. Out of people who lived in different houses, 4% moved from different state. Out of people who lived in different houses, 1% moved from abroad.
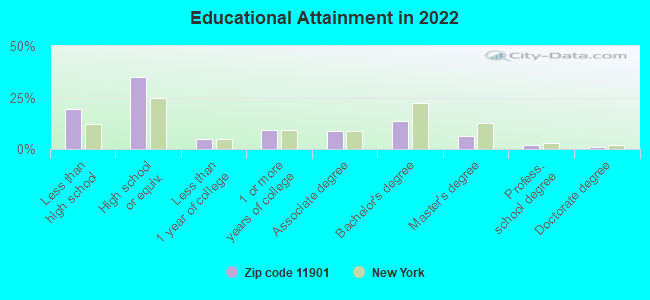
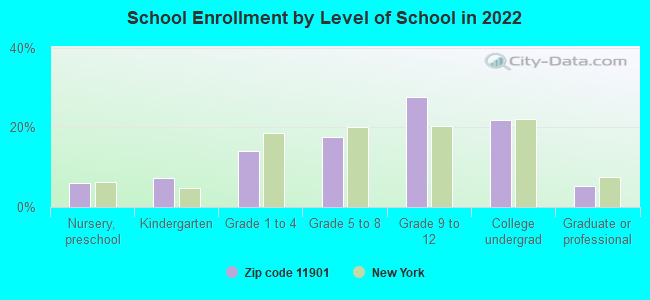
Private vs. public school enrollment:
Students in private schools in grades 1 to 8 (elementary and middle school): 89
Here:
5.0%
New York:
15.6%
Students in private schools in grades 9 to 12 (high school): 99
Here:
6.4%
New York:
15.0%
Students in private undergraduate colleges: 315
Here:
25.8%
New York:
39.2%
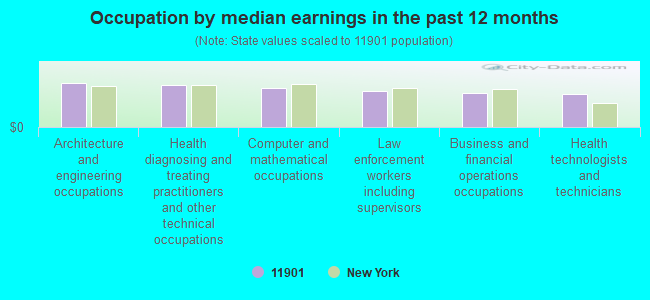
Occupation by median earnings in the past 12 months ($)
109,022Architecture and engineering occupations
104,192Health diagnosing and treating practitioners and other technical occupations
96,459Computer and mathematical occupations
88,315Law enforcement workers including supervisors
84,058Business and financial operations occupations
81,727Health technologists and technicians
Companies with federal contracts located in this zip code (RIVERHEAD, NY):
TRUETECH, INC (680 ELTON ST; small business) : $120,329,709 in 99 contractsfrom 1999 to 2006
Contracts for Miscellaneous Chemical Specialties, Hazard-Detecting Instruments and Apparatus, Chemicals, Chemical Weapons and Equipment, and moreby Army, Department of State, Navy, Defense Logistics Agency, and others Signed by year:2000: $11,862,533; 2001: $14,183,354; 2002: $12,799,897; 2003: $29,638,308; 2004: $24,353,982; 2005: $25,764,005; 2006: $1,117,833.
Biggest contracts:
$11,763,177 with Army for Miscellaneous Chemical Specialties. Signed on 2004-11-30. Completion date: 2005-12-31.
$8,667,750, same as above.Signed on 2004-01-29. Completion date: 2006-04-01.
$8,338,000, same as above.Signed on 2003-12-13. Completion date: 2005-12-31.
$8,299,954, same as above.Signed on 2005-10-24. Completion date: 2007-04-16.
BEN VAN INDUSTRIES INC (680 ELTON ST; small business) : $185,065 in 3 contractsfrom 2000 to 2001
$74,815 with Navy for Water Purification Equipment. Taking place in MA. Signed on 2001-10-01. Completion date: 2001-10-25.
$56,700 with Defense Logistics Agency for Water Purification Equipment. Taking place in MA. Signed on 2000-11-03. Completion date: 2001-01-02.
$53,550, same as above.Signed on 2001-04-05. Completion date: 2001-09-02.
PECONIC SCUBA INC (369 RTE 24; small business) : $110,128 in 5 contractsfrom 2004 to 2005
Contracts for Specialized Flight Clothing and Accessories, Individual Equipment by Army Signed by year:2000: $0; 2001: $0; 2002: $0; 2003: $0; 2004: $39,280; 2005: $70,848; 2006: $0.
Biggest contracts:
$70,848 with Army for Specialized Flight Clothing and Accessories. Signed on 2005-06-30. Completion date: 2005-07-29.
$19,680 with Army for Individual Equipment. Signed on 2004-12-22. Completion date: 2005-03-01.
$9,840, same as above.Signed on 2004-06-24. Completion date: 2004-07-30.
$5,824, same as above.Signed on 2004-08-17. Completion date: 2004-09-30.
FREDERICK COWAN & COMPANY, INC (48 KROEMER AVE; small business)
$26,000 with Navy for Generators and Generators Sets, Electrical. Signed on 2005-02-28. Completion date: 2005-05-20.
D'ANGELO ENTERPRISES INC (1407 PULASKI ST; small business)
$18,500 with Army for Motorcycles, Motor Scooters, and Bicycles. Signed on 2005-09-13. Completion date: 2005-10-13.
RVF CO INC (421 RIVERLEIGH AVE; small business) : $11,080 in 3 contractsfrom 2004 to 2005
$5,645 with Army for Miscellaneous Maintenance and Repair Shop Specialized Equipment. Signed on 2004-09-02. Completion date: 2004-09-10.
$3,650 with Army for Miscellaneous Construction Materials. Signed on 2004-08-31. Completion date: 2004-09-30.
$1,785 with Army for Hardware, Commercial. Signed on 2005-01-28. Completion date: 2005-02-18.
RIVERHEAD BUILDING SUPPLY CORP (1295 PULASKI ST; small business)
$5,337 with Army for Lumber and Related Basic Wood Materials. Signed on 2005-09-27. Completion date: 2005-10-27.
RIVERHEAD HOTEL GROUP LP (1830 ROUTE 25; small business)
$5,031 with Army for Lodging - Hotel/Motel. Signed on 2003-07-10. Completion date: 2003-06-20.
RIVERHEAD RADIATOR SERVICE INC (1181 E MAIN ST; small business)
$4,800 with Army for Maintenance, Repair and Rebuilding of Equipment -- Miscellaneous. Signed on 2005-09-29. Completion date: 2005-11-30.
PAK-AM HOTELS LTD (30 E MORICHES ROAD; small business) : $726 in 2 contractsin 2004
$462 with Army for Lodging - Hotel/Motel. Signed on 2004-04-01. Completion date: 2004-02-27.
$264, same as above.Signed on 2004-02-23. Completion date: 2004-02-27.
Top industries in this zip code by the number of employees in 2005:
Health Care and Social Assistance: General Medical and Surgical Hospitals (500-999 employees: 1 establishment)
2002 - 2018 National Fire Incident Reporting System (NFIRS) incidents
According to the data from the years 2002 - 2018 the average number of fire incidents per year is 27. The highest number of reported fires - 120 took place in 2002, and the least - 0 in 2006. The data has a declining trend.
When looking into fire subcategories, the most reports belonged to: Outside Fires (49.5%), and Structure Fires (35.1%).
Fire incident types reported to NFIRS in Zip Code 11901


+$3,947
-$2,666
 Nearest zip codes: 11931, 11970, 11947, 11948, 11942, 11972.


 According to the data from the years 2002 - 2018 the average number of fire incidents per year is 27. The highest number of reported fires - 120 took place in 2002, and the least - 0 in 2006. The data has a declining trend.
 When looking into fire subcategories, the most reports belonged to: Outside Fires (49.5%), and Structure Fires (35.1%).