Estimated zip code population in 2022: 18,848 Zip code population in 2010: 19,880 Zip code population in 2000: 19,487
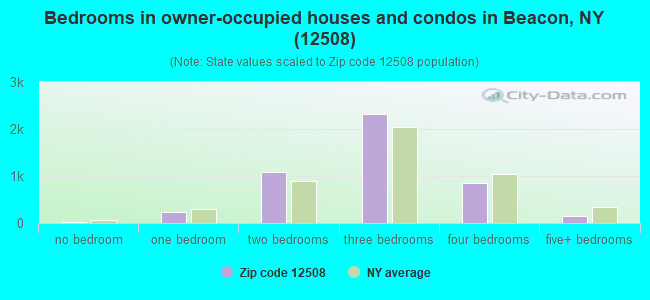
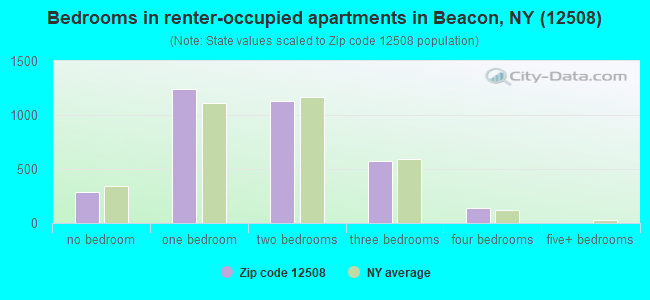
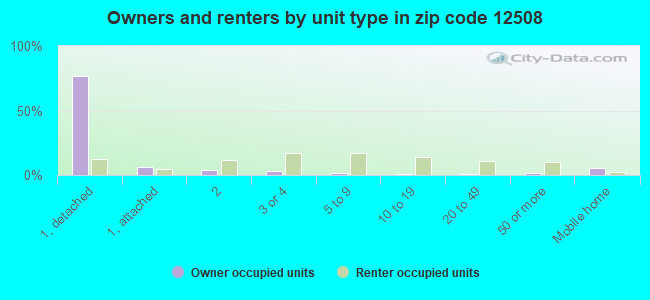
Houses and condos: 8,488 Renter-occupied apartments: 3,366
% of renters here:
42%
State:
46%
March 2022 cost of living index in zip code 12508: 135.1 (high, U.S. average is 100)
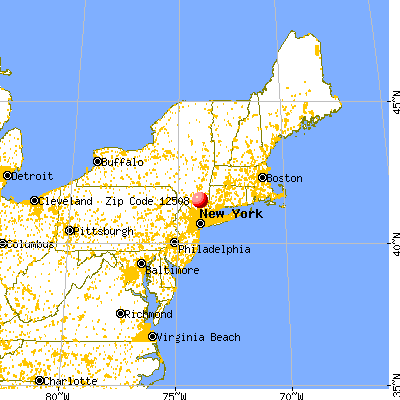
Land area: 14.6 sq. mi. Water area: 0.1 sq. mi.
Population density: 1,294 people per square mile
(low).
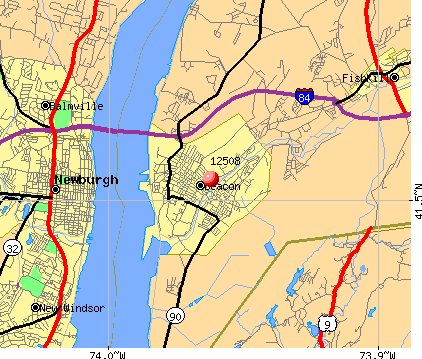
OSM Map
General Map
Google Map
MSN Map
OSM Map
General Map
Google Map
MSN Map
OSM Map
General Map
Google Map
MSN Map
OSM Map
General Map
Google Map
MSN Map
Please wait while loading the map...
Real estate property taxes paid for housing units in 2022:
This zip code:
1.7% ($6,710)
New York:
1.5% ($6,180)
Median real estate property taxes paid for housing units with mortgages in 2022: $7,006 (1.7%) Median real estate property taxes paid for housing units with no mortgage in 2022: $5,954 (1.8%)
Averages for the 2020 tax year for zip code 12508, filed in 2021:
Average Adjusted Gross Income (AGI) in 2020: $75,112 (Individual Income Tax Returns)
Here:
$75,112
State:
$90,930
Salary/wage: $66,991 (reported on 81.7% of returns)
Here:
$66,991
State:
$72,104
(% of AGI for various income ranges: 1052.7% for AGIs below $25k, 3536.8% for AGIs $25k-50k, 6506.8% for AGIs $50k-75k, 10093.7% for AGIs $75k-100k, 18674.0% for AGIs $100k-200k, 73364.1% for AGIs over 200k)
Taxable interest for individuals: $1,018 (reported on 36.7% of returns)
This zip code:
$1,018
New York:
$3,075
(% of AGI for various income ranges: 13.8% for AGIs below $25k, 18.1% for AGIs $25k-50k, 29.6% for AGIs $50k-75k, 46.8% for AGIs $75k-100k, 104.3% for AGIs $100k-200k, 802.4% for AGIs over 200k)
Ordinary dividends: $4,345 (reported on 21.8% of returns)
Here:
$4,345
State:
$11,095
(% of AGI for various income ranges: 27.2% for AGIs below $25k, 44.9% for AGIs $25k-50k, 81.7% for AGIs $50k-75k, 111.1% for AGIs $75k-100k, 278.6% for AGIs $100k-200k, 2027.6% for AGIs over 200k)
Net capital gain/loss in AGI: +$14,062 (reported on 18.8% of returns)
Here:
+$14,062
State:
+$44,925
(% of AGI for various income ranges: 9.6% for AGIs below $25k, 31.5% for AGIs $25k-50k, 74.4% for AGIs $50k-75k, 93.4% for AGIs $75k-100k, 461.4% for AGIs $100k-200k, 10877.1% for AGIs over 200k)
Profit/loss from business: +$16,160 (reported on 18.2% of returns)
Here:
+$16,160
State:
+$14,940
(% of AGI for various income ranges: 112.9% for AGIs below $25k, 202.9% for AGIs $25k-50k, 315.9% for AGIs $50k-75k, 367.2% for AGIs $75k-100k, 1000.9% for AGIs $100k-200k, 4134.1% for AGIs over 200k)
Taxable individual retirement arrangement distribution: $15,196 (reported on 7.8% of returns)
12508:
$15,196
New York:
$19,609
(% of AGI for various income ranges: 53.6% for AGIs below $25k, 81.7% for AGIs $25k-50k, 158.8% for AGIs $50k-75k, 249.8% for AGIs $75k-100k, 445.5% for AGIs $100k-200k, 781.8% for AGIs over 200k)
Self-employed (Keogh) retirement plans: $21,900 (reported on 0.8% of returns)
12508:
$21,900
New York:
$32,497
(% of AGI for various income ranges: 36.7% for AGIs $50k-75k, 76.0% for AGIs $100k-200k, 365.9% for AGIs over 200k)
Total itemized deductions: $24,979 (reported on 11.0% of returns)
Here:
$24,979
State:
$39,326
(% of AGI for various income ranges: 77.8% for AGIs below $25k, 131.1% for AGIs $25k-50k, 341.7% for AGIs $50k-75k, 541.5% for AGIs $75k-100k, 996.9% for AGIs $100k-200k, 3317.1% for AGIs over 200k)
Charity contributions: $4,763 (reported on 8.6% of returns)
Here:
$4,763
State:
$15,420
(% of AGI for various income ranges: 3.3% for AGIs below $25k, 12.4% for AGIs $25k-50k, 34.9% for AGIs $50k-75k, 68.8% for AGIs $75k-100k, 144.2% for AGIs $100k-200k, 813.5% for AGIs over 200k)
Taxes paid: $8,889 (reported on 11.0% of returns)
12508:
$8,889
State:
$9,183
(% of AGI for various income ranges: 23.4% for AGIs below $25k, 43.2% for AGIs $25k-50k, 138.7% for AGIs $50k-75k, 227.2% for AGIs $75k-100k, 373.6% for AGIs $100k-200k, 909.4% for AGIs over 200k)
Earned income credit: $1,820 (reported on 10.9% of returns)
Here:
$1,820
State:
$2,138
(% of AGI for various income ranges: 68.3% for AGIs below $25k, 42.5% for AGIs $25k-50k)
Percentage of individuals using paid preparers for their 2020 taxes: 94.3%
Here:
94%
State:
95%
(% for various income ranges: 91.2% for AGIs below $25k, 95.0% for AGIs $25k-50k, 95.4% for AGIs $50k-75k, 95.0% for AGIs $75k-100k, 95.4% for AGIs $100k-200k, 97.9% for AGIs over 200k)
Averages for the 2012 tax year for zip code 12508, filed in 2013:
Average Adjusted Gross Income (AGI) in 2012: $54,303 (Individual Income Tax Returns)
Here:
$54,303
State:
$77,088
Salary/wage: $51,163 (reported on 84.6% of returns)
Here:
$51,163
State:
$60,593
(% of AGI for various income ranges: 70.0% for AGIs below $25k, 80.1% for AGIs $25k-50k, 80.5% for AGIs $50k-75k, 79.5% for AGIs $75k-100k, 83.8% for AGIs $100k-200k, 73.3% for AGIs over 200k)
Taxable interest for individuals: $685 (reported on 39.4% of returns)
This zip code:
$685
New York:
$3,125
(% of AGI for various income ranges: 1.1% for AGIs below $25k, 0.4% for AGIs $25k-50k, 0.4% for AGIs $50k-75k, 0.5% for AGIs $75k-100k, 0.4% for AGIs $100k-200k, 0.6% for AGIs over 200k)
Ordinary dividends: $2,696 (reported on 19.3% of returns)
Here:
$2,696
State:
$10,299
(% of AGI for various income ranges: 1.7% for AGIs below $25k, 1.1% for AGIs $25k-50k, 0.7% for AGIs $50k-75k, 0.8% for AGIs $75k-100k, 0.7% for AGIs $100k-200k, 1.6% for AGIs over 200k)
Net capital gain/loss in AGI: +$3,711 (reported on 13.1% of returns)
Here:
+$3,711
State:
+$42,474
(% of AGI for various income ranges: 0.2% for AGIs $25k-50k, 0.1% for AGIs $50k-75k, 0.6% for AGIs $75k-100k, 0.5% for AGIs $100k-200k, 5.6% for AGIs over 200k)
Profit/loss from business: +$10,750 (reported on 14.0% of returns)
Here:
+$10,750
State:
+$16,168
(% of AGI for various income ranges: 6.6% for AGIs below $25k, 3.9% for AGIs $25k-50k, 1.7% for AGIs $50k-75k, 2.4% for AGIs $75k-100k, 2.3% for AGIs $100k-200k, 2.0% for AGIs over 200k)
Taxable individual retirement arrangement distribution: $12,465 (reported on 8.4% of returns)
12508:
$12,465
New York:
$17,621
(% of AGI for various income ranges: 2.5% for AGIs below $25k, 1.5% for AGIs $25k-50k, 1.6% for AGIs $50k-75k, 1.9% for AGIs $75k-100k, 2.8% for AGIs $100k-200k)
Self-employment retirement plans: $13,033 (reported on 0.4% of returns)
12508:
$13,033
New York:
$27,330
Total itemized deductions: $21,930 (23% of AGI, reported on 37.2% of returns)
Here:
$21,930
State:
$34,985
Here:
23.4% of AGI
State:
21.3% of AGI
(% of AGI for various income ranges: 10.6% for AGIs below $25k, 10.7% for AGIs $25k-50k, 14.3% for AGIs $50k-75k, 16.7% for AGIs $75k-100k, 17.9% for AGIs $100k-200k, 14.5% for AGIs over 200k)
Charity contributions: $2,290 (reported on 30.6% of returns)
Here:
$2,290
State:
$5,572
(% of AGI for various income ranges: 0.6% for AGIs below $25k, 0.9% for AGIs $25k-50k, 1.2% for AGIs $50k-75k, 1.5% for AGIs $75k-100k, 1.5% for AGIs $100k-200k, 1.6% for AGIs over 200k)
Taxes paid: $9,955 (reported on 37.1% of returns)
12508:
$9,955
State:
$18,656
(% of AGI for various income ranges: 3.5% for AGIs below $25k, 3.9% for AGIs $25k-50k, 5.7% for AGIs $50k-75k, 7.3% for AGIs $75k-100k, 8.7% for AGIs $100k-200k, 8.9% for AGIs over 200k)
Earned income credit: $1,932 (reported on 15.4% of returns)
Here:
$1,932
State:
$2,230
(% of AGI for various income ranges: 5.1% for AGIs below $25k, 0.9% for AGIs $25k-50k)
Percentage of individuals using paid preparers for their 2012 taxes: 60.2%
Here:
60%
State:
66%
(% for various income ranges: 54.7% for AGIs below $25k, 56.5% for AGIs $25k-50k, 62.5% for AGIs $50k-75k, 68.1% for AGIs $75k-100k, 70.3% for AGIs $100k-200k, 80.0% for AGIs over 200k)
Averages for the 2004 tax year for zip code 12508, filed in 2005:
Average Adjusted Gross Income (AGI) in 2004: $43,563 (Individual Income Tax Returns)
Here:
$43,563
State:
$59,519
Salary/wage: $41,388 (reported on 86.6% of returns)
Here:
$41,388
State:
$50,673
(% of AGI for various income ranges: 91.6% for AGIs below $10k, 76.2% for AGIs $10k-25k, 84.3% for AGIs $25k-50k, 84.0% for AGIs $50k-75k, 86.3% for AGIs $75k-100k, 77.3% for AGIs over 100k)
Taxable interest for individuals: $912 (reported on 51.1% of returns)
This zip code:
$912
New York:
$2,377
(% of AGI for various income ranges: 3.5% for AGIs below $10k, 1.5% for AGIs $10k-25k, 1.1% for AGIs $25k-50k, 1.1% for AGIs $50k-75k, 0.8% for AGIs $75k-100k, 1.0% for AGIs over 100k)
Taxable dividends: $1,845 (reported on 23.3% of returns)
Here:
$1,845
State:
$5,394
(% of AGI for various income ranges: 2.8% for AGIs below $10k, 1.4% for AGIs $10k-25k, 0.8% for AGIs $25k-50k, 0.8% for AGIs $50k-75k, 0.6% for AGIs $75k-100k, 1.5% for AGIs over 100k)
Net capital gain/loss: +$5,692 (reported on 16.1% of returns)
Here:
+$5,692
State:
+$23,581
(% of AGI for various income ranges: -0.6% for AGIs below $10k, -0.2% for AGIs $10k-25k, 0.1% for AGIs $25k-50k, 1.2% for AGIs $50k-75k, 0.9% for AGIs $75k-100k, 6.8% for AGIs over 100k)
Profit/loss from business: +$8,369 (reported on 12.0% of returns)
Here:
+$8,369
State:
+$13,809
(% of AGI for various income ranges: 8.3% for AGIs below $10k, 4.8% for AGIs $10k-25k, 1.8% for AGIs $25k-50k, 1.1% for AGIs $50k-75k, 2.4% for AGIs $75k-100k, 2.5% for AGIs over 100k)
IRA payment deduction: $3,095 (reported on 1.9% of returns)
12508:
$3,095
New York:
$3,115
(% of AGI for various income ranges: 0.2% for AGIs $10k-25k, 0.2% for AGIs $25k-50k, 0.1% for AGIs $50k-75k, 0.1% for AGIs $75k-100k, 0.1% for AGIs over 100k)
Self-employed pension: $8,205 (reported on 0.5% of returns)
Here:
$8,205
New York:
$19,016
Total itemized deductions: $18,351 (26% of AGI, reported on 38.4% of returns)
Here:
$18,351
State:
$25,864
Here:
25.6% of AGI
State:
21.9% of AGI
(% of AGI for various income ranges: 11.3% for AGIs below $10k, 9.1% for AGIs $10k-25k, 13.8% for AGIs $25k-50k, 18.7% for AGIs $50k-75k, 18.6% for AGIs $75k-100k, 17.1% for AGIs over 100k)
Charity contributions deductions: $2,463 (3% of AGI, reported on 35.2% of returns)
Here:
$2,463
State:
$4,439
Here:
3.3% of AGI
State:
3.6% of AGI
(% of AGI for various income ranges: 0.4% for AGIs below $10k, 1.0% for AGIs $10k-25k, 1.7% for AGIs $25k-50k, 2.1% for AGIs $50k-75k, 2.4% for AGIs $75k-100k, 2.3% for AGIs over 100k)
Total tax: $5,521 (reported on 77.2% of returns)
12508:
$5,521
State:
$11,730
(% of AGI for various income ranges: 2.5% for AGIs below $10k, 4.0% for AGIs $10k-25k, 7.2% for AGIs $25k-50k, 9.1% for AGIs $50k-75k, 10.3% for AGIs $75k-100k, 15.0% for AGIs over 100k)
Earned income credit: $1,625 (reported on 14.9% of returns)
Here:
$1,625
State:
$1,757
Percentage of individuals using paid preparers for their 2004 taxes: 66.4%
Here:
66%
State:
67%
(% for various income ranges: 58.7% for AGIs below $10k, 67.1% for AGIs $10k-25k, 65.0% for AGIs $25k-50k, 69.2% for AGIs $50k-75k, 70.5% for AGIs $75k-100k, 74.5% for AGIs over 100k)
Likely homosexual households (counted as self-reported same-sex unmarried-partner households)
Lesbian couples: 0.9% of all households
Gay men: 0.3% of all households
Household received Food Stamps/SNAP in the past 12 months: 939 Household did not receive Food Stamps/SNAP in the past 12 months: 7,047
Women who had a birth in the past 12 months: 199 (147 now married, 51 unmarried) Women who did not have a birth in the past 12 months: 4,134 (1,748 now married, 2,373 unmarried)
Housing units in zip code 12508 with a mortgage: 3,184 (261 second mortgage, 8 home equity loan, 201 both second mortgage and home equity loan) Houses without a mortgage: 137
Median monthly owner costs for units with a mortgage: $2,268 Median monthly owner costs for units without a mortgage: $966
Residents with income below the poverty level in 2022:
This zip code:
9.1%
Whole state:
14.3%
Residents with income below 50% of the poverty level in 2022:
This zip code:
4.6%
Whole state:
6.8%
Median number of rooms in houses and condos:
Here:
6.2
State:
6.3
Median number of rooms in apartments:
Here:
3.9
State:
3.8
Notable locations in this zip code not listed on our city pages
Notable locations in zip code 12508: Beacon Sewage Treatment Plant (A), Beacon Station (B), Southern Dutchess Country Club (C), Fishkill Correctional Facility (D), Matawan Correctional Facility (E), Beacon Fire Department Engine Company 1 (F), Howland Public Library (G), Beacon Fire Department Mase Hook and Ladder Company (H), Memorial Building (I), Saint Rocco Society Hall (J), Beacon Fire Department Lewis Tompkins Hose Company (K), Saint Francis - Beacon Extended Care Facility Nursing Home (L), Madam Brett Homestead (M), Dutchess Junction Fire Company (N). Display/hide their locations on the map
Churches in zip code 12508 include: Faith Temple Church of God (A), Saint James African Methodist Epsicopal Zion Church (B), The Oasis Church (C), Christ Church (D), Christ United Methodist Church (E), Springfield Baptist Church (F), Tabernacle Church of Christ (G), Saint Lukes Episcopal Church (H), First Presbyterian Church (I). Display/hide their locations on the map
Cemeteries: Saint Joachims Cemetery (1), Saint Lukes Cemetery (2), Saint Joachims Cemetery (3), Fairview Cemetery (4). Display/hide their locations on the map
Parks in zip code 12508 include: Mount Gulian Historic Site (1), Riverfront Park (2), Fountain Square (3), Hammond Plaza (4), Beacon Memorial Park Athletic Field (5), Lower Main Street Historic District (6). Display/hide their locations on the map
2,118 married couples with children.
903 single-parent households (244 men, 659 women).
83.2% of residents of 12508 zip code speak English at home.
11.7% of residents speak Spanish at home (64% very well, 21% well, 11% not well, 5% not at all).
3.0% of residents speak other Indo-European language at home (83% very well, 5% well, 12% not well).
0.7% of residents speak Asian or Pacific Island language at home (55% very well, 9% well, 37% not well).
1.0% of residents speak other language at home (95% very well, 5% well).
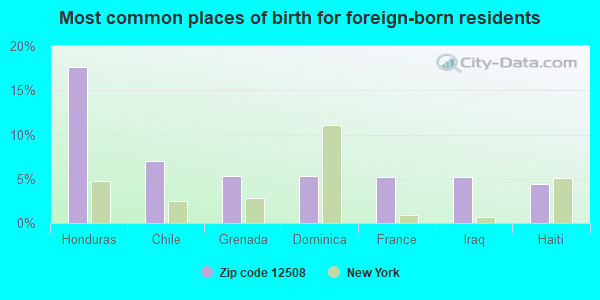
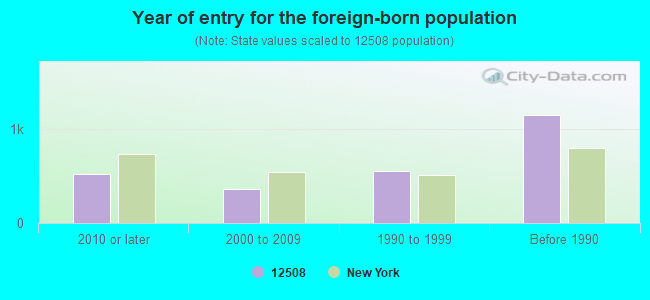
Foreign born population: 1,999 (10.6%) (58.6% of them are naturalized citizens)
This zip code:
10.6%
Whole state:
22.7%
18%Honduras
7%Chile
5%Grenada
5%Dominica
5%France
5%Iraq
4%Haiti
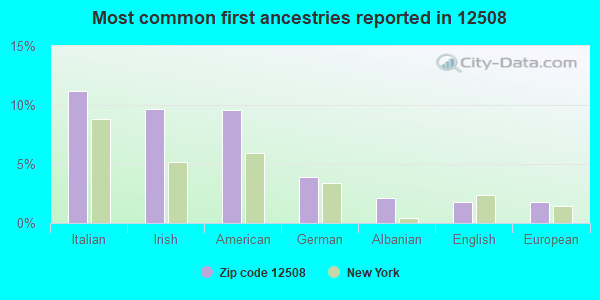
11%Italian
10%Irish
10%American
4%German
2%Albanian
2%English
2%European
Year of entry for the foreign-born population
5192010 or later
3662000 to 2009
5601990 to 1999
1,154Before 1990
Facilities with environmental interests located in this zip code:
HYDE PARK MOBILE MANOR ESTATES (P.O BOX 391 in BEACON, NY)
(Integrated Compliance Information System) - ICIS-02-2001-8048, FORMAL ENFORCEMENT ACTION Business SIC classification: WATER SUPPLY
CITY OF BEACON WATER DEPARTMENT (460 LIBERTY STREET in BEACON, NY)
(Integrated Compliance Information System) - ICIS-02-2003-8010, FORMAL ENFORCEMENT ACTION Business SIC classification: WATER SUPPLY
AMERICAN BURNISH INC (291 MAIN ST in BEACON, NY)
Conditionally Exempt Small Quantity Generators, less than 100 kg/month of hazardous waste (Resource Conservation and Recovery Act (tracking hazardous waste)) Organizations: DEBORAH H BIGELOW (CONTACT/OWNER)
CRAIG HOUSE HOSPITAL (300 HOWLAND AVENUE in BEACON, NY)
(Resource Conservation and Recovery Act (tracking hazardous waste))
HEALEY HYUNDAI INC (360 FISHKILL AVE in BEACON, NY)
Small Quantity Generators, between 100 kg and 1000 kg of hazardous waste/month (Resource Conservation and Recovery Act (tracking hazardous waste)) - notification Organizations: WILLIAM S HEALEY (CONTACT/OWNER)
HEALY CHEV GEO OLD INC (365 FISHKILL AVE in BEACON, NY)
Small Quantity Generators, between 100 kg and 1000 kg of hazardous waste/month (Resource Conservation and Recovery Act (tracking hazardous waste)) - notification Organizations: WILLIAM HEALY (CONTACT/OWNER)
Housing units lacking complete plumbing facilities: 0.1% Housing units lacking complete kitchen facilities: 0.1%
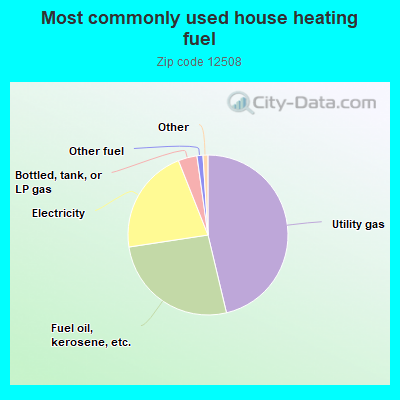
46.3%Utility gas
26.3%Fuel oil, kerosene, etc.
21.4%Electricity
3.8%Bottled, tank, or LP gas
1.2%Other fuel
Population in 1990: 20,022.
Place of birth for U.S.-born residents:
This state: 12,932
Northeast: 1,591
Midwest: 563
South: 738
West: 368
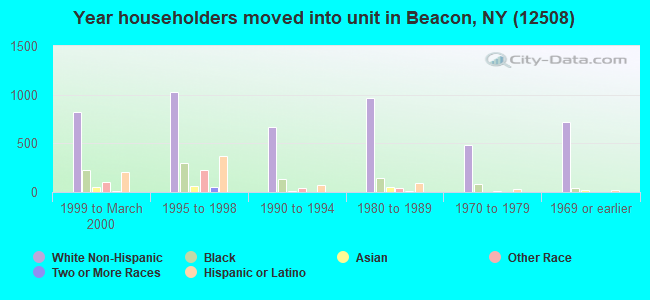
55% of the 12508 zip code residents lived in the same house 5 years ago. Out of people who lived in different houses, 52% lived in this county. Out of people who lived in different counties, 50% lived in New York.
86% of the 12508 zip code residents lived in the same house 1 year ago. Out of people who lived in different houses, 35% moved from this county. Out of people who lived in different houses, 58% moved from different county within same state. Out of people who lived in different houses, 7% moved from different state. Out of people who lived in different houses, 1% moved from abroad.
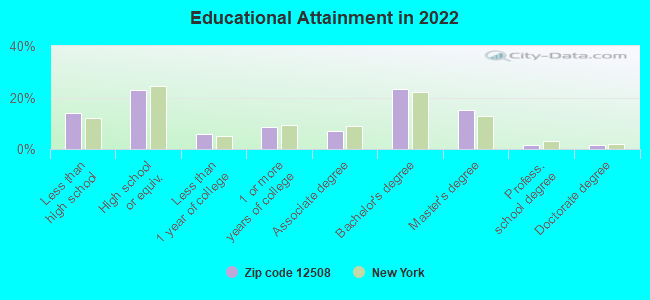
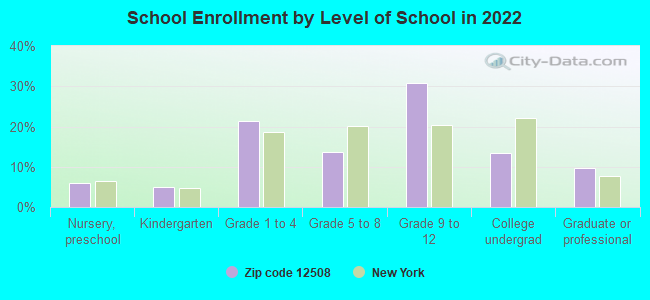
Private vs. public school enrollment:
Students in private schools in grades 1 to 8 (elementary and middle school): 122
Here:
9.5%
New York:
15.6%
Students in private schools in grades 9 to 12 (high school): 62
Here:
5.5%
New York:
15.0%
Students in private undergraduate colleges: 96
Here:
19.7%
New York:
39.2%
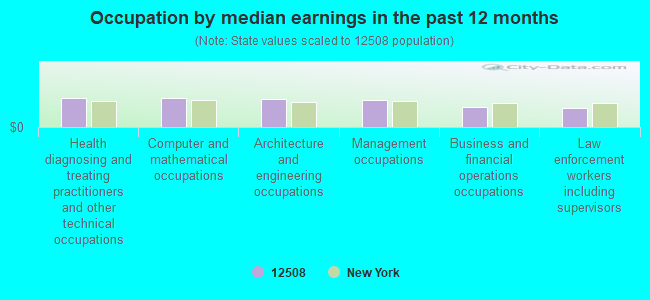
Occupation by median earnings in the past 12 months ($)
109,428Health diagnosing and treating practitioners and other technical occupations
106,843Computer and mathematical occupations
103,875Architecture and engineering occupations
102,468Management occupations
75,711Business and financial operations occupations
71,573Law enforcement workers including supervisors
Companies with federal contracts located in this zip code (BEACON, NY):
CAPITAL UNIFORM SERVICES, INC (39 FRONT ST; small business) : $116,467 in 10 contractsfrom 2003 to 2006
Contracts for Laundry and DryCleaning Services by Army Signed by year:2000: $0; 2001: $0; 2002: $0; 2003: $20,720; 2004: $60,266; 2005: $9,792; 2006: $25,689.
Biggest contracts:
$39,734 with Army for Laundry and DryCleaning Services. Signed on 2004-11-19. Completion date: 2004-09-30.
$25,689, same as above.Signed on 2006-02-07. Completion date: 2007-01-01.
$20,720, same as above.Signed on 2003-10-28. Completion date: 2004-09-30.
$17,026, same as above.Signed on 2004-03-30. Completion date: 2004-09-30.
NORTRAX INC (497 FISHKILL AVENUE; small business) : $80,791 in 10 contractsfrom 2000 to 2006
Contracts for Maintenance, Repair and Rebuilding of Equipment -- Tractors, Lease or Rental of Equipment -- Tractors, Miscellaneous Special Industry Machinery, Miscellaneous Engines and Components, and moreby U.S. Army Corps of Engineers - civil program financing only, Army, Saint Lawrence Seaway Development Corporation, U.S. Fish and Wildlife Service, and others Signed by year:2000: $25,500; 2001: $29,750; 2002: $32,580; 2003: -$28,200; 2004: $14,995; 2005: $0; 2006: $6,166.
Biggest contracts:
$32,580 with U.S. Army Corps of Engineers - civil program financing only for Maintenance, Repair and Rebuilding of Equipment -- Tractors. Taking place in VT. Signed on 2002-09-11. Completion date: 2002-10-11.
$29,750 with Army for Lease or Rental of Equipment -- Tractors. Signed on 2001-11-28. Completion date: 2001-11-30.
$25,500 with Army for Miscellaneous Special Industry Machinery. Taking place in MA. Signed on 2000-12-28. Completion date: 2001-02-15.
$10,633 with Saint Lawrence Seaway Development Corporation for Miscellaneous Engines and Components. Signed on 2004-04-27. Completion date: 2004-05-03.
VIRGINIA R KNOWLES (41 SYCAMORE DR; small business) : $12,860 in 2 contractsfrom 2002 to 2003
$9,450 with U.S. Army Corps of Engineers - civil program financing only for Other Research and Development -- Applied Research and Exploratory Development (R&D). Signed on 2002-04-10. Completion date: 2002-11-15.
$3,410, same as above.Signed on 2003-09-11. Completion date: 2003-11-27.
PAMAL BROADCASTING LTD (475 SOUTH AVE; small business)
$9,457 with Army for Military Personnel Recruitment. Signed on 2005-06-21. Completion date: 2005-07-18.
Top industries in this zip code by the number of employees in 2005:
Health Care and Social Assistance: Nursing Care Facilities (250-499 employees: 1 establishment, 100-249 employees: 1 establishment)
Health Care and Social Assistance: Specialty (except Psychiatric and Substance Abuse) Hospitals (100-249: 1)
2002 - 2018 National Fire Incident Reporting System (NFIRS) incidents
Based on the data from the years 2002 - 2018 the average number of fires per year is 44. The highest number of reported fires - 69 took place in 2007, and the least - 5 in 2005. The data has a rising trend.
When looking into fire subcategories, the most reports belonged to: Structure Fires (59.6%), and Outside Fires (29.3%).
Fire incident types reported to NFIRS in Zip Code 12508


 Nearest zip codes: 12527, 12512, 12524, 12520, 10516, 10996.


 Based on the data from the years 2002 - 2018 the average number of fires per year is 44. The highest number of reported fires - 69 took place in 2007, and the least - 5 in 2005. The data has a rising trend.
 When looking into fire subcategories, the most reports belonged to: Structure Fires (59.6%), and Outside Fires (29.3%).