Estimated zip code population in 2022: 9,149 Zip code population in 2010: 7,802 Zip code population in 2000: 6,633
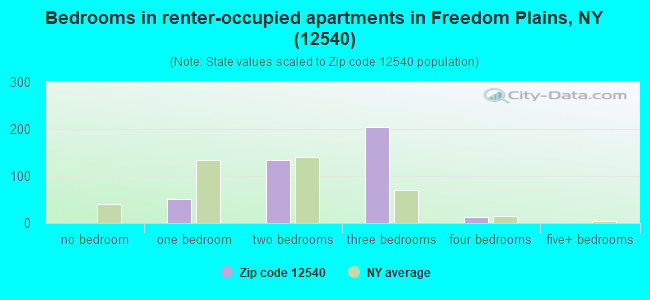
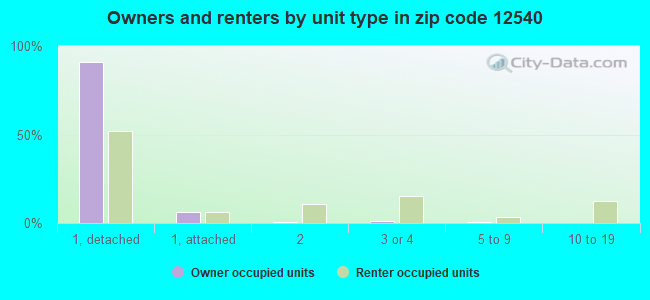
Houses and condos: 3,277 Renter-occupied apartments: 406
% of renters here:
13%
State:
46%
March 2022 cost of living index in zip code 12540: 135.1 (high, U.S. average is 100)
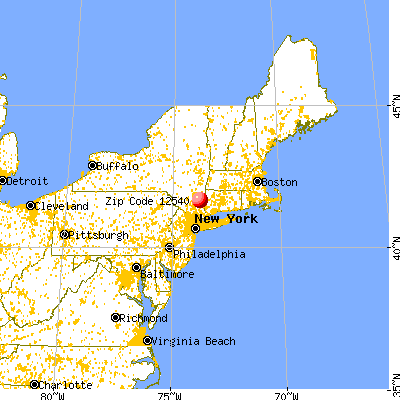
Land area: 34.1 sq. mi. Water area: 0.3 sq. mi.
Population density: 268 people per square mile
(very low).
OSM Map
General Map
Google Map
MSN Map
OSM Map
General Map
Google Map
MSN Map
OSM Map
General Map
Google Map
MSN Map
OSM Map
General Map
Google Map
MSN Map
Please wait while loading the map...
Real estate property taxes paid for housing units in 2022:
This zip code:
2.3% ($9,805)
New York:
1.5% ($6,180)
Median real estate property taxes paid for housing units with mortgages in 2022: $9,858 (2.1%) Median real estate property taxes paid for housing units with no mortgage in 2022: $8,247 (2.2%)
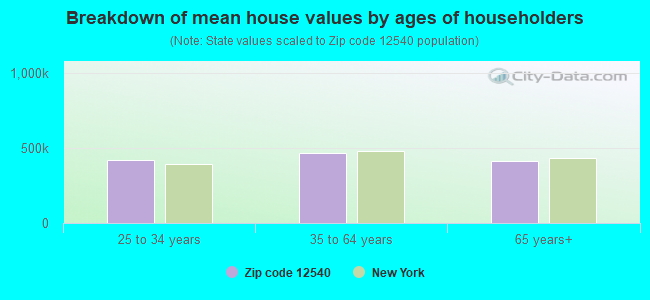
Estimated median house/condo value in 2022: $424,376
12540:
$424,376
New York:
$400,400
Median resident age:
This zip code:
39.9 years
New York median age:
40.0 years
Average household size:
This zip code:
2.9 people
New York:
2.5 people
Averages for the 2020 tax year for zip code 12540, filed in 2021:
Average Adjusted Gross Income (AGI) in 2020: $119,455 (Individual Income Tax Returns)
Here:
$119,455
State:
$90,930
Salary/wage: $99,769 (reported on 82.1% of returns)
Here:
$99,769
State:
$72,104
(% of AGI for various income ranges: 1313.0% for AGIs below $25k, 3474.0% for AGIs $25k-50k, 6595.6% for AGIs $50k-75k, 8996.8% for AGIs $75k-100k, 18733.7% for AGIs $100k-200k, 91005.3% for AGIs over 200k)
Taxable interest for individuals: $1,462 (reported on 50.9% of returns)
This zip code:
$1,462
New York:
$3,075
(% of AGI for various income ranges: 21.5% for AGIs below $25k, 50.0% for AGIs $25k-50k, 78.5% for AGIs $50k-75k, 117.2% for AGIs $75k-100k, 102.0% for AGIs $100k-200k, 868.2% for AGIs over 200k)
Ordinary dividends: $6,752 (reported on 32.5% of returns)
Here:
$6,752
State:
$11,095
(% of AGI for various income ranges: 35.6% for AGIs below $25k, 86.8% for AGIs $25k-50k, 131.5% for AGIs $50k-75k, 289.2% for AGIs $75k-100k, 443.1% for AGIs $100k-200k, 2659.4% for AGIs over 200k)
Net capital gain/loss in AGI: +$30,168 (reported on 27.5% of returns)
Here:
+$30,168
State:
+$44,925
(% of AGI for various income ranges: 14.1% for AGIs below $25k, 116.8% for AGIs $25k-50k, 33.5% for AGIs $50k-75k, 163.2% for AGIs $75k-100k, 429.4% for AGIs $100k-200k, 17283.5% for AGIs over 200k)
Profit/loss from business: +$22,198 (reported on 15.1% of returns)
Here:
+$22,198
State:
+$14,940
(% of AGI for various income ranges: 80.6% for AGIs below $25k, 193.8% for AGIs $25k-50k, 229.1% for AGIs $50k-75k, 271.2% for AGIs $75k-100k, 288.1% for AGIs $100k-200k, 5236.5% for AGIs over 200k)
Taxable individual retirement arrangement distribution: $20,400 (reported on 10.8% of returns)
12540:
$20,400
New York:
$19,609
(% of AGI for various income ranges: 69.8% for AGIs below $25k, 130.2% for AGIs $25k-50k, 232.1% for AGIs $50k-75k, 401.6% for AGIs $75k-100k, 640.7% for AGIs $100k-200k, 1465.3% for AGIs over 200k)
Self-employed (Keogh) retirement plans: $39,100 (reported on 0.8% of returns)
12540:
$39,100
New York:
$32,497
(% of AGI for various income ranges: 690.0% for AGIs over 200k)
Total itemized deductions: $29,935 (reported on 18.1% of returns)
Here:
$29,935
State:
$39,326
(% of AGI for various income ranges: 141.3% for AGIs below $25k, 318.8% for AGIs $25k-50k, 558.5% for AGIs $50k-75k, 1025.6% for AGIs $75k-100k, 1227.6% for AGIs $100k-200k, 4767.1% for AGIs over 200k)
Charity contributions: $6,820 (reported on 14.9% of returns)
Here:
$6,820
State:
$15,420
(% of AGI for various income ranges: 22.0% for AGIs $25k-50k, 76.8% for AGIs $50k-75k, 117.6% for AGIs $75k-100k, 183.0% for AGIs $100k-200k, 1394.7% for AGIs over 200k)
Taxes paid: $9,415 (reported on 17.9% of returns)
12540:
$9,415
State:
$9,183
(% of AGI for various income ranges: 41.5% for AGIs below $25k, 72.6% for AGIs $25k-50k, 195.3% for AGIs $50k-75k, 360.4% for AGIs $75k-100k, 450.0% for AGIs $100k-200k, 1237.1% for AGIs over 200k)
Earned income credit: $1,828 (reported on 6.3% of returns)
Here:
$1,828
State:
$2,138
(% of AGI for various income ranges: 49.6% for AGIs below $25k, 37.8% for AGIs $25k-50k)
Percentage of individuals using paid preparers for their 2020 taxes: 95.7%
Here:
96%
State:
95%
(% for various income ranges: 94.6% for AGIs below $25k, 95.6% for AGIs $25k-50k, 94.1% for AGIs $50k-75k, 94.9% for AGIs $75k-100k, 95.8% for AGIs $100k-200k, 100.0% for AGIs over 200k)
Averages for the 2012 tax year for zip code 12540, filed in 2013:
Average Adjusted Gross Income (AGI) in 2012: $99,047 (Individual Income Tax Returns)
Here:
$99,047
State:
$77,088
Salary/wage: $88,354 (reported on 84.7% of returns)
Here:
$88,354
State:
$60,593
(% of AGI for various income ranges: 72.6% for AGIs below $25k, 73.7% for AGIs $25k-50k, 73.3% for AGIs $50k-75k, 70.9% for AGIs $75k-100k, 80.2% for AGIs $100k-200k, 74.2% for AGIs over 200k)
Taxable interest for individuals: $1,597 (reported on 56.7% of returns)
This zip code:
$1,597
New York:
$3,125
(% of AGI for various income ranges: 1.4% for AGIs below $25k, 0.7% for AGIs $25k-50k, 1.2% for AGIs $50k-75k, 0.7% for AGIs $75k-100k, 0.6% for AGIs $100k-200k, 1.1% for AGIs over 200k)
Ordinary dividends: $5,038 (reported on 34.1% of returns)
Here:
$5,038
State:
$10,299
(% of AGI for various income ranges: 2.0% for AGIs below $25k, 1.4% for AGIs $25k-50k, 1.3% for AGIs $50k-75k, 1.7% for AGIs $75k-100k, 1.4% for AGIs $100k-200k, 2.1% for AGIs over 200k)
Net capital gain/loss in AGI: +$9,158 (reported on 23.4% of returns)
Here:
+$9,158
State:
+$42,474
(% of AGI for various income ranges: 1.3% for AGIs below $25k, 0.1% for AGIs $25k-50k, 0.4% for AGIs $50k-75k, 0.5% for AGIs $75k-100k, 1.3% for AGIs $100k-200k, 3.9% for AGIs over 200k)
Profit/loss from business: +$16,420 (reported on 15.0% of returns)
Here:
+$16,420
State:
+$16,168
(% of AGI for various income ranges: 5.8% for AGIs below $25k, 5.2% for AGIs $25k-50k, 1.4% for AGIs $50k-75k, 2.2% for AGIs $75k-100k, 2.5% for AGIs $100k-200k, 2.1% for AGIs over 200k)
Taxable individual retirement arrangement distribution: $16,946 (reported on 11.2% of returns)
12540:
$16,946
New York:
$17,621
(% of AGI for various income ranges: 3.3% for AGIs below $25k, 2.8% for AGIs $25k-50k, 2.2% for AGIs $50k-75k, 2.8% for AGIs $75k-100k, 1.4% for AGIs $100k-200k, 1.8% for AGIs over 200k)
Self-employment retirement plans: $23,625 (reported on 1.1% of returns)
12540:
$23,625
New York:
$27,330
Total itemized deductions: $33,041 (21% of AGI, reported on 55.6% of returns)
Here:
$33,041
State:
$34,985
Here:
21.1% of AGI
State:
21.3% of AGI
(% of AGI for various income ranges: 20.1% for AGIs below $25k, 16.9% for AGIs $25k-50k, 20.4% for AGIs $50k-75k, 24.0% for AGIs $75k-100k, 21.2% for AGIs $100k-200k, 15.0% for AGIs over 200k)
Charity contributions: $2,951 (reported on 48.5% of returns)
Here:
$2,951
State:
$5,572
(% of AGI for various income ranges: 0.9% for AGIs below $25k, 1.0% for AGIs $25k-50k, 1.6% for AGIs $50k-75k, 1.9% for AGIs $75k-100k, 1.8% for AGIs $100k-200k, 1.2% for AGIs over 200k)
Taxes paid: $18,809 (reported on 55.6% of returns)
12540:
$18,809
State:
$18,656
(% of AGI for various income ranges: 8.4% for AGIs below $25k, 7.6% for AGIs $25k-50k, 9.7% for AGIs $50k-75k, 11.3% for AGIs $75k-100k, 11.4% for AGIs $100k-200k, 10.5% for AGIs over 200k)
Earned income credit: $1,796 (reported on 7.1% of returns)
Here:
$1,796
State:
$2,230
(% of AGI for various income ranges: 2.7% for AGIs below $25k, 0.7% for AGIs $25k-50k)
Percentage of individuals using paid preparers for their 2012 taxes: 63.5%
Here:
63%
State:
66%
(% for various income ranges: 55.0% for AGIs below $25k, 65.5% for AGIs $25k-50k, 67.5% for AGIs $50k-75k, 70.5% for AGIs $75k-100k, 65.9% for AGIs $100k-200k, 68.8% for AGIs over 200k)
Averages for the 2004 tax year for zip code 12540, filed in 2005:
Average Adjusted Gross Income (AGI) in 2004: $75,365 (Individual Income Tax Returns)
Here:
$75,365
State:
$59,519
Salary/wage: $68,001 (reported on 83.8% of returns)
Here:
$68,001
State:
$50,673
(% of AGI for various income ranges: 175.0% for AGIs below $10k, 62.3% for AGIs $10k-25k, 76.4% for AGIs $25k-50k, 75.9% for AGIs $50k-75k, 80.5% for AGIs $75k-100k, 74.0% for AGIs over 100k)
Taxable interest for individuals: $1,416 (reported on 72.3% of returns)
This zip code:
$1,416
New York:
$2,377
(% of AGI for various income ranges: 15.6% for AGIs below $10k, 3.5% for AGIs $10k-25k, 2.1% for AGIs $25k-50k, 1.2% for AGIs $50k-75k, 1.6% for AGIs $75k-100k, 1.0% for AGIs over 100k)
Taxable dividends: $2,177 (reported on 42.7% of returns)
Here:
$2,177
State:
$5,394
(% of AGI for various income ranges: 10.7% for AGIs below $10k, 2.8% for AGIs $10k-25k, 1.2% for AGIs $25k-50k, 1.2% for AGIs $50k-75k, 0.9% for AGIs $75k-100k, 1.2% for AGIs over 100k)
Net capital gain/loss: +$7,699 (reported on 33.2% of returns)
Here:
+$7,699
State:
+$23,581
(% of AGI for various income ranges: -4.3% for AGIs below $10k, -0.2% for AGIs $10k-25k, 0.5% for AGIs $25k-50k, 1.0% for AGIs $50k-75k, 1.1% for AGIs $75k-100k, 5.0% for AGIs over 100k)
Profit/loss from business: +$17,304 (reported on 16.3% of returns)
Here:
+$17,304
State:
+$13,809
(% of AGI for various income ranges: 15.8% for AGIs below $10k, 8.8% for AGIs $10k-25k, 4.7% for AGIs $25k-50k, 3.3% for AGIs $50k-75k, 3.6% for AGIs $75k-100k, 3.4% for AGIs over 100k)
IRA payment deduction: $3,276 (reported on 3.8% of returns)
12540:
$3,276
New York:
$3,115
(% of AGI for various income ranges: 0.6% for AGIs $10k-25k, 0.4% for AGIs $25k-50k, 0.2% for AGIs $50k-75k, 0.2% for AGIs $75k-100k, 0.1% for AGIs over 100k)
Self-employed pension: $16,810 (reported on 1.6% of returns)
Here:
$16,810
New York:
$19,016
Total itemized deductions: $26,478 (23% of AGI, reported on 57.3% of returns)
Here:
$26,478
State:
$25,864
Here:
23.1% of AGI
State:
21.9% of AGI
(% of AGI for various income ranges: 27.2% for AGIs below $10k, 16.5% for AGIs $10k-25k, 19.0% for AGIs $25k-50k, 23.8% for AGIs $50k-75k, 22.5% for AGIs $75k-100k, 19.1% for AGIs over 100k)
Charity contributions deductions: $2,853 (2% of AGI, reported on 53.9% of returns)
Here:
$2,853
State:
$4,439
Here:
2.4% of AGI
State:
3.6% of AGI
(% of AGI for various income ranges: 1.2% for AGIs below $10k, 1.2% for AGIs $10k-25k, 1.6% for AGIs $25k-50k, 2.1% for AGIs $50k-75k, 2.2% for AGIs $75k-100k, 2.1% for AGIs over 100k)
Total tax: $12,670 (reported on 82.1% of returns)
12540:
$12,670
State:
$11,730
(% of AGI for various income ranges: 5.2% for AGIs below $10k, 5.1% for AGIs $10k-25k, 7.4% for AGIs $25k-50k, 7.9% for AGIs $50k-75k, 9.5% for AGIs $75k-100k, 17.2% for AGIs over 100k)
Earned income credit: $1,403 (reported on 4.9% of returns)
Here:
$1,403
State:
$1,757
Percentage of individuals using paid preparers for their 2004 taxes: 64.0%
Here:
64%
State:
67%
(% for various income ranges: 55.1% for AGIs below $10k, 62.5% for AGIs $10k-25k, 65.1% for AGIs $25k-50k, 70.0% for AGIs $50k-75k, 67.8% for AGIs $75k-100k, 65.3% for AGIs over 100k)
Household received Food Stamps/SNAP in the past 12 months: 101 Household did not receive Food Stamps/SNAP in the past 12 months: 2,994
Women who had a birth in the past 12 months: 134 (88 now married, 46 unmarried) Women who did not have a birth in the past 12 months: 1,843 (898 now married, 933 unmarried)
Housing units in zip code 12540 with a mortgage: 1,664 (182 second mortgage, 184 both second mortgage and home equity loan) Houses without a mortgage: 162
Median monthly owner costs for units with a mortgage: $2,824 Median monthly owner costs for units without a mortgage: $1,025
Residents with income below the poverty level in 2022:
This zip code:
5.8%
Whole state:
14.3%
Residents with income below 50% of the poverty level in 2022:
This zip code:
4.3%
Whole state:
6.8%
Median number of rooms in houses and condos:
Here:
7.5
State:
6.3
Median number of rooms in apartments:
Here:
5.6
State:
3.8
Notable locations in this zip code not listed on our city pages
Notable locations in zip code 12540: The Links at Union Vale (A), Elks Camp (B), Crouses Store (C), Beekman Library (D), Unionvale Town Offices (E), Union Vale Fire Company Station 2 (F), LaGrange Fire District Station 1 (G). Display/hide their locations on the map
Churches in zip code 12540 include: Full Gospel Center (A), Freedom Plains Presbyterian Church (B), All Saints Lutheran Church (C), Clove Valley Alliance Church (D), Valley Bible Fellowship Church (E), Trinity United Methodist Church (F), Blessed Kateri Tekakwitha Catholic Church (G), Oswego Church (H). Display/hide their locations on the map
1,824 married couples with children.
105 single-parent households (26 men, 79 women).
84.9% of residents of 12540 zip code speak English at home.
8.2% of residents speak Spanish at home (81% very well, 9% well, 10% not well).
3.1% of residents speak other Indo-European language at home (80% very well, 18% well, 2% not well).
1.0% of residents speak Asian or Pacific Island language at home (73% very well, 27% well).
2.0% of residents speak other language at home (97% very well, 3% not well).
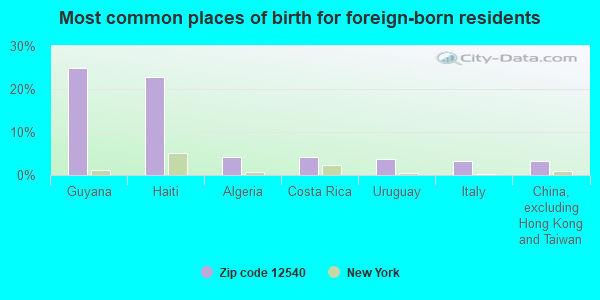
Foreign born population: 918 (10.0%) (57.8% of them are naturalized citizens)
This zip code:
10.0%
Whole state:
22.7%
25%Guyana
23%Haiti
4%Algeria
4%Costa Rica
4%Uruguay
3%Italy
3%China, excluding Hong Kong and Taiwan
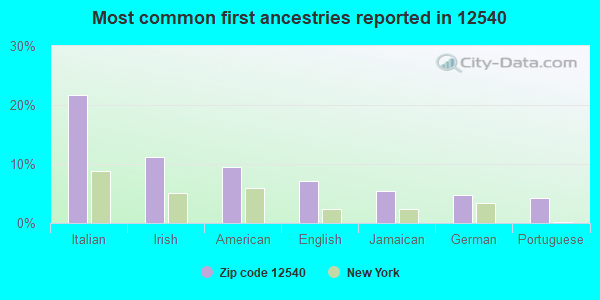
22%Italian
11%Irish
10%American
7%English
5%Jamaican
5%German
4%Portuguese
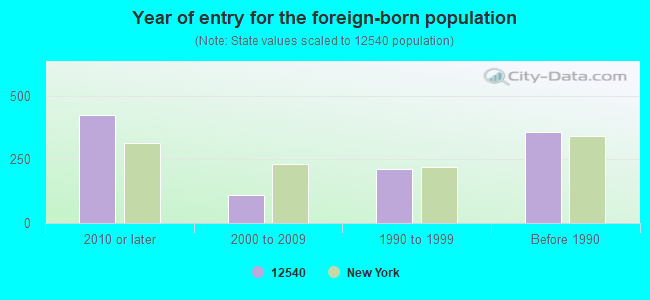
Year of entry for the foreign-born population
4242010 or later
1092000 to 2009
2121990 to 1999
358Before 1990
Facilities with environmental interests located in this zip code:
APPLE VALLEY SHOPPING CENTER (ROUTE 55 in LA GRANGE, NY)
(National Center for Education Statistics) - STATE ID-131601060008 Organizations: ARLINGTON CSD (SCHOOL DISTRICT)
HAMPTON NEWS (STRINGHAM RD in LAGRANGEVILLE, NY)
(Integrated Compliance Information System) - ICIS-02-2000-8203, FORMAL ENFORCEMENT ACTION Business SIC classification: WATER SUPPLY
GOLDEN CLEANERS INC (RTE 55 LEXINGTON PARK in LAGRANGEVILLE, NY)
AIR MINOR (AIRS/AFS) Small Quantity Generators, between 100 kg and 1000 kg of hazardous waste/month (Resource Conservation and Recovery Act (tracking hazardous waste)) - notification Business SIC classification: DRYCLEANING PLANTS, EXCEPT RUG CLEANING Organizations: NGO KIM (CONTACT/OWNER)
ARLINGTON CENTRAL SCHOOL DIST (110 STRINGHAM RD in LAGRANGEVILLE, NY)
(Resource Conservation and Recovery Act (tracking hazardous waste))
ARLINGTON CENTRAL SCHOOL DIST (144 TODD HILL RD in LAGRANGEVILLE, NY)
(Resource Conservation and Recovery Act (tracking hazardous waste))
GETTY SERVICE STATION (RTE 55 in LA GRANGE, NY)
(Resource Conservation and Recovery Act (tracking hazardous waste))
ARLINGTON HIGH SCHOOL NORTH CAMPUS (263 ROUTE 55 in LAGRANGEVILLE, NY)
Small Quantity Generators, between 100 kg and 1000 kg of hazardous waste/month (Resource Conservation and Recovery Act (tracking hazardous waste)) - notification Organizations: ARLINGTON CENTRAL SCHOOL DIST (CONTACT/OWNER)
Alternative names: ARLINGTON CENTRAL SCHOOL DIST
IROQUOIS GAS TRANSMISSION SYSTEM (68 MEDDAUGH RD in LAGRANGE, NY)
Conditionally Exempt Small Quantity Generators, less than 100 kg/month of hazardous waste (Resource Conservation and Recovery Act (tracking hazardous waste)) - notification
Housing units lacking complete kitchen facilities: 0.2%
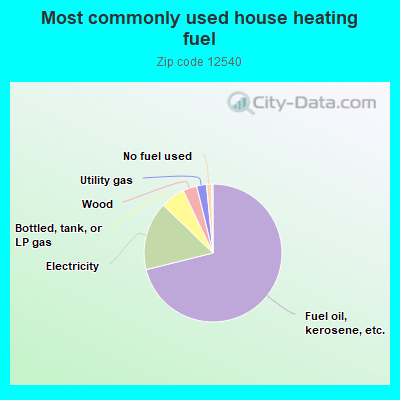
71.2%Fuel oil, kerosene, etc.
16.1%Electricity
5.7%Bottled, tank, or LP gas
3.3%Wood
2.3%Utility gas
1.2%No fuel used
Population in 1990: 5,539. Population change in the 1990s: +1,094 (+19.8%).
Place of birth for U.S.-born residents:
This state: 6,862
Northeast: 736
Midwest: 103
South: 174
West: 174
61% of the 12540 zip code residents lived in the same house 5 years ago. Out of people who lived in different houses, 46% lived in this county. Out of people who lived in different counties, 50% lived in New York.
90% of the 12540 zip code residents lived in the same house 1 year ago. Out of people who lived in different houses, 43% moved from this county. Out of people who lived in different houses, 41% moved from different county within same state. Out of people who lived in different houses, 16% moved from different state.
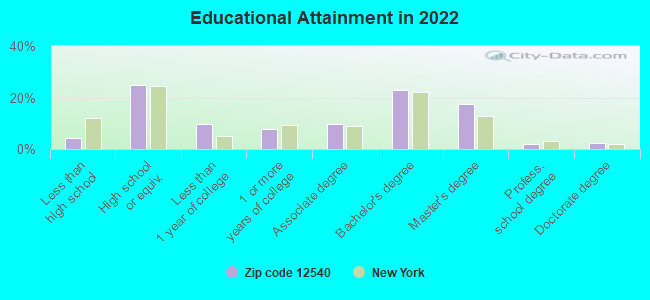
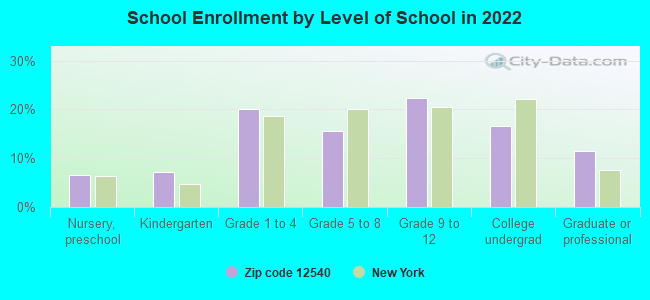
Private vs. public school enrollment:
Students in private schools in grades 1 to 8 (elementary and middle school): 76
Here:
8.2%
New York:
15.6%
Students in private schools in grades 9 to 12 (high school): 14
Here:
2.5%
New York:
15.0%
Students in private undergraduate colleges: 163
Here:
38.0%
New York:
39.2%
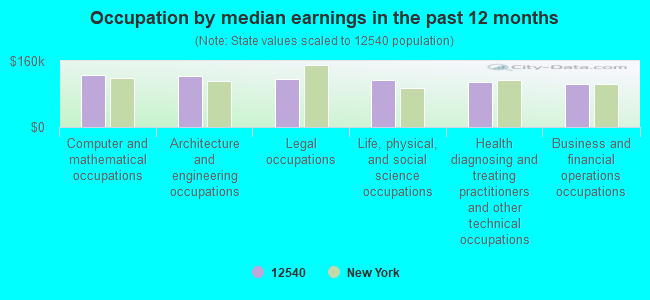
Occupation by median earnings in the past 12 months ($)
126,264Computer and mathematical occupations
124,428Architecture and engineering occupations
117,264Legal occupations
114,232Life, physical, and social science occupations
108,828Health diagnosing and treating practitioners and other technical occupations
103,899Business and financial operations occupations
Companies with federal contracts located in this zip code:
COMMAND SECURITY CORP (LEXINGTON PARK in LAGRANGEVILLE, NY) 3027 employees, $94314515 revenue: $188,174 in 3 contractsin 2001
$94,174 with Animal and Plant Health Inspection Service for Guard Services. Signed on 2001-09-15. Completion date: 1999-09-15.
$94,000 with Animal and Plant Health Inspection Service (disused code) for Guard Services. Signed on 2001-09-15. Completion date: 1999-09-15.
$0 with Animal and Plant Health Inspection Service for Guard Services. Signed on 2001-09-15. Completion date: 1999-09-15.
MACRO TOOL & MACHINE CO INC (1397 ROUTE 55 in LAGRANGEVILLE, NY; small business) : $22,679 in 3 contractsfrom 2002 to 2003
$8,519 with Army for Miscellaneous Power Transmission Equipment. Signed on 2003-05-09. Completion date: 2003-09-04.
$7,260 with Army for Gasoline Reciprocating Engines, Except Aircraft; and Components. Signed on 2002-10-24. Completion date: 2003-01-31.
$6,900 with Army for Guns, over 150 mm through 200 mm. Signed on 2002-10-24. Completion date: 2003-02-25.
Top industries in this zip code by the number of employees in 2005:
Construction: Commercial and Institutional Building Construction (100-249 employees: 1 establishment, 1-4 employees: 2 establishments)
Information: Cellular and Other Wireless Telecommunications (100-249: 1)
Accommodation and Food Services: Snack and Nonalcoholic Beverage Bars (50-99: 1, 10-19: 1)
Finance and Insurance: Real Estate Credit (50-99: 1, 10-19: 1)
Accommodation and Food Services: Full-Service Restaurants (20-49: 2, 1-4: 4)
Health Care and Social Assistance: Offices of Dentists (20-49: 1, 10-19: 1, 5-9: 2, 1-4: 2)
Health Care and Social Assistance: Residential Mental Retardation Facilities (20-49: 1, 10-19: 2, 1-4: 1)
Real Estate and Rental and Leasing: Offices of Real Estate Agents and Brokers (20-49: 1, 5-9: 3, 1-4: 4)
Construction: New Single-Family Housing Construction (except Operative Builders) (10-19: 2, 1-4: 12)
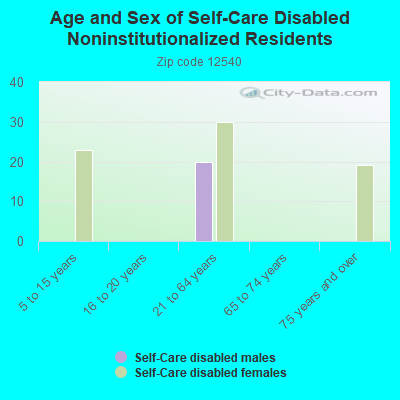
People in group quarters in 2010:
15 people in group homes intended for adults
10 people in group homes for juveniles (non-correctional)
People in group quarters in 2000:
16 people in other noninstitutional group quarters
10 people in other nonhousehold living situations
5 people in homes for the mentally retarded
Fatal accident statistics in 2014:
Fatal accident count: 1
Vehicles involved in fatal accidents: 1
Fatal accidents caused by drunken drivers: 0
Fatalities: 1
Persons involved in fatal accidents: 1
Pedestrians involved in fatal accidents: 0
Fatal accident statistics in 2013:
Fatal accident count: 1
Vehicles involved in fatal accidents: 1
Fatal accidents caused by drunken drivers: 0
Fatalities: 1
Persons involved in fatal accidents: 1
Pedestrians involved in fatal accidents: 0
Home Mortgage Disclosure Act Aggregated Statistics For Year 2009 (Based on 8 partial tracts)
A) FHA, FSA/RHS & VA Home Purchase Loans
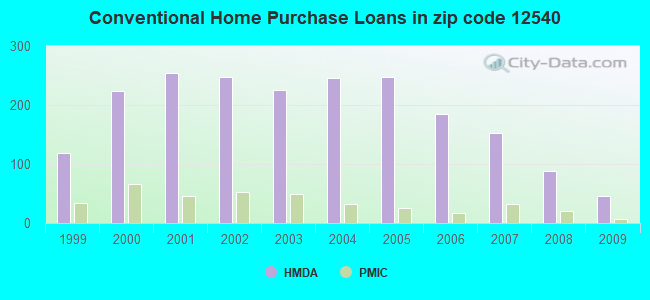
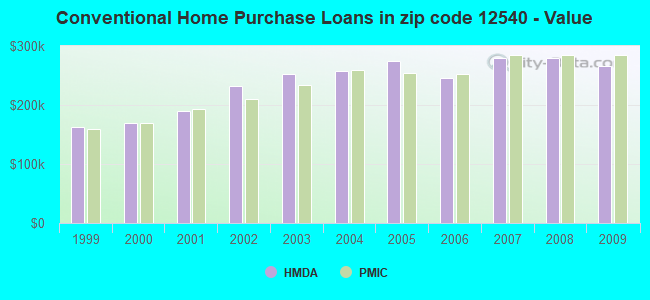
B) Conventional Home Purchase Loans
C) Refinancings
D) Home Improvement Loans
F) Non-occupant Loans on < 5 Family Dwellings (A B C & D)
G) Loans On Manufactured Home Dwelling (A B C & D)
Number
Average Value
Number
Average Value
Number
Average Value
Number
Average Value
Number
Average Value
Number
Average Value
LOANS ORIGINATED
28
$247,979
45
$265,541
264
$233,551
17
$98,655
10
$303,148
0
$0
APPLICATIONS APPROVED, NOT ACCEPTED
3
$300,400
4
$347,855
21
$297,112
1
$134,550
0
$0
0
$0
APPLICATIONS DENIED
7
$292,667
17
$233,688
111
$289,219
10
$90,628
3
$159,543
2
$26,495
APPLICATIONS WITHDRAWN
5
$227,090
9
$234,001
84
$261,041
2
$180,030
2
$152,395
0
$0
FILES CLOSED FOR INCOMPLETENESS
2
$239,610
1
$465,050
21
$356,489
1
$1,354,860
3
$640,010
0
$0
Aggregated Statistics For Year 2008 (Based on 8 partial tracts)
A) FHA, FSA/RHS & VA Home Purchase Loans
B) Conventional Home Purchase Loans
C) Refinancings
D) Home Improvement Loans
F) Non-occupant Loans on < 5 Family Dwellings (A B C & D)
G) Loans On Manufactured Home Dwelling (A B C & D)
Number
Average Value
Number
Average Value
Number
Average Value
Number
Average Value
Number
Average Value
Number
Average Value
LOANS ORIGINATED
15
$279,845
88
$279,507
153
$234,346
30
$91,378
8
$222,704
0
$0
APPLICATIONS APPROVED, NOT ACCEPTED
1
$245,620
17
$263,814
38
$298,189
4
$110,990
1
$334,650
1
$67,470
APPLICATIONS DENIED
4
$251,718
17
$278,314
135
$289,156
27
$79,493
7
$325,709
1
$33,340
APPLICATIONS WITHDRAWN
5
$211,606
17
$252,013
64
$274,323
6
$166,833
4
$124,828
0
$0
FILES CLOSED FOR INCOMPLETENESS
1
$174,100
4
$320,505
15
$302,669
2
$186,260
1
$295,600
1
$31,060
Aggregated Statistics For Year 2007 (Based on 8 partial tracts)
A) FHA, FSA/RHS & VA Home Purchase Loans
B) Conventional Home Purchase Loans
C) Refinancings
D) Home Improvement Loans
F) Non-occupant Loans on < 5 Family Dwellings (A B C & D)
G) Loans On Manufactured Home Dwelling (A B C & D)
Number
Average Value
Number
Average Value
Number
Average Value
Number
Average Value
Number
Average Value
Number
Average Value
LOANS ORIGINATED
3
$233,733
152
$279,003
204
$234,916
73
$99,707
16
$295,322
2
$65,515
APPLICATIONS APPROVED, NOT ACCEPTED
0
$0
33
$249,989
80
$288,022
13
$142,313
5
$292,444
0
$0
APPLICATIONS DENIED
1
$368,060
34
$239,493
202
$331,490
34
$169,019
7
$337,781
3
$57,133
APPLICATIONS WITHDRAWN
0
$0
31
$249,625
96
$267,765
19
$117,308
3
$441,147
0
$0
FILES CLOSED FOR INCOMPLETENESS
0
$0
7
$232,766
39
$301,924
5
$196,028
1
$602,160
0
$0
Aggregated Statistics For Year 2006 (Based on 8 partial tracts)
B) Conventional Home Purchase Loans
C) Refinancings
D) Home Improvement Loans
E) Loans on Dwellings For 5+ Families
F) Non-occupant Loans on < 5 Family Dwellings (A B C & D)
G) Loans On Manufactured Home Dwelling (A B C & D)
Number
Average Value
Number
Average Value
Number
Average Value
Number
Average Value
Number
Average Value
Number
Average Value
LOANS ORIGINATED
185
$246,391
274
$238,696
121
$98,928
0
$0
17
$384,639
2
$59,850
APPLICATIONS APPROVED, NOT ACCEPTED
28
$257,157
53
$291,124
14
$95,364
1
$406,460
1
$672,330
1
$11,210
APPLICATIONS DENIED
46
$250,239
177
$303,870
48
$125,763
0
$0
4
$218,765
3
$33,917
APPLICATIONS WITHDRAWN
34
$230,194
142
$258,135
21
$99,842
0
$0
3
$178,047
1
$35,130
FILES CLOSED FOR INCOMPLETENESS
10
$269,289
38
$353,268
4
$79,548
0
$0
0
$0
0
$0
Aggregated Statistics For Year 2005 (Based on 8 partial tracts)
A) FHA, FSA/RHS & VA Home Purchase Loans
B) Conventional Home Purchase Loans
C) Refinancings
D) Home Improvement Loans
F) Non-occupant Loans on < 5 Family Dwellings (A B C & D)
G) Loans On Manufactured Home Dwelling (A B C & D)
Number
Average Value
Number
Average Value
Number
Average Value
Number
Average Value
Number
Average Value
Number
Average Value
LOANS ORIGINATED
0
$0
248
$274,517
342
$232,555
104
$97,085
18
$245,808
2
$93,030
APPLICATIONS APPROVED, NOT ACCEPTED
0
$0
42
$327,912
74
$246,277
11
$47,440
3
$327,967
1
$59,850
APPLICATIONS DENIED
0
$0
40
$309,112
178
$271,848
45
$110,799
5
$282,720
2
$93,125
APPLICATIONS WITHDRAWN
1
$191,520
42
$285,637
157
$241,808
42
$175,200
6
$225,507
0
$0
FILES CLOSED FOR INCOMPLETENESS
0
$0
13
$272,494
82
$278,282
1
$156,400
1
$238,980
1
$134,250
Aggregated Statistics For Year 2004 (Based on 8 partial tracts)
A) FHA, FSA/RHS & VA Home Purchase Loans
B) Conventional Home Purchase Loans
C) Refinancings
D) Home Improvement Loans
F) Non-occupant Loans on < 5 Family Dwellings (A B C & D)
G) Loans On Manufactured Home Dwelling (A B C & D)
Number
Average Value
Number
Average Value
Number
Average Value
Number
Average Value
Number
Average Value
Number
Average Value
LOANS ORIGINATED
3
$203,170
246
$258,340
408
$202,613
76
$87,797
22
$370,267
3
$70,440
APPLICATIONS APPROVED, NOT ACCEPTED
0
$0
37
$257,755
89
$224,279
13
$53,017
5
$207,074
2
$68,170
APPLICATIONS DENIED
0
$0
51
$261,168
160
$243,463
47
$90,094
6
$328,505
10
$52,416
APPLICATIONS WITHDRAWN
0
$0
32
$253,123
171
$221,447
29
$86,577
7
$236,351
1
$38,620
FILES CLOSED FOR INCOMPLETENESS
0
$0
5
$276,242
88
$211,591
6
$55,088
1
$157,820
0
$0
Aggregated Statistics For Year 2003 (Based on 8 partial tracts)
A) FHA, FSA/RHS & VA Home Purchase Loans
B) Conventional Home Purchase Loans
C) Refinancings
D) Home Improvement Loans
E) Loans on Dwellings For 5+ Families
F) Non-occupant Loans on < 5 Family Dwellings (A B C & D)
Number
Average Value
Number
Average Value
Number
Average Value
Number
Average Value
Number
Average Value
Number
Average Value
LOANS ORIGINATED
3
$185,973
225
$252,581
896
$180,878
36
$49,145
0
$0
18
$158,307
APPLICATIONS APPROVED, NOT ACCEPTED
1
$245,870
38
$263,798
152
$188,479
9
$41,420
0
$0
2
$236,360
APPLICATIONS DENIED
1
$218,780
31
$152,309
227
$191,022
24
$39,373
1
$870,840
5
$130,662
APPLICATIONS WITHDRAWN
0
$0
32
$255,353
199
$200,875
13
$43,172
0
$0
4
$164,380
FILES CLOSED FOR INCOMPLETENESS
0
$0
9
$267,033
39
$218,338
3
$62,837
0
$0
1
$133,500
Aggregated Statistics For Year 2002 (Based on 8 partial tracts)
A) FHA, FSA/RHS & VA Home Purchase Loans
B) Conventional Home Purchase Loans
C) Refinancings
D) Home Improvement Loans
F) Non-occupant Loans on < 5 Family Dwellings (A B C & D)
Number
Average Value
Number
Average Value
Number
Average Value
Number
Average Value
Number
Average Value
LOANS ORIGINATED
10
$183,231
248
$232,622
550
$163,349
38
$27,450
16
$234,460
APPLICATIONS APPROVED, NOT ACCEPTED
0
$0
32
$286,038
96
$164,107
12
$33,512
1
$846,010
APPLICATIONS DENIED
1
$128,440
24
$215,054
131
$160,781
28
$40,252
2
$68,400
APPLICATIONS WITHDRAWN
1
$109,520
23
$205,459
114
$154,992
22
$60,190
2
$125,905
FILES CLOSED FOR INCOMPLETENESS
0
$0
8
$259,626
54
$172,245
1
$36,590
0
$0
Aggregated Statistics For Year 2001 (Based on 8 partial tracts)
A) FHA, FSA/RHS & VA Home Purchase Loans
B) Conventional Home Purchase Loans
C) Refinancings
D) Home Improvement Loans
E) Loans on Dwellings For 5+ Families
F) Non-occupant Loans on < 5 Family Dwellings (A B C & D)
Number
Average Value
Number
Average Value
Number
Average Value
Number
Average Value
Number
Average Value
Number
Average Value
LOANS ORIGINATED
12
$135,406
254
$189,140
357
$147,538
34
$42,810
1
$167,080
6
$240,847
APPLICATIONS APPROVED, NOT ACCEPTED
1
$92,020
35
$200,484
55
$134,854
13
$43,645
0
$0
2
$524,355
APPLICATIONS DENIED
2
$252,160
22
$160,014
147
$151,371
21
$25,935
0
$0
3
$112,997
APPLICATIONS WITHDRAWN
4
$133,478
15
$181,210
133
$145,316
20
$37,094
0
$0
2
$191,685
FILES CLOSED FOR INCOMPLETENESS
1
$214,350
6
$176,415
22
$165,705
4
$29,278
0
$0
0
$0
Aggregated Statistics For Year 2000 (Based on 8 partial tracts)
A) FHA, FSA/RHS & VA Home Purchase Loans
B) Conventional Home Purchase Loans
C) Refinancings
D) Home Improvement Loans
E) Loans on Dwellings For 5+ Families
F) Non-occupant Loans on < 5 Family Dwellings (A B C & D)
Number
Average Value
Number
Average Value
Number
Average Value
Number
Average Value
Number
Average Value
Number
Average Value
LOANS ORIGINATED
15
$135,809
224
$168,758
118
$93,983
43
$30,538
1
$39,490
9
$121,503
APPLICATIONS APPROVED, NOT ACCEPTED
0
$0
24
$170,763
31
$96,102
14
$52,552
0
$0
2
$79,995
APPLICATIONS DENIED
3
$88,267
42
$142,652
90
$105,249
20
$40,010
0
$0
4
$65,205
APPLICATIONS WITHDRAWN
1
$65,180
22
$144,157
77
$73,965
6
$53,608
0
$0
3
$115,913
FILES CLOSED FOR INCOMPLETENESS
0
$0
4
$198,720
27
$139,827
1
$18,400
0
$0
1
$135,180
Aggregated Statistics For Year 1999 (Based on 4 partial tracts)
A) FHA, FSA/RHS & VA Home Purchase Loans
B) Conventional Home Purchase Loans
C) Refinancings
D) Home Improvement Loans
E) Loans on Dwellings For 5+ Families
F) Non-occupant Loans on < 5 Family Dwellings (A B C & D)
2002 - 2018 National Fire Incident Reporting System (NFIRS) incidents
Based on the data from the years 2002 - 2018 the average number of fires per year is 25. The highest number of fires - 66 took place in 2015, and the least - 7 in 2010. The data has a growing trend.
When looking into fire subcategories, the most incidents belonged to: Structure Fires (58.8%), and Outside Fires (26.4%).
Fire incident types reported to NFIRS in Zip Code 12540


 Nearest zip codes: 12585, 12570, 12569, 12545, 12533, 12582.


 Based on the data from the years 2002 - 2018 the average number of fires per year is 25. The highest number of fires - 66 took place in 2015, and the least - 7 in 2010. The data has a growing trend.
 When looking into fire subcategories, the most incidents belonged to: Structure Fires (58.8%), and Outside Fires (26.4%).