Estimated zip code population in 2022: 25,832 Zip code population in 2010: 25,307 Zip code population in 2000: 22,254
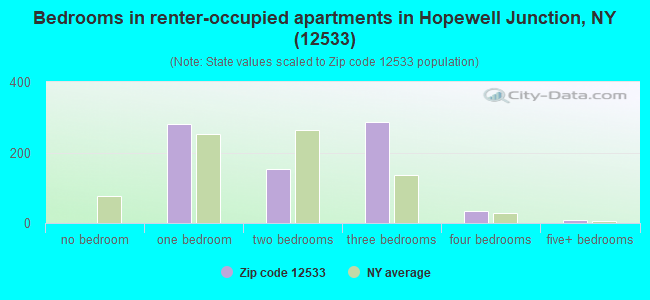
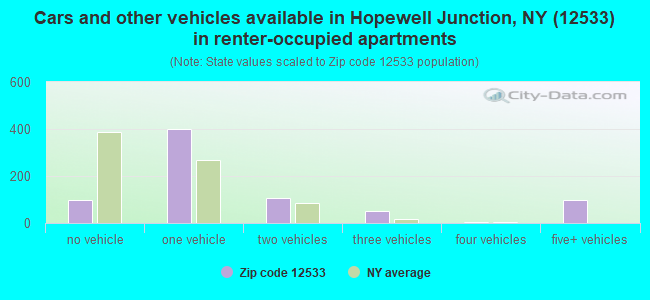
Houses and condos: 9,437 Renter-occupied apartments: 766
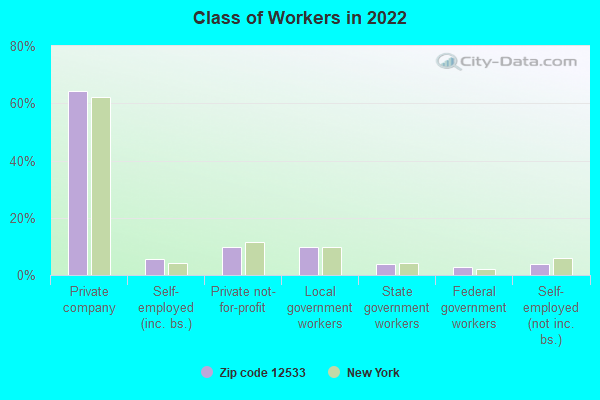
% of renters here:
9%
State:
46%
March 2022 cost of living index in zip code 12533: 133.1 (high, U.S. average is 100)
Land area: 48.6 sq. mi. Water area: 0.8 sq. mi.
Population density: 531 people per square mile
(low).
OSM Map
General Map
Google Map
MSN Map
OSM Map
General Map
Google Map
MSN Map
OSM Map
General Map
Google Map
MSN Map
OSM Map
General Map
Google Map
MSN Map
Please wait while loading the map...
Real estate property taxes paid for housing units in 2022:
This zip code:
1.9% ($8,086)
New York:
1.5% ($6,180)
Median real estate property taxes paid for housing units with mortgages in 2022: $8,499 (1.9%) Median real estate property taxes paid for housing units with no mortgage in 2022: $7,310 (1.9%)
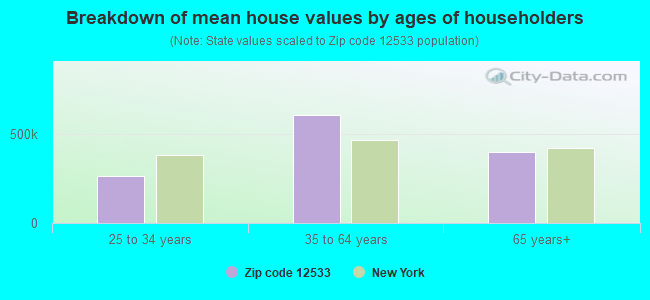
Estimated median house/condo value in 2022: $427,295
12533:
$427,295
New York:
$400,400
According to our research of New York and other state lists, there were 3 registered sex offenders living in 12533 zip code as of April 27, 2024. The ratio of all residents to sex offenders in zip code 12533 is 8,714 to 1. The ratio of registered sex offenders to all residents in this zip code is much lower than the state average.
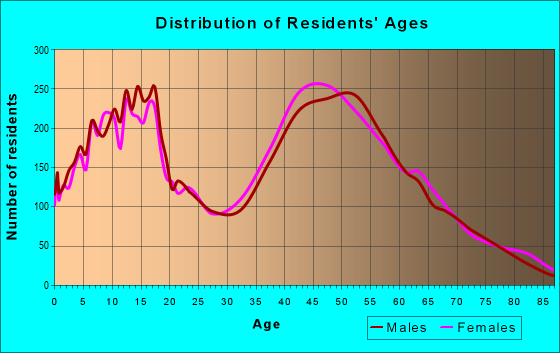
Median resident age:
This zip code:
41.9 years
New York median age:
40.0 years
Average household size:
This zip code:
2.9 people
New York:
2.5 people
Averages for the 2020 tax year for zip code 12533, filed in 2021:
Average Adjusted Gross Income (AGI) in 2020: $107,560 (Individual Income Tax Returns)
Here:
$107,560
State:
$90,930
Salary/wage: $90,898 (reported on 83.0% of returns)
Here:
$90,898
State:
$72,104
(% of AGI for various income ranges: 1160.8% for AGIs below $25k, 3560.9% for AGIs $25k-50k, 6267.9% for AGIs $50k-75k, 9466.5% for AGIs $75k-100k, 18308.6% for AGIs $100k-200k, 71569.5% for AGIs over 200k)
Taxable interest for individuals: $1,176 (reported on 49.3% of returns)
This zip code:
$1,176
New York:
$3,075
(% of AGI for various income ranges: 18.9% for AGIs below $25k, 38.3% for AGIs $25k-50k, 57.7% for AGIs $50k-75k, 80.9% for AGIs $75k-100k, 133.0% for AGIs $100k-200k, 478.7% for AGIs over 200k)
Ordinary dividends: $5,119 (reported on 31.0% of returns)
Here:
$5,119
State:
$11,095
(% of AGI for various income ranges: 32.4% for AGIs below $25k, 57.2% for AGIs $25k-50k, 124.0% for AGIs $50k-75k, 201.2% for AGIs $75k-100k, 357.4% for AGIs $100k-200k, 1618.8% for AGIs over 200k)
Net capital gain/loss in AGI: +$24,149 (reported on 27.0% of returns)
Here:
+$24,149
State:
+$44,925
(% of AGI for various income ranges: 19.1% for AGIs below $25k, 54.3% for AGIs $25k-50k, 121.1% for AGIs $50k-75k, 132.6% for AGIs $75k-100k, 375.5% for AGIs $100k-200k, 12818.3% for AGIs over 200k)
Profit/loss from business: +$15,707 (reported on 15.1% of returns)
Here:
+$15,707
State:
+$14,940
(% of AGI for various income ranges: 97.0% for AGIs below $25k, 143.2% for AGIs $25k-50k, 229.2% for AGIs $50k-75k, 230.9% for AGIs $75k-100k, 421.3% for AGIs $100k-200k, 2465.3% for AGIs over 200k)
Taxable individual retirement arrangement distribution: $21,687 (reported on 9.9% of returns)
12533:
$21,687
New York:
$19,609
(% of AGI for various income ranges: 45.5% for AGIs below $25k, 110.8% for AGIs $25k-50k, 209.5% for AGIs $50k-75k, 354.9% for AGIs $75k-100k, 569.7% for AGIs $100k-200k, 1646.5% for AGIs over 200k)
Self-employed (Keogh) retirement plans: $23,257 (reported on 1.0% of returns)
12533:
$23,257
New York:
$32,497
(% of AGI for various income ranges: 14.9% for AGIs $25k-50k, 42.7% for AGIs $100k-200k, 369.5% for AGIs over 200k)
Total itemized deductions: $29,159 (reported on 17.6% of returns)
Here:
$29,159
State:
$39,326
(% of AGI for various income ranges: 109.0% for AGIs below $25k, 193.5% for AGIs $25k-50k, 524.6% for AGIs $50k-75k, 877.0% for AGIs $75k-100k, 1360.0% for AGIs $100k-200k, 3977.3% for AGIs over 200k)
Charity contributions: $5,606 (reported on 15.0% of returns)
Here:
$5,606
State:
$15,420
(% of AGI for various income ranges: 5.0% for AGIs below $25k, 15.0% for AGIs $25k-50k, 50.7% for AGIs $50k-75k, 84.5% for AGIs $75k-100k, 209.8% for AGIs $100k-200k, 942.7% for AGIs over 200k)
Taxes paid: $9,446 (reported on 17.6% of returns)
12533:
$9,446
State:
$9,183
(% of AGI for various income ranges: 29.6% for AGIs below $25k, 64.7% for AGIs $25k-50k, 182.6% for AGIs $50k-75k, 330.5% for AGIs $75k-100k, 466.5% for AGIs $100k-200k, 1126.0% for AGIs over 200k)
Earned income credit: $1,676 (reported on 6.5% of returns)
Here:
$1,676
State:
$2,138
(% of AGI for various income ranges: 41.6% for AGIs below $25k, 37.0% for AGIs $25k-50k)
Percentage of individuals using paid preparers for their 2020 taxes: 95.4%
Here:
95%
State:
95%
(% for various income ranges: 94.4% for AGIs below $25k, 95.8% for AGIs $25k-50k, 95.3% for AGIs $50k-75k, 95.1% for AGIs $75k-100k, 95.7% for AGIs $100k-200k, 96.4% for AGIs over 200k)
Averages for the 2012 tax year for zip code 12533, filed in 2013:
Average Adjusted Gross Income (AGI) in 2012: $89,480 (Individual Income Tax Returns)
Here:
$89,480
State:
$77,088
Salary/wage: $80,340 (reported on 85.8% of returns)
Here:
$80,340
State:
$60,593
(% of AGI for various income ranges: 73.1% for AGIs below $25k, 73.2% for AGIs $25k-50k, 73.1% for AGIs $50k-75k, 75.1% for AGIs $75k-100k, 80.8% for AGIs $100k-200k, 75.6% for AGIs over 200k)
Taxable interest for individuals: $1,006 (reported on 55.7% of returns)
This zip code:
$1,006
New York:
$3,125
(% of AGI for various income ranges: 1.6% for AGIs below $25k, 1.1% for AGIs $25k-50k, 0.8% for AGIs $50k-75k, 0.5% for AGIs $75k-100k, 0.5% for AGIs $100k-200k, 0.6% for AGIs over 200k)
Ordinary dividends: $3,731 (reported on 32.8% of returns)
Here:
$3,731
State:
$10,299
(% of AGI for various income ranges: 2.4% for AGIs below $25k, 1.6% for AGIs $25k-50k, 1.4% for AGIs $50k-75k, 1.1% for AGIs $75k-100k, 1.0% for AGIs $100k-200k, 1.7% for AGIs over 200k)
Net capital gain/loss in AGI: +$8,001 (reported on 24.5% of returns)
Here:
+$8,001
State:
+$42,474
(% of AGI for various income ranges: 0.4% for AGIs $25k-50k, 0.4% for AGIs $50k-75k, 0.4% for AGIs $75k-100k, 1.0% for AGIs $100k-200k, 5.2% for AGIs over 200k)
Profit/loss from business: +$14,404 (reported on 15.4% of returns)
Here:
+$14,404
State:
+$16,168
(% of AGI for various income ranges: 7.1% for AGIs below $25k, 3.7% for AGIs $25k-50k, 2.8% for AGIs $50k-75k, 1.7% for AGIs $75k-100k, 2.2% for AGIs $100k-200k, 2.3% for AGIs over 200k)
Taxable individual retirement arrangement distribution: $15,840 (reported on 11.2% of returns)
12533:
$15,840
New York:
$17,621
(% of AGI for various income ranges: 3.4% for AGIs below $25k, 2.9% for AGIs $25k-50k, 2.8% for AGIs $50k-75k, 2.5% for AGIs $75k-100k, 2.0% for AGIs $100k-200k, 1.2% for AGIs over 200k)
Self-employment retirement plans: $21,118 (reported on 0.9% of returns)
12533:
$21,118
New York:
$27,330
(% of AGI for various income ranges: 0.4% for AGIs $25k-50k, 0.2% for AGIs $100k-200k, 0.4% for AGIs over 200k)
Total itemized deductions: $30,102 (22% of AGI, reported on 54.9% of returns)
Here:
$30,102
State:
$34,985
Here:
21.7% of AGI
State:
21.3% of AGI
(% of AGI for various income ranges: 16.0% for AGIs below $25k, 16.8% for AGIs $25k-50k, 20.3% for AGIs $50k-75k, 20.7% for AGIs $75k-100k, 20.5% for AGIs $100k-200k, 15.5% for AGIs over 200k)
Charity contributions: $2,721 (reported on 47.8% of returns)
Here:
$2,721
State:
$5,572
(% of AGI for various income ranges: 0.7% for AGIs below $25k, 1.1% for AGIs $25k-50k, 1.4% for AGIs $50k-75k, 1.5% for AGIs $75k-100k, 1.7% for AGIs $100k-200k, 1.3% for AGIs over 200k)
Taxes paid: $15,422 (reported on 54.7% of returns)
12533:
$15,422
State:
$18,656
(% of AGI for various income ranges: 5.5% for AGIs below $25k, 6.7% for AGIs $25k-50k, 8.2% for AGIs $50k-75k, 9.3% for AGIs $75k-100k, 10.2% for AGIs $100k-200k, 9.9% for AGIs over 200k)
Earned income credit: $1,763 (reported on 7.4% of returns)
Here:
$1,763
State:
$2,230
(% of AGI for various income ranges: 3.0% for AGIs below $25k, 0.7% for AGIs $25k-50k)
Percentage of individuals using paid preparers for their 2012 taxes: 63.7%
Here:
64%
State:
66%
(% for various income ranges: 56.2% for AGIs below $25k, 60.3% for AGIs $25k-50k, 68.6% for AGIs $50k-75k, 69.1% for AGIs $75k-100k, 68.7% for AGIs $100k-200k, 66.7% for AGIs over 200k)
Averages for the 2004 tax year for zip code 12533, filed in 2005:
Average Adjusted Gross Income (AGI) in 2004: $69,558 (Individual Income Tax Returns)
Here:
$69,558
State:
$59,519
Salary/wage: $64,450 (reported on 86.1% of returns)
Here:
$64,450
State:
$50,673
(% of AGI for various income ranges: 133.5% for AGIs below $10k, 69.1% for AGIs $10k-25k, 77.5% for AGIs $25k-50k, 79.8% for AGIs $50k-75k, 84.4% for AGIs $75k-100k, 78.8% for AGIs over 100k)
Taxable interest for individuals: $1,073 (reported on 69.5% of returns)
This zip code:
$1,073
New York:
$2,377
(% of AGI for various income ranges: 9.3% for AGIs below $10k, 2.7% for AGIs $10k-25k, 1.5% for AGIs $25k-50k, 1.2% for AGIs $50k-75k, 0.9% for AGIs $75k-100k, 0.8% for AGIs over 100k)
Taxable dividends: $2,272 (reported on 39.7% of returns)
Here:
$2,272
State:
$5,394
(% of AGI for various income ranges: 5.7% for AGIs below $10k, 1.5% for AGIs $10k-25k, 1.3% for AGIs $25k-50k, 1.0% for AGIs $50k-75k, 0.8% for AGIs $75k-100k, 1.4% for AGIs over 100k)
Net capital gain/loss: +$7,365 (reported on 30.6% of returns)
Here:
+$7,365
State:
+$23,581
(% of AGI for various income ranges: -4.8% for AGIs below $10k, -0.6% for AGIs $10k-25k, 0.0% for AGIs $25k-50k, 0.4% for AGIs $50k-75k, 0.7% for AGIs $75k-100k, 5.5% for AGIs over 100k)
Profit/loss from business: +$13,711 (reported on 15.4% of returns)
Here:
+$13,711
State:
+$13,809
(% of AGI for various income ranges: 8.4% for AGIs below $10k, 8.3% for AGIs $10k-25k, 4.4% for AGIs $25k-50k, 3.0% for AGIs $50k-75k, 2.4% for AGIs $75k-100k, 2.6% for AGIs over 100k)
IRA payment deduction: $3,410 (reported on 3.8% of returns)
12533:
$3,410
New York:
$3,115
(% of AGI for various income ranges: 0.4% for AGIs $10k-25k, 0.4% for AGIs $25k-50k, 0.3% for AGIs $50k-75k, 0.2% for AGIs $75k-100k, 0.1% for AGIs over 100k)
Self-employed pension: $17,331 (reported on 1.3% of returns)
Here:
$17,331
New York:
$19,016
(% of AGI for various income ranges: 0.1% for AGIs $25k-50k, 0.1% for AGIs $50k-75k, 0.2% for AGIs $75k-100k, 0.5% for AGIs over 100k)
Total itemized deductions: $24,523 (23% of AGI, reported on 56.0% of returns)
Here:
$24,523
State:
$25,864
Here:
23.2% of AGI
State:
21.9% of AGI
(% of AGI for various income ranges: 14.8% for AGIs below $10k, 15.2% for AGIs $10k-25k, 18.7% for AGIs $25k-50k, 22.3% for AGIs $50k-75k, 23.3% for AGIs $75k-100k, 18.6% for AGIs over 100k)
Charity contributions deductions: $2,674 (2% of AGI, reported on 52.5% of returns)
Here:
$2,674
State:
$4,439
Here:
2.5% of AGI
State:
3.6% of AGI
(% of AGI for various income ranges: 0.7% for AGIs below $10k, 0.9% for AGIs $10k-25k, 1.6% for AGIs $25k-50k, 2.3% for AGIs $50k-75k, 2.3% for AGIs $75k-100k, 2.0% for AGIs over 100k)
Total tax: $10,594 (reported on 83.0% of returns)
12533:
$10,594
State:
$11,730
(% of AGI for various income ranges: 4.3% for AGIs below $10k, 5.0% for AGIs $10k-25k, 7.3% for AGIs $25k-50k, 8.2% for AGIs $50k-75k, 8.9% for AGIs $75k-100k, 16.2% for AGIs over 100k)
Earned income credit: $1,396 (reported on 5.5% of returns)
Here:
$1,396
State:
$1,757
Percentage of individuals using paid preparers for their 2004 taxes: 63.6%
Here:
64%
State:
67%
(% for various income ranges: 53.1% for AGIs below $10k, 60.1% for AGIs $10k-25k, 66.2% for AGIs $25k-50k, 68.9% for AGIs $50k-75k, 70.6% for AGIs $75k-100k, 64.5% for AGIs over 100k)
Likely homosexual households (counted as self-reported same-sex unmarried-partner households)
Lesbian couples: 0.8% of all households
Gay men: 0.1% of all households
Household received Food Stamps/SNAP in the past 12 months: 387 Household did not receive Food Stamps/SNAP in the past 12 months: 8,240
Women who had a birth in the past 12 months: 549 (405 now married, 142 unmarried) Women who did not have a birth in the past 12 months: 5,224 (2,580 now married, 2,610 unmarried)
Housing units in zip code 12533 with a mortgage: 5,198 (649 second mortgage, 632 both second mortgage and home equity loan) Houses without a mortgage: 232
Median monthly owner costs for units with a mortgage: $2,717 Median monthly owner costs for units without a mortgage: $1,022
Residents with income below the poverty level in 2022:
This zip code:
4.7%
Whole state:
14.3%
Residents with income below 50% of the poverty level in 2022:
This zip code:
1.5%
Whole state:
6.8%
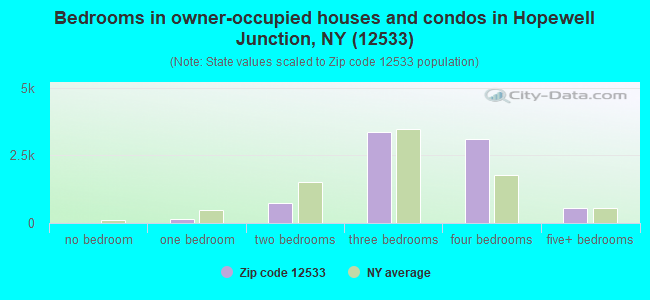
Median number of rooms in houses and condos:
Here:
7.2
State:
6.3
Median number of rooms in apartments:
Here:
4.3
State:
3.8
Notable locations in this zip code not listed on our city pages
Notable locations in zip code 12533: Dogwood Knolls Country Club (A), Branton Woods Golf Club (B), Beekman Country Club (C), Fishkill Farms (D), Kohlmaier Farm (E), Sabellico Greenhouse (F), East Fishkill Community Library (G), East Fishkill Town Hall (H), Wiccopee Fire Company Main Station (I), Hopewell Hose Fire Company Number 1 (J), Hopewell Hose Fire Company 8 (K), Wiccopee Fire Company Substation (L). Display/hide their locations on the map
Churches in zip code 12533 include: Saint Denis Church (A), Kingdom Hall of Jehovah's Witnesses (B), Wiccopee Community United Methodist Church (C), Vineyard Christian Fellowship Church (D), Valley Christian Church (E), Saint Columba Church (F), Hopewell Reformed Church (G), Church of the Resurrection (H), Korean New Covenent Church (I). Display/hide their locations on the map
Cemeteries: Van Wyck Cemetery (1), Bethel Baptist Cemetery (2), Johnsville Methodist Churchyard (3), Saint Denis Cemetery (4). Display/hide their locations on the map
In group quarters: 31 (-1 institutionalized population)
Size of family households: 2,523 2-persons, 1,418 3-persons, 2,014 4-persons, 790 5-persons, 280 6-persons, 76 7-or-more-persons
Size of nonfamily households: 1,188 1-person, 317 2-persons, 11 4-persons
5,014 married couples with children.
969 single-parent households (315 men, 654 women).
82.5% of residents of 12533 zip code speak English at home.
8.6% of residents speak Spanish at home (69% very well, 17% well, 7% not well, 7% not at all).
3.8% of residents speak other Indo-European language at home (85% very well, 10% well, 4% not well, 1% not at all).
2.6% of residents speak Asian or Pacific Island language at home (61% very well, 1% well, 34% not well, 3% not at all).
2.3% of residents speak other language at home (72% very well, 24% well, 4% not well).
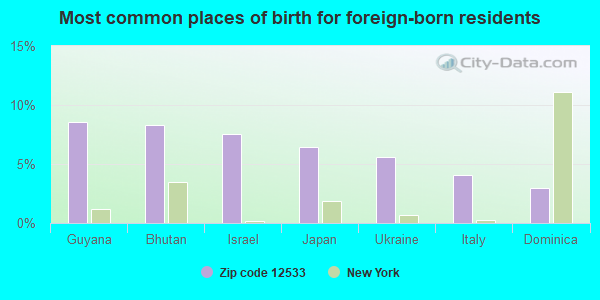
Foreign born population: 2,900 (11.2%) (77.4% of them are naturalized citizens)
This zip code:
11.2%
Whole state:
22.7%
9%Guyana
8%Bhutan
8%Israel
6%Japan
6%Ukraine
4%Italy
3%Dominica
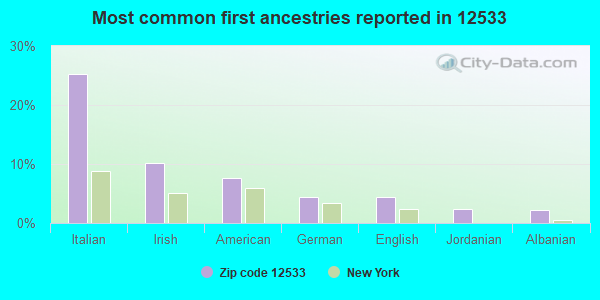
25%Italian
10%Irish
8%American
4%German
4%English
2%Jordanian
2%Albanian
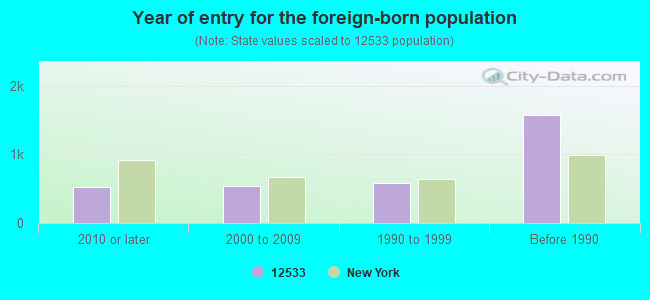
Year of entry for the foreign-born population
5312010 or later
5342000 to 2009
5791990 to 1999
1,576Before 1990
Facilities with environmental interests located in this zip code:
IBM CORPORATION HOPEWELL JUNCTION (2070 ROUTE 52 in HOPEWELL JUNCTION, NY)
AIR MAJOR (AIRS/AFS) ENFORCEMENT/COMPLIANCE ACTIVITY (Integrated Compliance Information System) - ICIS-02-1992-0073, FORMAL ENFORCEMENT ACTION, ICIS-02-1997-0273, ICIS-02-1999-1124, (Integrated Compliance Information System) - ICIS-02-1992-0073, FORMAL ENFORCEMENT ACTION, ICIS-02-1997-0273, ICIS-02-1999-1124, COMPLIANCE ACTIVITY (Tracking inspections of insecticide, fungicide, and rodenticide, and toxic substances) CRITERIA AND HAZARDOUS AIR POLLUTANT INVENTORY (Inventory of air pollution sources) National Pollutant Discharge Elimination System MAJOR (Tracking pollutant discharge elimination systems) - permit HAZARDOUS WASTE BIENNIAL REPORTER (Resource Conservation and Recovery Act (tracking hazardous waste)) Large Quantity Generators, more that 1000 kg of hazardous waste/month (Resource Conservation and Recovery Act (tracking hazardous waste)) - notification TSD (Resource Conservation and Recovery Act (tracking hazardous waste)) - notification TRI REPORTER (Tracking of toxic chemicals releasing facilities) Business SIC classification: ELECTROPLATING, PLATING, POLISHING, ANODIZING, AND COLORING; SPECIAL INDUSTRY MACHINERY; SEMICONDUCTORS AND RELATED DEVICES; ELECTRONIC COMPONENTS Business NAICS classification: SEMICONDUCTOR AND RELATED DEVICE MANUFACTURING. Organizations: EMPIRE STATE DEVELOPMENT CORP (CONTACT/OWNER)
, NYS URBAN DEV CORP DBA EMPIRE STATE DEV (CONTACT/OWNER)
Alternative names: IBM EAST FISHKILL, IBM - EAST FISHKILL FAC, INTERNATIONAL BUSINESS MACHINES CORP.
HOPEWELL PRECISION (19 RYAN ROAD in EAST FISHKILL, NY)
SUPERFUND NPL (Superfund database) STATE MASTER (New York facility tracking) - AIR PROGRAM, HAZARDOUS WASTE BIENNIAL REPORTER (Resource Conservation and Recovery Act (tracking hazardous waste)) Large Quantity Generators, more that 1000 kg of hazardous waste/month (Resource Conservation and Recovery Act (tracking hazardous waste)) Business SIC classification: OFFICE FURNITURE, EXCEPT WOOD Business NAICS classification: METAL HOUSEHOLD FURNITURE MANUFACTURING.; OFFICE FURNITURE (EXCEPT WOOD) MANUFACTURING. Organizations: JOHN B BUDD (CONTACT/OPERATOR)
, RICHARD SKEEN (CONTACT/OWNER)
, HOPEWELL PRECISION INC (LEGALLY RESPONSIBLE PARTY)
HOPEWELL AUTO PARTS INC (RTE 376 AT 82 BOX 472 in HOPEWELL JUNCTION, NY)
(Integrated Compliance Information System) - ICIS-02-1991-0209, FORMAL ENFORCEMENT ACTION Business SIC classification: MOTOR VEHICLE SUPPLIES AND NEW PARTS; AUTO AND HOME SUPPLY STORES; GASOLINE SERVICE STATIONS
HOPEWELL CLEANERS (451 ROUTE 376 AND ROUTE 82 in HOPEWELL JUNCTION, NY)
AIR MINOR (AIRS/AFS) Small Quantity Generators, between 100 kg and 1000 kg of hazardous waste/month (Resource Conservation and Recovery Act (tracking hazardous waste)) - notification Business SIC classification: DRYCLEANING PLANTS, EXCEPT RUG CLEANING Organizations: JONG-SOOK PARK (CONTACT/OWNER)
HOPEWELL HAMLET SEWER DISTRICT (ROUTE 376 in HOPEWELL JUNCTION, NY)
National Pollutant Discharge Elimination System NON-MAJOR (Tracking pollutant discharge elimination systems) - permit Business SIC classification: SEWERAGE SYSTEMS
AIR PRODUCTS & CHEMICALS INC (RTE 52 & SHENANOAH RD in EAST FISHKILL, NY)
(Resource Conservation and Recovery Act (tracking hazardous waste))
GIGI'S DRY CLEANERS (1906 ST RTE 52 in HOPEWELL JUNCTION, NY)
AIR MINOR (AIRS/AFS) Business SIC classification: DRYCLEANING PLANTS, EXCEPT RUG CLEANING
HUDSON VALLEY RESEARCH PARK: BLDG 300 (2070 ROUTE 52 in HOPEWELL JUNCTION, NY)
AIR MINOR (AIRS/AFS) Business SIC classification: ELECTRONIC COMPONENTS
Conditionally Exempt Small Quantity Generators, less than 100 kg/month of hazardous waste (Resource Conservation and Recovery Act (tracking hazardous waste)) - notification Organizations: SOZIO ENT INC (CONTACT/OWNER)
Conditionally Exempt Small Quantity Generators, less than 100 kg/month of hazardous waste (Resource Conservation and Recovery Act (tracking hazardous waste)) - notification Organizations: DICK DANIELS (CONTACT/OWNER)
Housing units lacking complete plumbing facilities: 0.5% Housing units lacking complete kitchen facilities: 0.3%
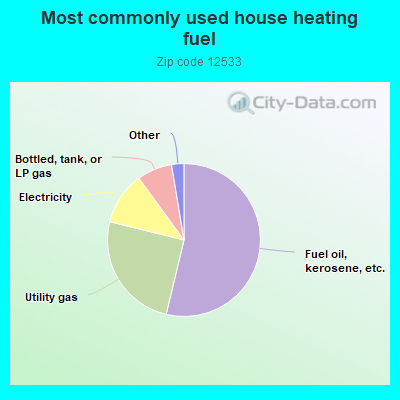
53.7%Fuel oil, kerosene, etc.
25.1%Utility gas
11.1%Electricity
7.4%Bottled, tank, or LP gas
1.0%Other fuel
0.9%Wood
0.8%No fuel used
Population in 1990: 18,770. Population change in the 1990s: +3,484 (+18.6%).
Place of birth for U.S.-born residents:
This state: 19,462
Northeast: 1,467
Midwest: 354
South: 849
West: 352
66% of the 12533 zip code residents lived in the same house 5 years ago. Out of people who lived in different houses, 41% lived in this county. Out of people who lived in different counties, 50% lived in New York.
95% of the 12533 zip code residents lived in the same house 1 year ago. Out of people who lived in different houses, 38% moved from this county. Out of people who lived in different houses, 28% moved from different county within same state. Out of people who lived in different houses, 31% moved from different state. Out of people who lived in different houses, 4% moved from abroad.
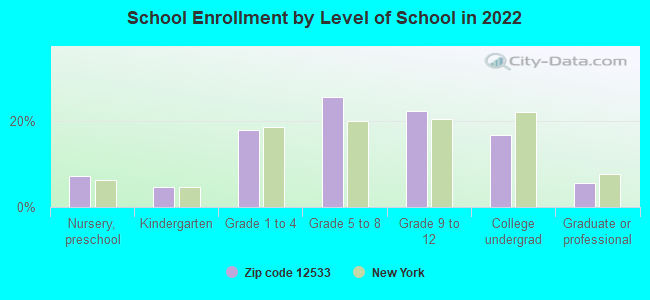
Private vs. public school enrollment:
Students in private schools in grades 1 to 8 (elementary and middle school): 157
Here:
5.6%
New York:
15.6%
Students in private schools in grades 9 to 12 (high school): 290
Here:
19.9%
New York:
15.0%
Students in private undergraduate colleges: 165
Here:
15.5%
New York:
39.2%
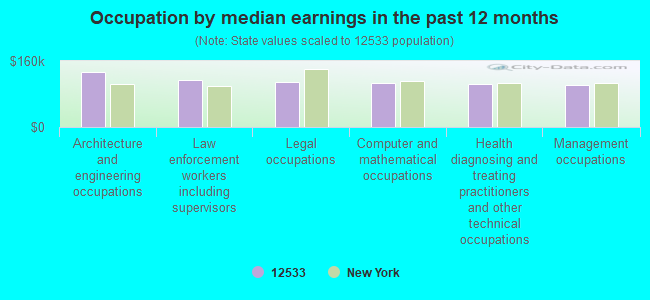
Occupation by median earnings in the past 12 months ($)
133,070Architecture and engineering occupations
113,969Law enforcement workers including supervisors
110,129Legal occupations
107,708Computer and mathematical occupations
104,085Health diagnosing and treating practitioners and other technical occupations
101,936Management occupations
Companies with federal contracts located in this zip code:
EMAGIN CORPORATION (2070 ROUTE 52 in HOPEWELL JUNCT, NY; small business) : $8,543,970 in 14 contractsfrom 2000 to 2006
Contracts for Other Research and Development -- Management and Support (R&D), Defense Electronics and Communication Equipment -- Basic Research (R&D), Defense Electronics and Communication Equipment -- Applied Research and Exploratory Development (R&D), Other Defense -- Operational Systems Development (R&D), and moreby Air Force, Army, Navy, Uniformed Services University of the Health Sciences, and others Signed by year:2000: $2,885,806; 2001: $4,506,678; 2002: $1,042,304; 2003: $0; 2004: $2,800; 2005: $76,385; 2006: $29,997.
Biggest contracts:
$4,231,176 with Air Force for Other Research and Development -- Management and Support (R&D). Signed on 2001-02-28. Completion date: 2002-01-31.
$1,655,000, same as above.Signed on 2000-06-30. Completion date: 2001-07-31.
$732,515, same as above.Signed on 2002-08-06. Completion date: 2002-12-30.
$575,000, same as above.Signed on 2000-01-26. Completion date: 2000-08-30.
MATERIALS AND TECHNOLOGIES COR (64 STORMVILLE RD in HOPEWELL JUNCT, NY; small business) : $848,691 in 5 contractsfrom 2003 to 2006
Contracts for Defense Electronics and Communication Equipment -- Advanced Development (R&D), Defense Electronics and Communication Equipment -- Basic Research (R&D) by Army Signed by year:2000: $0; 2001: $0; 2002: $0; 2003: $69,468; 2004: $414,303; 2005: $0; 2006: $364,920.
Biggest contracts:
$364,752 with Army for Defense Electronics and Communication Equipment -- Advanced Development (R&D). Signed on 2004-11-18. Completion date: 2006-11-08.
$212,775, same as above.Signed on 2006-01-10. Completion date: 2006-11-08.
$152,145, same as above.Signed on 2006-03-22. Completion date: 2006-11-08.
$69,468 with Army for Defense Electronics and Communication Equipment -- Basic Research (R&D). Signed on 2003-12-17. Completion date: 2004-06-15.
CRAWFORD FILTRATION INC (1075 ROUTE 82 in HOPEWELL JUNCT, NY; small business) : $106,455 in 4 contractsfrom 2001 to 2005
$84,323 with Defense Logistics Agency for Refrigeration and Air Conditioning Components. Signed on 2001-03-29. Completion date: 2001-03-29.
$11,950, same as above.Signed on 2005-01-24. Completion date: 2005-02-12.
$6,061 with Army for Air Purification Equipment. Signed on 2005-07-20. Completion date: 2005-08-22.
$4,121, same as above.Signed on 2005-12-14. Completion date: 2006-01-10.
SPECTRA DYNAMICS, INC (2117 ROUTE 52 in HOPEWELL JUNCT, NY; small business)
$54,000 with Navy for Miscellaneous Communication Equipment. Signed on 2005-09-13. Completion date: 2005-11-21.
TOLLMAN-HUNDLEY HOTELS CORP (2424 ROUTE 52 in HOPEWELL JUNCT, NY; small business)
$9,145 with Army for Lodging - Hotel/Motel. Taking place in MN. Signed on 2003-10-09. Completion date: 2003-10-13.
BRYANSTON GROUP, INC (1886 STATE ROUTE 52 52 in HOPEWELL JUNCT, NY; small business) : $3,388 in 2 contractsfrom 2002 to 2003
$4,700 with Army for Lodging - Hotel/Motel. Taking place in GA. Signed on 2002-09-21. Completion date: 2002-11-16.
-$1,312, same as above.Signed on 2003-04-22. Completion date: 2002-11-16.
SPECTRAL SYSTEMS LLC (35 CORPORATE PARK DR in HOPEWELL JUNCT, NY)
$2,840 with Navy for Visible and Invisible Light Communication Equipment. Signed on 2006-06-13. Completion date: 2006-06-13.
SONIN INC (2345 RT. 52 in HOPEWELL JUNCTION, NY; small business) : $500 in 2 contractsin 2004
$500 with Office of the Assistant Secretary for Administration and Management for . Taking place in OH. Signed on 2004-11-03. Completion date: 2005-09-30.
$0, same as above.Signed on 2004-11-19. Effective on 2004-11-03. Completion date: 2005-09-30.
Top industries in this zip code by the number of employees in 2005:
2002 - 2018 National Fire Incident Reporting System (NFIRS) incidents
Based on the data from the years 2002 - 2018 the average number of fires per year is 71. The highest number of fires - 110 took place in 2015, and the least - 10 in 2002. The data has a growing trend.
When looking into fire subcategories, the most incidents belonged to: Structure Fires (55.4%), and Outside Fires (24.0%).
Fire incident types reported to NFIRS in Zip Code 12533


 Nearest zip codes: 12582, 12590, 12524, 12531, 10512, 12540.


 Based on the data from the years 2002 - 2018 the average number of fires per year is 71. The highest number of fires - 110 took place in 2015, and the least - 10 in 2002. The data has a growing trend.
 When looking into fire subcategories, the most incidents belonged to: Structure Fires (55.4%), and Outside Fires (24.0%).