Estimated zip code population in 2022: 6,161 Zip code population in 2010: 6,594 Zip code population in 2000: 6,678
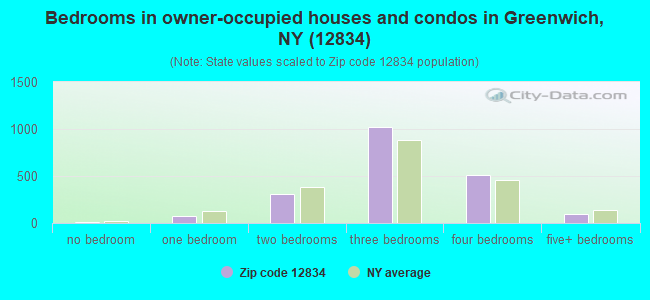
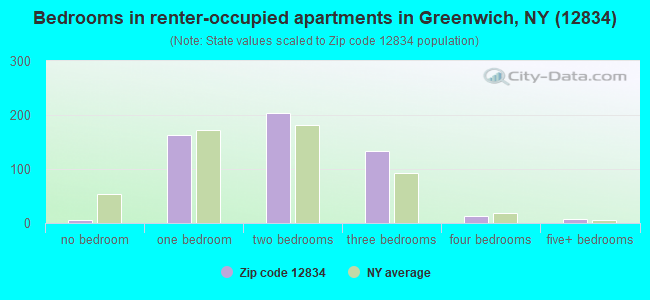
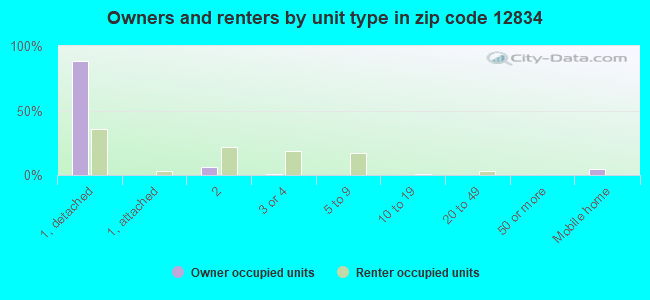
Houses and condos: 2,739 Renter-occupied apartments: 529
% of renters here:
21%
State:
46%
March 2022 cost of living index in zip code 12834: 95.4 (near average, U.S. average is 100)
Land area: 86.7 sq. mi. Water area: 1.0 sq. mi.
Population density: 71 people per square mile
(very low).
OSM Map
General Map
Google Map
MSN Map
OSM Map
General Map
Google Map
MSN Map
OSM Map
General Map
Google Map
MSN Map
OSM Map
General Map
Google Map
MSN Map
Please wait while loading the map...
Real estate property taxes paid for housing units in 2022:
This zip code:
2.3% ($5,391)
New York:
1.5% ($6,180)
Median real estate property taxes paid for housing units with mortgages in 2022: $5,828 (2.4%) Median real estate property taxes paid for housing units with no mortgage in 2022: $4,621 (2.0%)
Business Search- 14 Million verified businesses
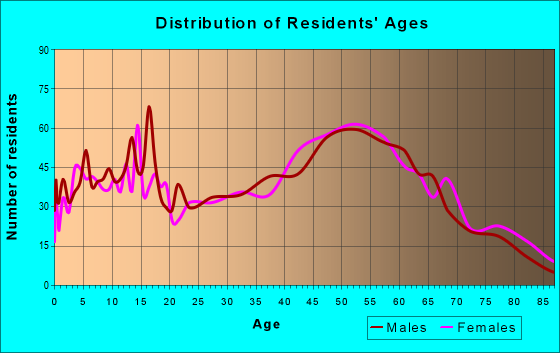
Males: 3,222
(52.3%)
Females: 2,938
(47.7%)
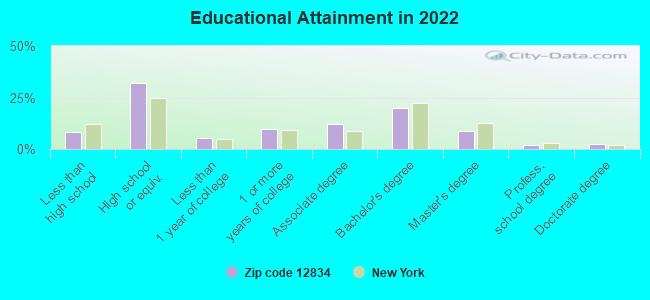
For population 25 years and over in 12834:
High school or higher: 91.7%
Bachelor's degree or higher: 32.6%
Graduate or professional degree: 12.9%
Unemployed: 1.4%
Mean travel time to work (commute): 29.2 minutes
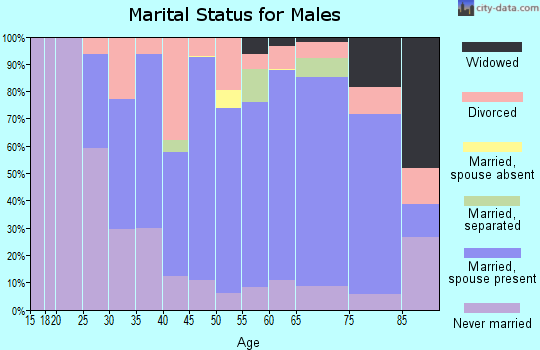
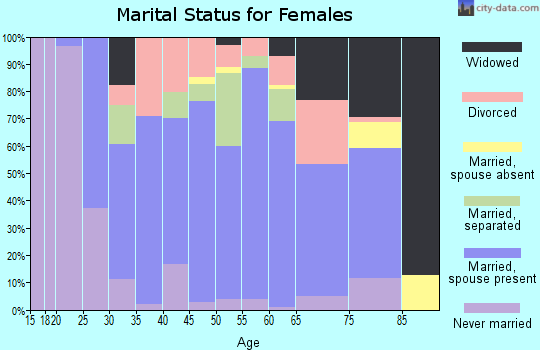
For population 15 years and over in 12834:
Never married: 27.8%
Now married: 54.8%
Separated: 2.8%
Widowed: 5.0%
Divorced: 9.6%
Zip code 12834 compared to state average:
Median house value below state average.
Unemployed percentage significantly below state average.
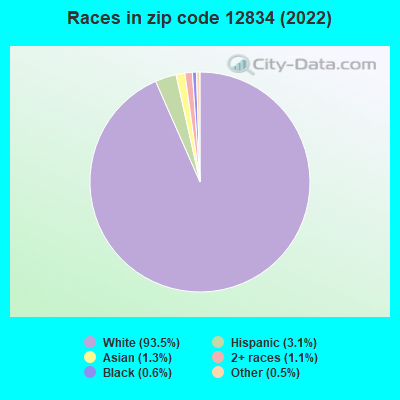
Black race population percentage significantly below state average.
Hispanic race population percentage significantly below state average.
Median age above state average.
Foreign-born population percentage significantly below state average.
Renting percentage below state average.
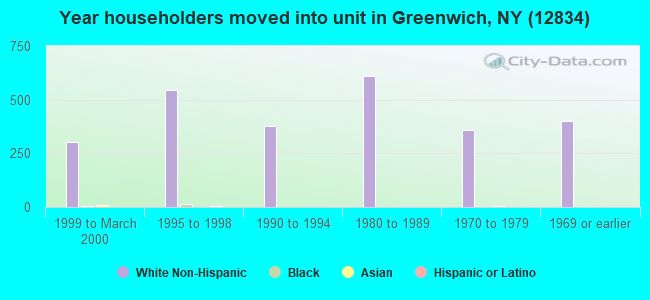
Length of stay since moving in significantly above state average.
Averages for the 2020 tax year for zip code 12834, filed in 2021:
Average Adjusted Gross Income (AGI) in 2020: $64,873 (Individual Income Tax Returns)
Here:
$64,873
State:
$90,930
Salary/wage: $56,718 (reported on 79.9% of returns)
Here:
$56,718
State:
$72,104
(% of AGI for various income ranges: 1209.8% for AGIs below $25k, 3642.2% for AGIs $25k-50k, 6664.8% for AGIs $50k-75k, 9410.4% for AGIs $75k-100k, 16992.6% for AGIs $100k-200k, 74583.3% for AGIs over 200k)
Taxable interest for individuals: $823 (reported on 38.4% of returns)
This zip code:
$823
New York:
$3,075
(% of AGI for various income ranges: 18.6% for AGIs below $25k, 22.6% for AGIs $25k-50k, 68.1% for AGIs $50k-75k, 42.3% for AGIs $75k-100k, 113.5% for AGIs $100k-200k, 416.7% for AGIs over 200k)
Ordinary dividends: $4,689 (reported on 21.3% of returns)
Here:
$4,689
State:
$11,095
(% of AGI for various income ranges: 35.9% for AGIs below $25k, 62.0% for AGIs $25k-50k, 153.9% for AGIs $50k-75k, 135.0% for AGIs $75k-100k, 415.8% for AGIs $100k-200k, 2003.3% for AGIs over 200k)
Net capital gain/loss in AGI: +$10,105 (reported on 18.6% of returns)
Here:
+$10,105
State:
+$44,925
(% of AGI for various income ranges: 19.5% for AGIs below $25k, 47.2% for AGIs $25k-50k, 174.8% for AGIs $50k-75k, 111.5% for AGIs $75k-100k, 776.5% for AGIs $100k-200k, 8686.7% for AGIs over 200k)
Profit/loss from business: +$12,994 (reported on 15.6% of returns)
Here:
+$12,994
State:
+$14,940
(% of AGI for various income ranges: 152.6% for AGIs below $25k, 148.3% for AGIs $25k-50k, 228.4% for AGIs $50k-75k, 289.6% for AGIs $75k-100k, 720.0% for AGIs $100k-200k, 4050.0% for AGIs over 200k)
Taxable individual retirement arrangement distribution: $17,638 (reported on 11.1% of returns)
12834:
$17,638
New York:
$19,609
(% of AGI for various income ranges: 70.9% for AGIs below $25k, 104.9% for AGIs $25k-50k, 222.3% for AGIs $50k-75k, 312.7% for AGIs $75k-100k, 754.2% for AGIs $100k-200k, 5310.0% for AGIs over 200k)
Total itemized deductions: $25,318 (reported on 5.1% of returns)
Here:
$25,318
State:
$39,326
(% of AGI for various income ranges: 117.7% for AGIs $25k-50k, 207.7% for AGIs $50k-75k, 254.6% for AGIs $75k-100k, 468.1% for AGIs $100k-200k, 2606.7% for AGIs over 200k)
Charity contributions: $6,123 (reported on 3.9% of returns)
Here:
$6,123
State:
$15,420
(% of AGI for various income ranges: 19.0% for AGIs $50k-75k, 19.2% for AGIs $75k-100k, 221.6% for AGIs $100k-200k)
Taxes paid: $9,024 (reported on 5.1% of returns)
12834:
$9,024
State:
$9,183
(% of AGI for various income ranges: 30.2% for AGIs $25k-50k, 77.7% for AGIs $50k-75k, 115.8% for AGIs $75k-100k, 185.5% for AGIs $100k-200k, 736.7% for AGIs over 200k)
Earned income credit: $2,006 (reported on 10.8% of returns)
Here:
$2,006
State:
$2,138
(% of AGI for various income ranges: 73.1% for AGIs below $25k, 45.8% for AGIs $25k-50k)
Percentage of individuals using paid preparers for their 2020 taxes: 95.8%
Here:
96%
State:
95%
(% for various income ranges: 94.5% for AGIs below $25k, 95.5% for AGIs $25k-50k, 95.8% for AGIs $50k-75k, 97.5% for AGIs $75k-100k, 96.4% for AGIs $100k-200k, 100.0% for AGIs over 200k)
Averages for the 2012 tax year for zip code 12834, filed in 2013:
Average Adjusted Gross Income (AGI) in 2012: $55,274 (Individual Income Tax Returns)
Here:
$55,274
State:
$77,088
Salary/wage: $46,618 (reported on 83.5% of returns)
Here:
$46,618
State:
$60,593
(% of AGI for various income ranges: 71.0% for AGIs below $25k, 78.4% for AGIs $25k-50k, 75.2% for AGIs $50k-75k, 76.2% for AGIs $75k-100k, 78.1% for AGIs $100k-200k, 36.9% for AGIs over 200k)
Taxable interest for individuals: $976 (reported on 41.0% of returns)
This zip code:
$976
New York:
$3,125
(% of AGI for various income ranges: 1.8% for AGIs below $25k, 0.7% for AGIs $25k-50k, 0.7% for AGIs $50k-75k, 0.6% for AGIs $75k-100k, 0.5% for AGIs $100k-200k, 0.8% for AGIs over 200k)
Ordinary dividends: $3,653 (reported on 24.1% of returns)
Here:
$3,653
State:
$10,299
(% of AGI for various income ranges: 2.2% for AGIs below $25k, 1.2% for AGIs $25k-50k, 1.0% for AGIs $50k-75k, 1.7% for AGIs $75k-100k, 1.3% for AGIs $100k-200k, 2.8% for AGIs over 200k)
Net capital gain/loss in AGI: +$7,104 (reported on 15.6% of returns)
Here:
+$7,104
State:
+$42,474
(% of AGI for various income ranges: 0.6% for AGIs $25k-50k, 0.6% for AGIs $50k-75k, 0.8% for AGIs $75k-100k, 1.6% for AGIs $100k-200k, 8.2% for AGIs over 200k)
Profit/loss from business: +$10,002 (reported on 16.2% of returns)
Here:
+$10,002
State:
+$16,168
(% of AGI for various income ranges: 6.4% for AGIs below $25k, 2.1% for AGIs $25k-50k, 3.2% for AGIs $50k-75k, 1.9% for AGIs $75k-100k, 4.6% for AGIs $100k-200k)
Taxable individual retirement arrangement distribution: $10,009 (reported on 11.1% of returns)
12834:
$10,009
New York:
$17,621
(% of AGI for various income ranges: 4.7% for AGIs below $25k, 2.2% for AGIs $25k-50k, 2.3% for AGIs $50k-75k, 2.2% for AGIs $75k-100k, 1.9% for AGIs $100k-200k)
Self-employment retirement plans: $14,167 (reported on 1.0% of returns)
12834:
$14,167
New York:
$27,330
Total itemized deductions: $20,689 (20% of AGI, reported on 31.7% of returns)
Here:
$20,689
State:
$34,985
Here:
19.8% of AGI
State:
21.3% of AGI
(% of AGI for various income ranges: 9.1% for AGIs below $25k, 8.6% for AGIs $25k-50k, 11.0% for AGIs $50k-75k, 12.1% for AGIs $75k-100k, 15.5% for AGIs $100k-200k, 11.5% for AGIs over 200k)
Charity contributions: $3,103 (reported on 25.1% of returns)
Here:
$3,103
State:
$5,572
(% of AGI for various income ranges: 0.4% for AGIs below $25k, 0.6% for AGIs $25k-50k, 1.1% for AGIs $50k-75k, 1.1% for AGIs $75k-100k, 1.7% for AGIs $100k-200k, 3.0% for AGIs over 200k)
Taxes paid: $10,145 (reported on 31.7% of returns)
12834:
$10,145
State:
$18,656
(% of AGI for various income ranges: 2.6% for AGIs below $25k, 3.1% for AGIs $25k-50k, 5.2% for AGIs $50k-75k, 6.0% for AGIs $75k-100k, 8.2% for AGIs $100k-200k, 6.7% for AGIs over 200k)
Earned income credit: $1,840 (reported on 14.3% of returns)
Here:
$1,840
State:
$2,230
(% of AGI for various income ranges: 4.3% for AGIs below $25k, 0.9% for AGIs $25k-50k)
Percentage of individuals using paid preparers for their 2012 taxes: 58.1%
Here:
58%
State:
66%
(% for various income ranges: 52.2% for AGIs below $25k, 59.2% for AGIs $25k-50k, 62.0% for AGIs $50k-75k, 61.1% for AGIs $75k-100k, 62.9% for AGIs $100k-200k, 80.0% for AGIs over 200k)
Averages for the 2004 tax year for zip code 12834, filed in 2005:
Average Adjusted Gross Income (AGI) in 2004: $44,590 (Individual Income Tax Returns)
Here:
$44,590
State:
$59,519
Salary/wage: $41,522 (reported on 83.7% of returns)
Here:
$41,522
State:
$50,673
(% of AGI for various income ranges: 84.6% for AGIs below $10k, 71.0% for AGIs $10k-25k, 80.0% for AGIs $25k-50k, 80.5% for AGIs $50k-75k, 82.7% for AGIs $75k-100k, 73.3% for AGIs over 100k)
Taxable interest for individuals: $931 (reported on 53.6% of returns)
This zip code:
$931
New York:
$2,377
(% of AGI for various income ranges: 6.0% for AGIs below $10k, 2.6% for AGIs $10k-25k, 1.0% for AGIs $25k-50k, 1.0% for AGIs $50k-75k, 0.7% for AGIs $75k-100k, 0.8% for AGIs over 100k)
Taxable dividends: $2,964 (reported on 27.8% of returns)
Here:
$2,964
State:
$5,394
(% of AGI for various income ranges: 4.6% for AGIs below $10k, 2.0% for AGIs $10k-25k, 1.3% for AGIs $25k-50k, 1.0% for AGIs $50k-75k, 0.6% for AGIs $75k-100k, 3.5% for AGIs over 100k)
Net capital gain/loss: +$6,377 (reported on 20.7% of returns)
Here:
+$6,377
State:
+$23,581
(% of AGI for various income ranges: -0.1% for AGIs below $10k, 2.3% for AGIs $10k-25k, 0.8% for AGIs $25k-50k, 1.1% for AGIs $50k-75k, 2.7% for AGIs $75k-100k, 6.6% for AGIs over 100k)
Profit/loss from business: +$10,196 (reported on 16.5% of returns)
Here:
+$10,196
State:
+$13,809
(% of AGI for various income ranges: 15.1% for AGIs below $10k, 8.4% for AGIs $10k-25k, 4.0% for AGIs $25k-50k, 2.9% for AGIs $50k-75k, 3.4% for AGIs $75k-100k, 2.4% for AGIs over 100k)
IRA payment deduction: $2,604 (reported on 3.0% of returns)
12834:
$2,604
New York:
$3,115
(% of AGI for various income ranges: 0.3% for AGIs $10k-25k, 0.4% for AGIs $25k-50k, 0.1% for AGIs $50k-75k, 0.2% for AGIs $75k-100k)
Self-employed pension: $7,800 (reported on 0.8% of returns)
Here:
$7,800
New York:
$19,016
Total itemized deductions: $16,751 (20% of AGI, reported on 32.1% of returns)
Here:
$16,751
State:
$25,864
Here:
20.0% of AGI
State:
21.9% of AGI
(% of AGI for various income ranges: 6.2% for AGIs below $10k, 7.7% for AGIs $10k-25k, 9.6% for AGIs $25k-50k, 12.5% for AGIs $50k-75k, 14.4% for AGIs $75k-100k, 13.8% for AGIs over 100k)
Charity contributions deductions: $2,448 (3% of AGI, reported on 28.7% of returns)
Here:
$2,448
State:
$4,439
Here:
2.8% of AGI
State:
3.6% of AGI
(% of AGI for various income ranges: 0.5% for AGIs below $10k, 0.6% for AGIs $10k-25k, 1.0% for AGIs $25k-50k, 1.3% for AGIs $50k-75k, 1.6% for AGIs $75k-100k, 2.5% for AGIs over 100k)
Total tax: $6,382 (reported on 77.6% of returns)
12834:
$6,382
State:
$11,730
(% of AGI for various income ranges: 4.0% for AGIs below $10k, 5.2% for AGIs $10k-25k, 6.9% for AGIs $25k-50k, 8.6% for AGIs $50k-75k, 10.3% for AGIs $75k-100k, 18.8% for AGIs over 100k)
Earned income credit: $1,399 (reported on 12.7% of returns)
Here:
$1,399
State:
$1,757
Percentage of individuals using paid preparers for their 2004 taxes: 59.8%
Here:
60%
State:
67%
(% for various income ranges: 50.2% for AGIs below $10k, 57.6% for AGIs $10k-25k, 60.8% for AGIs $25k-50k, 65.2% for AGIs $50k-75k, 65.8% for AGIs $75k-100k, 70.8% for AGIs over 100k)
Likely homosexual households (counted as self-reported same-sex unmarried-partner households)
Lesbian couples: 0.7% of all households
Gay men: 0.0% of all households
Household received Food Stamps/SNAP in the past 12 months: 168 Household did not receive Food Stamps/SNAP in the past 12 months: 2,355
Women who had a birth in the past 12 months: 47 (39 now married, 8 unmarried) Women who did not have a birth in the past 12 months: 1,130 (550 now married, 573 unmarried)
Housing units in zip code 12834 with a mortgage: 1,089 (63 second mortgage, 64 both second mortgage and home equity loan) Houses without a mortgage: 110
Median monthly owner costs for units with a mortgage: $1,781 Median monthly owner costs for units without a mortgage: $743
Residents with income below the poverty level in 2022:
This zip code:
8.4%
Whole state:
14.3%
Residents with income below 50% of the poverty level in 2022:
This zip code:
4.1%
Whole state:
6.8%
Median number of rooms in houses and condos:
Here:
6.7
State:
6.3
Median number of rooms in apartments:
Here:
4.7
State:
3.8
Notable locations in this zip code not listed on our city pages
Notable locations in zip code 12834: Batten Kill Country Club (A), Washington Square (B), Beech Hill Farm (C), Happy Hill Farm (D), Manx Station Farm (E), R And R Farms (F), Rainbows End Farm (G), Skiff Farm (H), Edgewood Farm (I), White Feather Farm (J), Washington County Fairgrounds (K), Windy Hills Golf Course (L), Middle Falls Fire Department (M), Niagara-Mohawk Power Corporation Middle Falls Hydro Station (N), Greenwich Fire Department (O), Easton Library (P), Greenwich Free Library (Q), Easton Volunteer Fire Company (R). Display/hide their locations on the map
Churches in zip code 12834 include: Bottskill Baptist Church (A), Centenary United Methodist Church (B), Saint Joseph's Roman Catholic Church (C), Saint Paul's Episcopal Church (D), United Presbyterian Church (E). Display/hide their locations on the map
670 married couples with children.
240 single-parent households (72 men, 168 women).
96.0% of residents of 12834 zip code speak English at home.
0.9% of residents speak Spanish at home (83% very well, 8% well, 10% not well).
1.3% of residents speak other Indo-European language at home (71% very well, 18% well, 11% not at all).
1.3% of residents speak Asian or Pacific Island language at home (51% very well, 3% well, 46% not well).
0.6% of residents speak other language at home (100% very well).
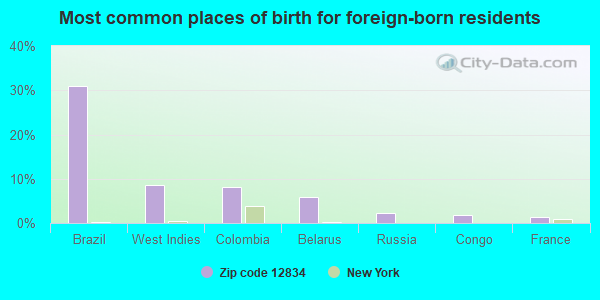
Foreign born population: 221 (3.6%) (81.4% of them are naturalized citizens)
This zip code:
3.6%
Whole state:
22.7%
31%Brazil
9%West Indies
8%Colombia
6%Belarus
2%Russia
2%Congo
1%France
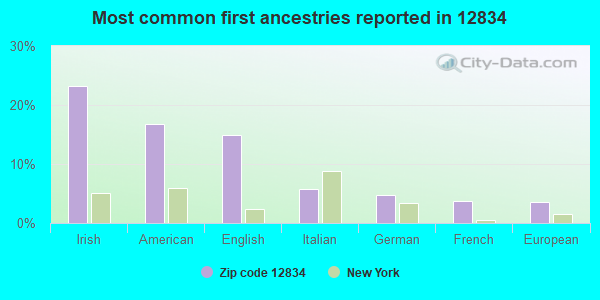
23%Irish
17%American
15%English
6%Italian
5%German
4%French
3%European
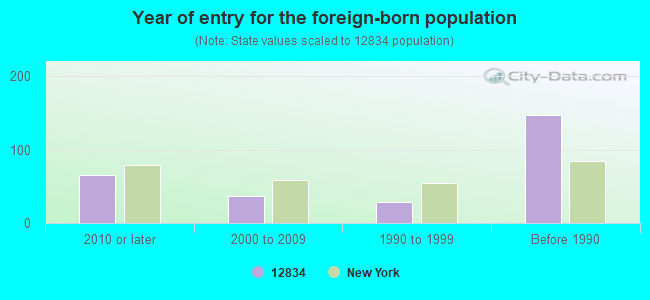
Year of entry for the foreign-born population
652010 or later
372000 to 2009
281990 to 1999
147Before 1990
Facilities with environmental interests located in this zip code:
HOLLINGSWORTH & VOSE GREENWICH MILL (RT 29 in GREENWICH, NY)
AIR MAJOR (AIRS/AFS) STATE MASTER (New York facility tracking) - SECTION 404 PERMITTING, AIR PROGRAM, National Pollutant Discharge Elimination System Permit, SECTION 404 PERMITTING, AIR MAJOR, SECTION 404 PERMITTING, 401 CERTIFICATION, SOLID WASTE PROGRAM, National Pollutant Discharge Elimination System Permit, HAZARDOUS WASTE PROGRAM (Integrated Compliance Information System) - ICIS-02-2003-4207, FORMAL ENFORCEMENT ACTION COMPLIANCE ACTIVITY (Tracking inspections of insecticide, fungicide, and rodenticide, and toxic substances) CRITERIA AND HAZARDOUS AIR POLLUTANT INVENTORY (Inventory of air pollution sources) National Pollutant Discharge Elimination System MAJOR (Tracking pollutant discharge elimination systems) - permit (Resource Conservation and Recovery Act (tracking hazardous waste)) TRI REPORTER (Tracking of toxic chemicals releasing facilities) Business SIC classification: PAPER MILLS; NONCLASSIFIABLE ESTABLISHMENTS Business NAICS classification: PAPER (EXCEPT NEWSPRINT) MILLS. Organizations: HOLLINGSWORTH AND VOSE CO (CONTACT/OWNER)
, HOLLINGSWORTH & VOSE CO (LEGALLY RESPONSIBLE PARTY)
Alternative names: GREENWICH MILL H&V, HOLLINGSWORTH & VOSE CO, HOLLINGSWORTH & VOSE-GREENWICH, HOLLINGWORTH & VOSE CO, HOOLINGSWORTH & VOSE COMPANY
HOLLINGSWORTH & VOSE COMPANY INCORPORATED (5035 COUNTY ROUTE 113 in GREENWICH, NY)
AIR MAJOR (AIRS/AFS) AIR MINOR (AIRS/AFS) (Integrated Compliance Information System) - ICIS-02-1995-0037, FORMAL ENFORCEMENT ACTION, ICIS-02-1995-0038, ICIS-02-1995-0122, ICIS-02-1995-0124, COMPLIANCE ACTIVITY (Tracking inspections of insecticide, fungicide, and rodenticide, and toxic substances) CRITERIA AND HAZARDOUS AIR POLLUTANT INVENTORY (Inventory of air pollution sources) National Pollutant Discharge Elimination System MAJOR (Tracking pollutant discharge elimination systems) - permit HAZARDOUS WASTE BIENNIAL REPORTER (Resource Conservation and Recovery Act (tracking hazardous waste)) Small Quantity Generators, between 100 kg and 1000 kg of hazardous waste/month (Resource Conservation and Recovery Act (tracking hazardous waste)) Small Quantity Generators, between 100 kg and 1000 kg of hazardous waste/month (Resource Conservation and Recovery Act (tracking hazardous waste)) TRI REPORTER (Tracking of toxic chemicals releasing facilities) Business SIC classification: PULP MILLS; PAPER MILLS; PAPERBOARD MILLS; NONCLASSIFIABLE ESTABLISHMENTS Organizations: HOLLINGSWORTH AND VOSE CO (CONTACT/OWNER)
Alternative names: EASTON MILL, EASTON MILL H&V, GREENWICH, HOLLINGSWORTH & VOSE CO R & D, HOLLINGSWORTH & VOSE-EASTON MILL, HOLLINGSWORTH & VOSE-EASTON ML
GREENWICH CENTRAL SCHOOL (10 GRAY AVE in GREENWICH, NY)
(Integrated Compliance Information System) - ICIS-02-1999-1121, FORMAL ENFORCEMENT ACTION COMPLIANCE ACTIVITY (Tracking inspections of insecticide, fungicide, and rodenticide, and toxic substances) (Resource Conservation and Recovery Act (tracking hazardous waste)) Business SIC classification: SPECIAL TRADE CONTRACTORS Alternative names: GREENWICH CENTRAL SCHOOL DISTRICT
COLEBROOK DAIRY (ANTHONY ROAD in GREENWICH, NY)
STATE MASTER (New York facility tracking) - National Pollutant Discharge Elimination System Permit National Pollutant Discharge Elimination System NON-MAJOR (Tracking pollutant discharge elimination systems) - permit Business SIC classification: GENERAL FARMS, PRIMARILY LIVESTOCK AND ANIMAL SPECIALTIES Organizations: DONALD WILBUR (CONTACT/OWNER)
Alternative names: DONALD WILBUR, JEFF KING
GREENWICH ES ( in GREENWICH, NY)
(National Center for Education Statistics) - STATE ID-640801040003 Organizations: GREENWICH CSD (SCHOOL DISTRICT)
GREENWICH JSHS ( in GREENWICH, NY)
(National Center for Education Statistics) - STATE ID-640801040002 Organizations: GREENWICH CSD (SCHOOL DISTRICT)
GREENWICH (V) WWTP (6 ACADEMY STREET in GREENWICH, NY)
National Pollutant Discharge Elimination System NON-MAJOR (Tracking pollutant discharge elimination systems) - permit Business SIC classification: SEWERAGE SYSTEMS
CUMBERLAND FARMS #3144 (RTE 29 & WILSON ST in GREENWICH, NY)
(Resource Conservation and Recovery Act (tracking hazardous waste))
GEORGIA - PACIFIC PAPER MILL (RIVER RD RTE 113 in THOMSON, NY)
(Resource Conservation and Recovery Act (tracking hazardous waste))
GREENWICH AGWAY COOP INC (ELBOW ST in GREENWICH, NY)
(Resource Conservation and Recovery Act (tracking hazardous waste))
BELT DEWATERING PRESS MFG INC (RTE 29 in GREENWICH, NY)
(Resource Conservation and Recovery Act (tracking hazardous waste))
GREENWICH LF (2 ACADEMY ST in GREENWICH, NY)
CRITERIA AND HAZARDOUS AIR POLLUTANT INVENTORY (Inventory of air pollution sources) Business SIC classification: REFUSE SYSTEMS Business NAICS classification: SOLID WASTE LANDFILL.
HOLLINGSWORTH & VOSE CO (PULP MILL RD in GREENWICH, NY)
COMPLIANCE ACTIVITY (Tracking inspections of insecticide, fungicide, and rodenticide, and toxic substances)
Housing units lacking complete plumbing facilities: 0.2% Housing units lacking complete kitchen facilities: 1.0%
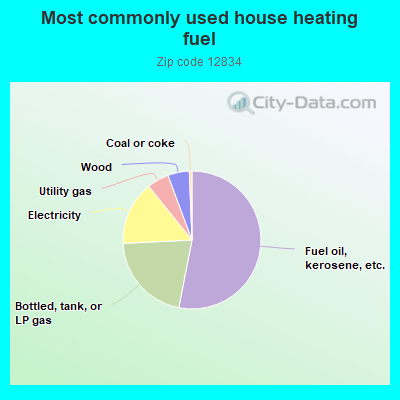
52.7%Fuel oil, kerosene, etc.
21.0%Bottled, tank, or LP gas
14.9%Electricity
5.1%Utility gas
5.0%Wood
0.6%Coal or coke
Population in 1990: 6,028. Population change in the 1990s: +650 (+10.8%).
Place of birth for U.S.-born residents:
This state: 4,840
Northeast: 566
Midwest: 75
South: 255
West: 130
67% of the 12834 zip code residents lived in the same house 5 years ago. Out of people who lived in different houses, 51% lived in this county. Out of people who lived in different counties, 50% lived in New York.
93% of the 12834 zip code residents lived in the same house 1 year ago. Out of people who lived in different houses, 77% moved from this county. Out of people who lived in different houses, 13% moved from different county within same state. Out of people who lived in different houses, 6% moved from different state. Out of people who lived in different houses, 2% moved from abroad.
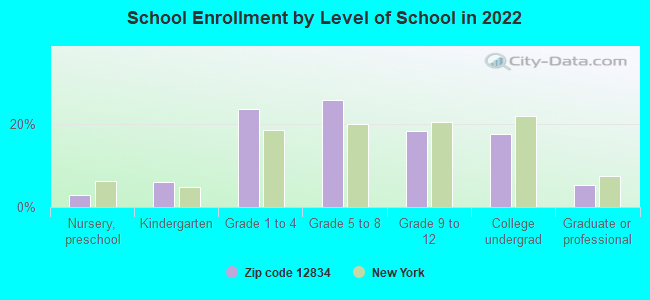
Private vs. public school enrollment:
Students in private schools in grades 1 to 8 (elementary and middle school): 30
Here:
5.7%
New York:
15.6%
Students in private schools in grades 9 to 12 (high school): 21
Here:
10.9%
New York:
15.0%
Students in private undergraduate colleges: 28
Here:
15.2%
New York:
39.2%
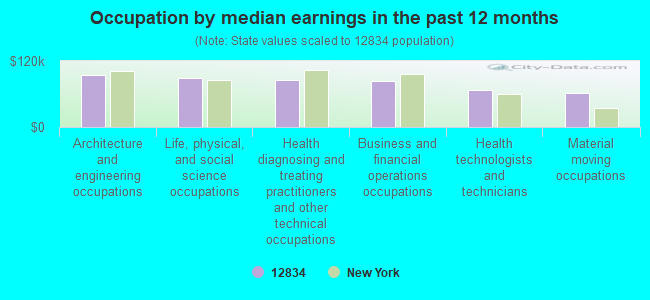
Occupation by median earnings in the past 12 months ($)
93,893Architecture and engineering occupations
89,249Life, physical, and social science occupations
86,200Health diagnosing and treating practitioners and other technical occupations
84,353Business and financial operations occupations
66,792Health technologists and technicians
61,850Material moving occupations
Companies with federal contracts located in this zip code:
BDP INDUSTRIES, INC (354 RTE 29 in GREENWICH, NY; small business)
$31,354 with Army for Sewage Treatment Equipment. Signed on 2004-09-14. Completion date: 2004-10-22.
Top industries in this zip code by the number of employees in 2005:
2002 - 2018 National Fire Incident Reporting System (NFIRS) incidents
According to the data from the years 2002 - 2018 the average number of fire incidents per year is 19. The highest number of reported fires - 33 took place in 2015, and the least - 6 in 2004. The data has a decreasing trend.
When looking into fire subcategories, the most incidents belonged to: Structure Fires (63.0%), and Outside Fires (26.2%).
Fire incident types reported to NFIRS in Zip Code 12834
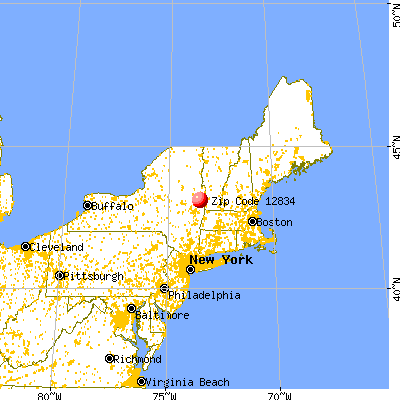


 Nearest zip codes: 12884, 12871, 12823, 12816, 12809, 12028.


 According to the data from the years 2002 - 2018 the average number of fire incidents per year is 19. The highest number of reported fires - 33 took place in 2015, and the least - 6 in 2004. The data has a decreasing trend.
 When looking into fire subcategories, the most incidents belonged to: Structure Fires (63.0%), and Outside Fires (26.2%).