Estimated zip code population in 2022: 2,685 Zip code population in 2010: 2,835 Zip code population in 2000: 2,242
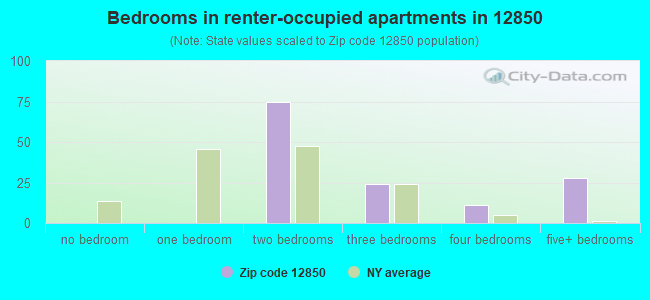
Houses and condos: 1,340 Renter-occupied apartments: 143
% of renters here:
14%
State:
46%
March 2022 cost of living index in zip code 12850: 96.3 (near average, U.S. average is 100)
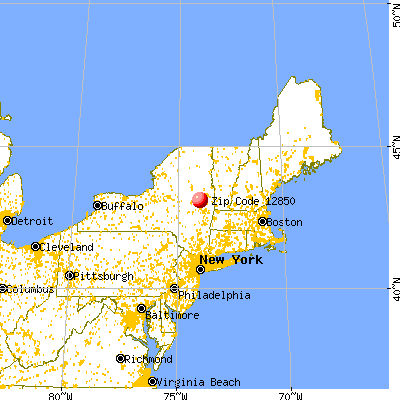
Land area: 46.8 sq. mi. Water area: 0.9 sq. mi.
Population density: 57 people per square mile
(very low).
OSM Map
General Map
Google Map
MSN Map
OSM Map
General Map
Google Map
MSN Map
OSM Map
General Map
Google Map
MSN Map
OSM Map
General Map
Google Map
MSN Map
Please wait while loading the map...
Real estate property taxes paid for housing units in 2022:
This zip code:
1.2% ($3,266)
New York:
1.5% ($6,180)
Median real estate property taxes paid for housing units with mortgages in 2022: $3,386 (1.2%) Median real estate property taxes paid for housing units with no mortgage in 2022: $2,766 (1.2%)
Business Search- 14 Million verified businesses
Males: 1,466
(54.6%)
Females: 1,219
(45.4%)
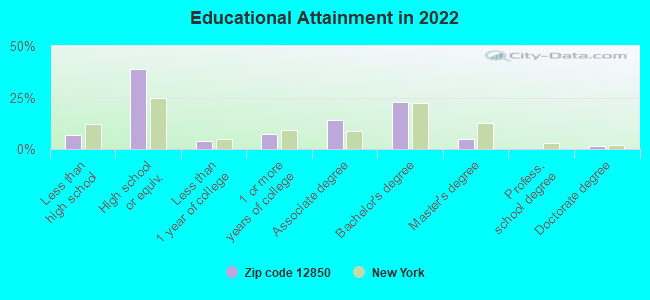
For population 25 years and over in 12850:
High school or higher: 92.7%
Bachelor's degree or higher: 28.9%
Graduate or professional degree: 6.3%
Unemployed: 2.6%
Mean travel time to work (commute): 30.6 minutes
For population 15 years and over in 12850:
Never married: 24.0%
Now married: 63.2%
Separated: 0.6%
Widowed: 6.4%
Divorced: 5.9%
Zip code 12850 compared to state average:
Unemployed percentage below state average.
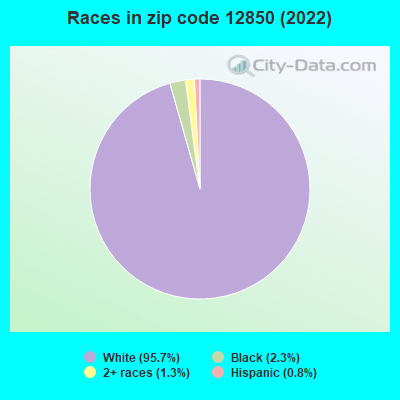
Black race population percentage significantly below state average.
Hispanic race population percentage significantly below state average.
Median age significantly above state average.
Foreign-born population percentage significantly below state average.
Renting percentage significantly below state average.
Length of stay since moving in significantly above state average.
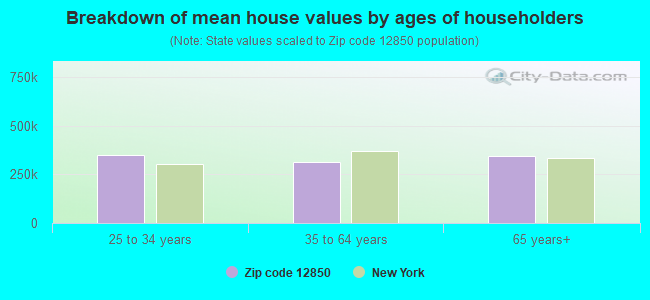
Estimated median house/condo value in 2022: $275,516
12850:
$275,516
New York:
$400,400
According to our research of New York and other state lists, there was 1 registered sex offender living in 12850 zip code as of April 27, 2024. The ratio of all residents to sex offenders in zip code 12850 is 3,267 to 1. The ratio of registered sex offenders to all residents in this zip code is much lower than the state average.
Median resident age:
This zip code:
48.7 years
New York median age:
40.0 years
Average household size:
This zip code:
2.5 people
New York:
2.5 people
Averages for the 2020 tax year for zip code 12850, filed in 2021:
Average Adjusted Gross Income (AGI) in 2020: $85,187 (Individual Income Tax Returns)
Here:
$85,187
State:
$90,930
Salary/wage: $65,448 (reported on 84.1% of returns)
Here:
$65,448
State:
$72,104
(% of AGI for various income ranges: 1043.6% for AGIs below $25k, 3353.1% for AGIs $25k-50k, 6577.3% for AGIs $50k-75k, 10768.0% for AGIs $75k-100k, 15159.5% for AGIs $100k-200k)
Taxable interest for individuals: $779 (reported on 39.3% of returns)
This zip code:
$779
New York:
$3,075
(% of AGI for various income ranges: 13.6% for AGIs below $25k, 11.5% for AGIs $25k-50k, 53.3% for AGIs $50k-75k, 37.0% for AGIs $75k-100k, 54.5% for AGIs $100k-200k)
Ordinary dividends: $3,794 (reported on 22.1% of returns)
Here:
$3,794
State:
$11,095
(% of AGI for various income ranges: 13.2% for AGIs below $25k, 14.6% for AGIs $25k-50k, 45.3% for AGIs $50k-75k, 90.0% for AGIs $75k-100k, 245.5% for AGIs $100k-200k)
Net capital gain/loss in AGI: +$6,621 (reported on 16.6% of returns)
Here:
+$6,621
State:
+$44,925
(% of AGI for various income ranges: 1.1% for AGIs below $25k, 14.6% for AGIs $25k-50k, 40.7% for AGIs $50k-75k, 128.0% for AGIs $75k-100k, 297.5% for AGIs $100k-200k)
Profit/loss from business: +$15,171 (reported on 14.5% of returns)
Here:
+$15,171
State:
+$14,940
(% of AGI for various income ranges: 97.5% for AGIs below $25k, 89.2% for AGIs $25k-50k, 94.7% for AGIs $50k-75k, 7.0% for AGIs $75k-100k, 363.0% for AGIs $100k-200k)
Taxable individual retirement arrangement distribution: $18,971 (reported on 9.7% of returns)
12850:
$18,971
New York:
$19,609
(% of AGI for various income ranges: 48.6% for AGIs below $25k, 82.3% for AGIs $25k-50k, 370.7% for AGIs $50k-75k, 875.0% for AGIs $100k-200k)
Total itemized deductions: $26,010 (reported on 6.9% of returns)
Here:
$26,010
State:
$39,326
(% of AGI for various income ranges: 502.7% for AGIs $50k-75k, 546.5% for AGIs $100k-200k)
Charity contributions: $5,129 (reported on 4.8% of returns)
Here:
$5,129
State:
$15,420
(% of AGI for various income ranges: 9.6% for AGIs $25k-50k, 167.0% for AGIs $100k-200k)
Taxes paid: $8,290 (reported on 6.9% of returns)
12850:
$8,290
State:
$9,183
(% of AGI for various income ranges: 174.0% for AGIs $50k-75k, 177.0% for AGIs $100k-200k)
Earned income credit: $1,827 (reported on 10.3% of returns)
Here:
$1,827
State:
$2,138
(% of AGI for various income ranges: 49.3% for AGIs below $25k, 52.3% for AGIs $25k-50k)
Percentage of individuals using paid preparers for their 2020 taxes: 97.2%
Here:
97%
State:
95%
(% for various income ranges: 97.4% for AGIs below $25k, 96.9% for AGIs $25k-50k, 100.0% for AGIs $50k-75k, 100.0% for AGIs $75k-100k, 96.7% for AGIs $100k-200k, 87.5% for AGIs over 200k)
Averages for the 2012 tax year for zip code 12850, filed in 2013:
Average Adjusted Gross Income (AGI) in 2012: $60,555 (Individual Income Tax Returns)
Here:
$60,555
State:
$77,088
Salary/wage: $50,746 (reported on 84.9% of returns)
Here:
$50,746
State:
$60,593
(% of AGI for various income ranges: 73.5% for AGIs below $25k, 78.9% for AGIs $25k-50k, 75.5% for AGIs $50k-75k, 77.2% for AGIs $75k-100k, 80.5% for AGIs $100k-200k, 41.2% for AGIs over 200k)
Taxable interest for individuals: $748 (reported on 40.3% of returns)
This zip code:
$748
New York:
$3,125
(% of AGI for various income ranges: 0.6% for AGIs below $25k, 0.5% for AGIs $25k-50k, 0.2% for AGIs $50k-75k, 0.3% for AGIs $75k-100k, 0.3% for AGIs $100k-200k, 1.2% for AGIs over 200k)
Ordinary dividends: $2,709 (reported on 24.5% of returns)
Here:
$2,709
State:
$10,299
(% of AGI for various income ranges: 1.1% for AGIs below $25k, 0.6% for AGIs $25k-50k, 0.4% for AGIs $50k-75k, 0.6% for AGIs $75k-100k, 1.3% for AGIs $100k-200k, 2.0% for AGIs over 200k)
Net capital gain/loss in AGI: +$3,700 (reported on 11.5% of returns)
Here:
+$3,700
State:
+$42,474
(% of AGI for various income ranges: 0.3% for AGIs $75k-100k, 2.3% for AGIs $100k-200k)
Profit/loss from business: +$7,525 (reported on 14.4% of returns)
Here:
+$7,525
State:
+$16,168
(% of AGI for various income ranges: 7.7% for AGIs below $25k, 3.3% for AGIs $25k-50k, 1.3% for AGIs $50k-75k, 1.4% for AGIs $75k-100k, 1.3% for AGIs $100k-200k)
Taxable individual retirement arrangement distribution: $13,418 (reported on 7.9% of returns)
12850:
$13,418
New York:
$17,621
(% of AGI for various income ranges: 2.2% for AGIs below $25k, 1.5% for AGIs $25k-50k, 4.9% for AGIs $50k-75k, 2.0% for AGIs $100k-200k)
Total itemized deductions: $21,698 (20% of AGI, reported on 36.0% of returns)
Here:
$21,698
State:
$34,985
Here:
19.6% of AGI
State:
21.3% of AGI
(% of AGI for various income ranges: 9.6% for AGIs below $25k, 8.9% for AGIs $25k-50k, 13.5% for AGIs $50k-75k, 14.5% for AGIs $75k-100k, 15.1% for AGIs $100k-200k, 11.8% for AGIs over 200k)
Charity contributions: $1,897 (reported on 28.1% of returns)
Here:
$1,897
State:
$5,572
(% of AGI for various income ranges: 0.7% for AGIs $25k-50k, 0.6% for AGIs $50k-75k, 1.2% for AGIs $75k-100k, 1.0% for AGIs $100k-200k, 1.1% for AGIs over 200k)
Taxes paid: $10,644 (reported on 36.0% of returns)
12850:
$10,644
State:
$18,656
(% of AGI for various income ranges: 2.7% for AGIs below $25k, 3.3% for AGIs $25k-50k, 4.9% for AGIs $50k-75k, 6.2% for AGIs $75k-100k, 7.8% for AGIs $100k-200k, 8.8% for AGIs over 200k)
Earned income credit: $1,989 (reported on 13.7% of returns)
Here:
$1,989
State:
$2,230
(% of AGI for various income ranges: 4.9% for AGIs below $25k, 0.9% for AGIs $25k-50k)
Percentage of individuals using paid preparers for their 2012 taxes: 54.0%
Here:
54%
State:
66%
(% for various income ranges: 48.9% for AGIs below $25k, 54.5% for AGIs $25k-50k, 54.5% for AGIs $50k-75k, 57.1% for AGIs $75k-100k, 57.9% for AGIs $100k-200k, 75.0% for AGIs over 200k)
Averages for the 2004 tax year for zip code 12850, filed in 2005:
Average Adjusted Gross Income (AGI) in 2004: $50,788 (Individual Income Tax Returns)
Here:
$50,788
State:
$59,519
Salary/wage: $42,883 (reported on 88.3% of returns)
Here:
$42,883
State:
$50,673
(% of AGI for various income ranges: 119.8% for AGIs below $10k, 75.7% for AGIs $10k-25k, 80.1% for AGIs $25k-50k, 80.2% for AGIs $50k-75k, 86.0% for AGIs $75k-100k, 60.8% for AGIs over 100k)
Taxable interest for individuals: $962 (reported on 54.1% of returns)
This zip code:
$962
New York:
$2,377
(% of AGI for various income ranges: 3.1% for AGIs below $10k, 1.4% for AGIs $10k-25k, 0.9% for AGIs $25k-50k, 0.7% for AGIs $50k-75k, 0.5% for AGIs $75k-100k, 1.4% for AGIs over 100k)
Taxable dividends: $1,483 (reported on 26.4% of returns)
Here:
$1,483
State:
$5,394
(% of AGI for various income ranges: 2.7% for AGIs below $10k, 0.5% for AGIs $10k-25k, 0.6% for AGIs $25k-50k, 0.4% for AGIs $50k-75k, 0.9% for AGIs $75k-100k, 1.0% for AGIs over 100k)
Net capital gain/loss: +$7,973 (reported on 18.3% of returns)
Here:
+$7,973
State:
+$23,581
(% of AGI for various income ranges: 0.7% for AGIs below $10k, 2.1% for AGIs $10k-25k, 0.2% for AGIs $25k-50k, 0.0% for AGIs $50k-75k, 2.2% for AGIs $75k-100k, 6.6% for AGIs over 100k)
Profit/loss from business: +$12,276 (reported on 15.0% of returns)
Here:
+$12,276
State:
+$13,809
(% of AGI for various income ranges: 12.1% for AGIs below $10k, 5.1% for AGIs $10k-25k, 2.8% for AGIs $25k-50k, 0.9% for AGIs $50k-75k, 0.9% for AGIs $75k-100k, 6.5% for AGIs over 100k)
IRA payment deduction: $1,679 (reported on 2.3% of returns)
12850:
$1,679
New York:
$3,115
Total itemized deductions: $16,770 (18% of AGI, reported on 36.7% of returns)
Here:
$16,770
State:
$25,864
Here:
18.4% of AGI
State:
21.9% of AGI
(% of AGI for various income ranges: 7.3% for AGIs $10k-25k, 10.0% for AGIs $25k-50k, 12.8% for AGIs $50k-75k, 15.8% for AGIs $75k-100k, 12.3% for AGIs over 100k)
Charity contributions deductions: $1,947 (2% of AGI, reported on 33.0% of returns)
Here:
$1,947
State:
$4,439
Here:
2.1% of AGI
State:
3.6% of AGI
(% of AGI for various income ranges: 0.3% for AGIs $10k-25k, 1.1% for AGIs $25k-50k, 1.5% for AGIs $50k-75k, 1.7% for AGIs $75k-100k, 1.2% for AGIs over 100k)
Total tax: $7,660 (reported on 79.4% of returns)
12850:
$7,660
State:
$11,730
(% of AGI for various income ranges: 3.4% for AGIs below $10k, 4.7% for AGIs $10k-25k, 6.9% for AGIs $25k-50k, 8.6% for AGIs $50k-75k, 9.6% for AGIs $75k-100k, 19.7% for AGIs over 100k)
Earned income credit: $1,554 (reported on 12.2% of returns)
Here:
$1,554
State:
$1,757
Percentage of individuals using paid preparers for their 2004 taxes: 56.6%
Here:
57%
State:
67%
(% for various income ranges: 43.9% for AGIs below $10k, 59.5% for AGIs $10k-25k, 54.3% for AGIs $25k-50k, 57.6% for AGIs $50k-75k, 62.3% for AGIs $75k-100k, 69.9% for AGIs over 100k)
Household received Food Stamps/SNAP in the past 12 months: 151 Household did not receive Food Stamps/SNAP in the past 12 months: 910
Women who had a birth in the past 12 months: 17 (17 now married, 0 unmarried) Women who did not have a birth in the past 12 months: 542 (322 now married, 213 unmarried)
Housing units in zip code 12850 with a mortgage: 566 (42 second mortgage, 43 both second mortgage and home equity loan) Median monthly owner costs for units with a mortgage: $1,669 Median monthly owner costs for units without a mortgage: $708
Residents with income below the poverty level in 2022:
This zip code:
7.8%
Whole state:
14.3%
Residents with income below 50% of the poverty level in 2022:
This zip code:
4.8%
Whole state:
6.8%
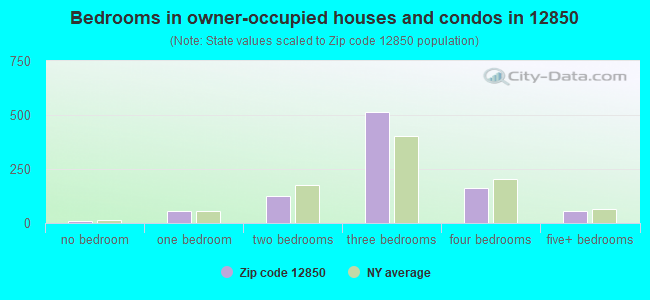
Median number of rooms in houses and condos:
Here:
6.2
State:
6.3
Median number of rooms in apartments:
Here:
5.2
State:
3.8
Notable locations in this zip code not listed on our city pages
Cemeteries: Howard Cemetery (1), Frink Cemetery (2), Grenell Cemetery (3), Middle Grove Cemetery (4), Welch Road Cemetery (5). Display/hide their locations on the map
Lakes, reservoirs, and swamps: Ronna Pond (A), Round Lake (B), Lake Desolation (C), Packers Pond (D), Cooks Reservoir (E), Ireland Vly (F), Lake Nancy (G), Tamarack Vly (H). Display/hide their locations on the map
Streams, rivers, and creeks: Frink Brook (A), West Vly Creek (B), Dudley Brook (C), Balsam Brook (D), Black Creek (E), Rose Brook (F). Display/hide their locations on the map
In group quarters: 13 (-1 institutionalized population)
Size of family households: 377 2-persons, 229 3-persons, 142 4-persons, 60 5-persons, 6 7-or-more-persons
Size of nonfamily households: 189 1-person, 50 2-persons
340 married couples with children.
69 single-parent households (27 men, 42 women).
98.2% of residents of 12850 zip code speak English at home.
0.2% of residents speak Spanish at home (100% very well).
0.6% of residents speak other Indo-European language at home (75% very well, 25% well).
0.9% of residents speak other language at home (100% very well).
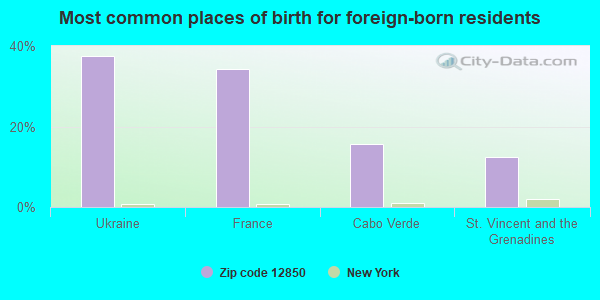
Foreign born population: 33 (1.2%) (85.5% of them are naturalized citizens)
This zip code:
1.2%
Whole state:
22.7%
38%Ukraine
34%France
16%Cabo Verde
12%St. Vincent and the Grenadines
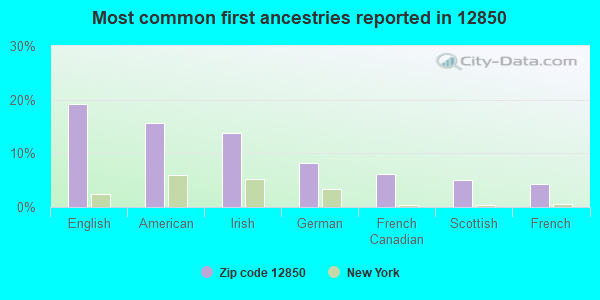
19%English
16%American
14%Irish
8%German
6%French Canadian
5%Scottish
4%French
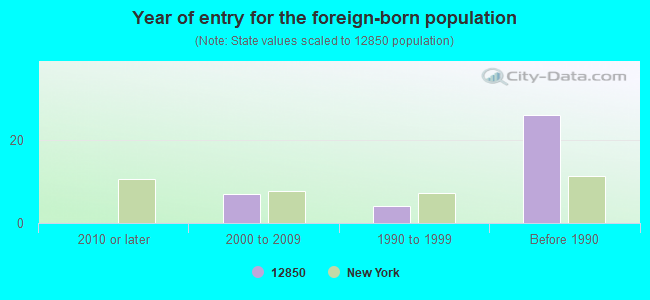
Year of entry for the foreign-born population
02010 or later
72000 to 2009
41990 to 1999
26Before 1990
Facilities with environmental interests located in this zip code:
GALWAY HERSHEY LF (RD #1 in MIDDLEGROVE, NY)
CRITERIA AND HAZARDOUS AIR POLLUTANT INVENTORY (Inventory of air pollution sources) Business SIC classification: REFUSE SYSTEMS Business NAICS classification: SOLID WASTE LANDFILL.
Housing units lacking complete plumbing facilities: 1.1% Housing units lacking complete kitchen facilities: 1.1%
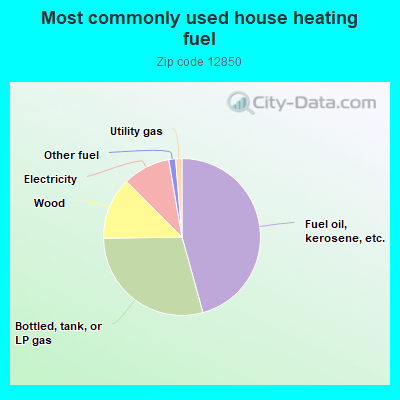
45.8%Fuel oil, kerosene, etc.
29.1%Bottled, tank, or LP gas
12.8%Wood
9.8%Electricity
1.4%Other fuel
1.3%Utility gas
Population in 1990: 1,760. Population change in the 1990s: +482 (+27.4%).
Place of birth for U.S.-born residents:
This state: 2,042
Northeast: 228
Midwest: 69
South: 157
West: 148
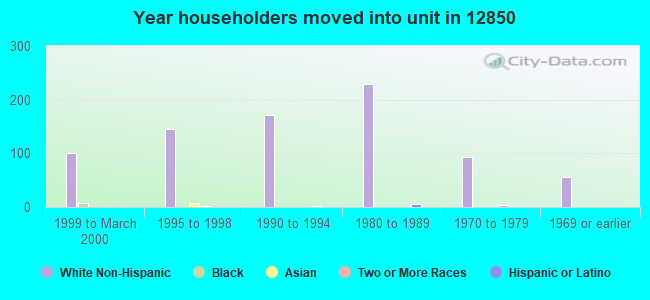
67% of the 12850 zip code residents lived in the same house 5 years ago. Out of people who lived in different houses, 57% lived in this county. Out of people who lived in different counties, 50% lived in New York.
88% of the 12850 zip code residents lived in the same house 1 year ago. Out of people who lived in different houses, 18% moved from this county. Out of people who lived in different houses, 57% moved from different county within same state. Out of people who lived in different houses, 14% moved from different state. Out of people who lived in different houses, 14% moved from abroad.
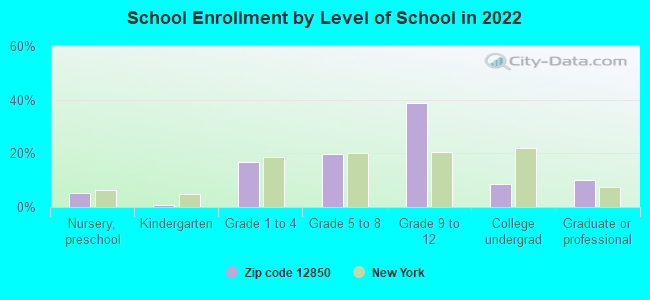
Private vs. public school enrollment:
Students in private schools in grades 1 to 8 (elementary and middle school): 25
Here:
13.1%
New York:
15.6%
Students in private schools in grades 9 to 12 (high school): 2
Here:
1.3%
New York:
15.0%
Students in private undergraduate colleges: 16
Here:
35.6%
New York:
39.2%
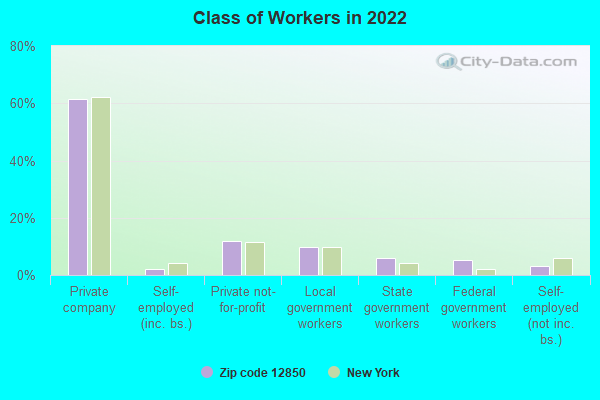
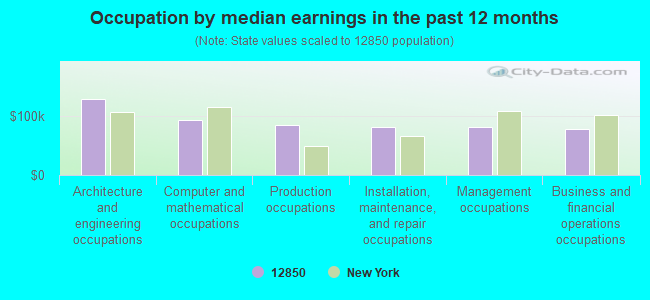
Occupation by median earnings in the past 12 months ($)
128,341Architecture and engineering occupations
92,208Computer and mathematical occupations
85,051Production occupations
80,907Installation, maintenance, and repair occupations
80,738Management occupations
78,322Business and financial operations occupations
Top industries in this zip code by the number of employees in 2005:
Construction: Commercial and Institutional Building Construction (10-19 employees: 1 establishment, 1-4 employees: 1 establishment)
Professional, Scientific, and Technical Services: Veterinary Services (10-19: 1)
Construction: Water and Sewer Line and Related Structures Construction (5-9: 1)
Other Services (except Public Administration): General Automotive Repair (1-4: 1)
People in group quarters in 2010:
10 people in group homes intended for adults
5 people in workers' group living quarters and job corps centers
People in group quarters in 2000:
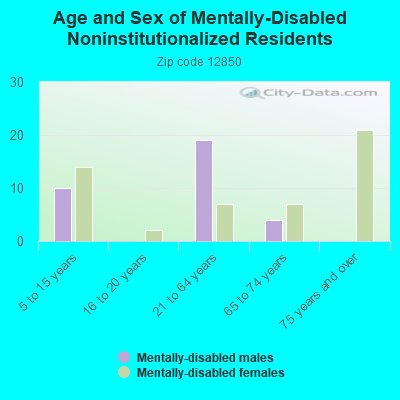
9 people in homes for the mentally retarded
Fatal accident statistics in 2014:
Fatal accident count: 1
Vehicles involved in fatal accidents: 2
Fatal accidents caused by drunken drivers: 1
Fatalities: 1
Persons involved in fatal accidents: 2
Pedestrians involved in fatal accidents: 0
Fatal accident statistics in 2012:
Fatal accident count: 3
Vehicles involved in fatal accidents: 6
Fatal accidents caused by drunken drivers: 0
Fatalities: 3
Persons involved in fatal accidents: 12
Pedestrians involved in fatal accidents: 0
Home Mortgage Disclosure Act Aggregated Statistics For Year 2009 (Based on 8 partial tracts)
A) FHA, FSA/RHS & VA Home Purchase Loans
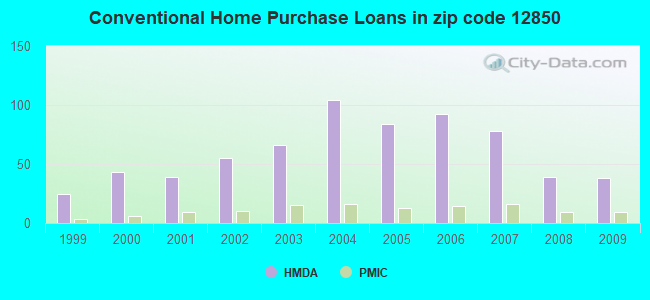
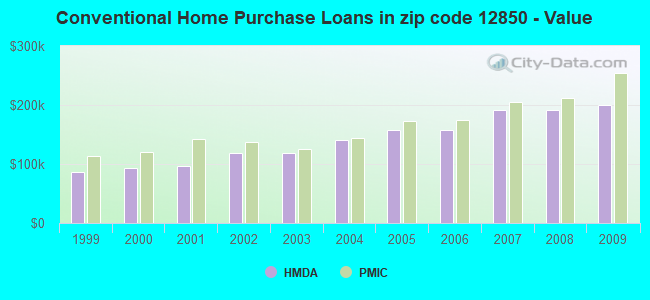
B) Conventional Home Purchase Loans
C) Refinancings
D) Home Improvement Loans
F) Non-occupant Loans on < 5 Family Dwellings (A B C & D)
G) Loans On Manufactured Home Dwelling (A B C & D)
Number
Average Value
Number
Average Value
Number
Average Value
Number
Average Value
Number
Average Value
Number
Average Value
LOANS ORIGINATED
17
$180,331
38
$200,003
106
$179,762
13
$61,148
9
$155,958
4
$75,720
APPLICATIONS APPROVED, NOT ACCEPTED
0
$0
4
$156,395
15
$187,907
1
$16,250
2
$174,500
2
$61,180
APPLICATIONS DENIED
4
$130,880
15
$116,168
37
$188,984
6
$30,943
3
$177,397
14
$62,482
APPLICATIONS WITHDRAWN
2
$176,860
2
$256,780
20
$168,096
2
$122,145
2
$96,070
1
$158,440
FILES CLOSED FOR INCOMPLETENESS
1
$113,190
1
$93,830
4
$164,542
1
$153,370
0
$0
1
$17,770
Aggregated Statistics For Year 2008 (Based on 8 partial tracts)
A) FHA, FSA/RHS & VA Home Purchase Loans
B) Conventional Home Purchase Loans
C) Refinancings
D) Home Improvement Loans
F) Non-occupant Loans on < 5 Family Dwellings (A B C & D)
G) Loans On Manufactured Home Dwelling (A B C & D)
Number
Average Value
Number
Average Value
Number
Average Value
Number
Average Value
Number
Average Value
Number
Average Value
LOANS ORIGINATED
13
$186,236
39
$192,241
81
$152,477
25
$65,553
9
$129,223
10
$61,331
APPLICATIONS APPROVED, NOT ACCEPTED
3
$163,593
13
$182,301
15
$176,554
4
$84,982
2
$147,670
7
$71,271
APPLICATIONS DENIED
2
$177,940
18
$134,872
55
$175,152
19
$68,238
2
$142,685
22
$70,959
APPLICATIONS WITHDRAWN
1
$163,570
2
$136,715
28
$184,657
5
$106,798
2
$324,150
2
$115,410
FILES CLOSED FOR INCOMPLETENESS
0
$0
2
$168,210
12
$248,824
1
$58,800
2
$160,155
1
$68,700
Aggregated Statistics For Year 2007 (Based on 8 partial tracts)
A) FHA, FSA/RHS & VA Home Purchase Loans
B) Conventional Home Purchase Loans
C) Refinancings
D) Home Improvement Loans
F) Non-occupant Loans on < 5 Family Dwellings (A B C & D)
G) Loans On Manufactured Home Dwelling (A B C & D)
Number
Average Value
Number
Average Value
Number
Average Value
Number
Average Value
Number
Average Value
Number
Average Value
LOANS ORIGINATED
8
$152,562
78
$190,952
99
$145,697
35
$44,048
9
$155,141
16
$69,866
APPLICATIONS APPROVED, NOT ACCEPTED
0
$0
14
$160,864
16
$154,725
6
$44,307
2
$163,920
4
$49,602
APPLICATIONS DENIED
3
$62,370
31
$131,548
70
$153,253
37
$56,644
2
$163,040
18
$50,211
APPLICATIONS WITHDRAWN
2
$160,330
7
$140,243
42
$156,657
6
$110,328
1
$75,090
4
$78,992
FILES CLOSED FOR INCOMPLETENESS
0
$0
6
$120,233
11
$150,965
2
$128,655
0
$0
0
$0
Aggregated Statistics For Year 2006 (Based on 8 partial tracts)
A) FHA, FSA/RHS & VA Home Purchase Loans
B) Conventional Home Purchase Loans
C) Refinancings
D) Home Improvement Loans
F) Non-occupant Loans on < 5 Family Dwellings (A B C & D)
G) Loans On Manufactured Home Dwelling (A B C & D)
Number
Average Value
Number
Average Value
Number
Average Value
Number
Average Value
Number
Average Value
Number
Average Value
LOANS ORIGINATED
6
$161,775
92
$158,274
109
$137,169
45
$52,820
11
$160,534
16
$58,596
APPLICATIONS APPROVED, NOT ACCEPTED
0
$0
10
$162,937
27
$130,549
6
$78,645
2
$35,010
7
$91,260
APPLICATIONS DENIED
0
$0
24
$114,666
96
$127,097
31
$44,816
8
$92,465
16
$66,285
APPLICATIONS WITHDRAWN
1
$75,290
13
$147,660
50
$135,126
7
$65,479
4
$152,645
0
$0
FILES CLOSED FOR INCOMPLETENESS
0
$0
5
$143,356
17
$165,904
1
$115,460
1
$239,190
0
$0
Aggregated Statistics For Year 2005 (Based on 8 partial tracts)
A) FHA, FSA/RHS & VA Home Purchase Loans
B) Conventional Home Purchase Loans
C) Refinancings
D) Home Improvement Loans
F) Non-occupant Loans on < 5 Family Dwellings (A B C & D)
G) Loans On Manufactured Home Dwelling (A B C & D)
Number
Average Value
Number
Average Value
Number
Average Value
Number
Average Value
Number
Average Value
Number
Average Value
LOANS ORIGINATED
5
$161,406
84
$157,328
123
$130,926
38
$54,842
18
$154,392
15
$44,151
APPLICATIONS APPROVED, NOT ACCEPTED
0
$0
13
$144,731
29
$145,554
4
$42,022
4
$135,475
4
$65,972
APPLICATIONS DENIED
1
$102,700
30
$93,891
87
$112,758
23
$47,804
3
$166,173
27
$50,691
APPLICATIONS WITHDRAWN
0
$0
9
$180,978
75
$126,975
8
$145,476
4
$110,568
5
$79,740
FILES CLOSED FOR INCOMPLETENESS
0
$0
4
$155,052
19
$119,866
2
$93,635
2
$102,080
0
$0
Aggregated Statistics For Year 2004 (Based on 8 partial tracts)
A) FHA, FSA/RHS & VA Home Purchase Loans
B) Conventional Home Purchase Loans
C) Refinancings
D) Home Improvement Loans
F) Non-occupant Loans on < 5 Family Dwellings (A B C & D)
G) Loans On Manufactured Home Dwelling (A B C & D)
Number
Average Value
Number
Average Value
Number
Average Value
Number
Average Value
Number
Average Value
Number
Average Value
LOANS ORIGINATED
11
$125,176
104
$140,629
113
$113,946
28
$52,485
14
$100,269
11
$52,399
APPLICATIONS APPROVED, NOT ACCEPTED
0
$0
25
$111,817
24
$111,789
4
$54,400
2
$104,235
7
$57,063
APPLICATIONS DENIED
0
$0
27
$77,666
74
$100,102
14
$25,196
7
$113,236
30
$52,828
APPLICATIONS WITHDRAWN
3
$127,057
8
$115,201
64
$105,603
8
$58,826
2
$101,345
7
$76,690
FILES CLOSED FOR INCOMPLETENESS
0
$0
7
$125,841
8
$163,924
2
$85,175
1
$28,940
1
$20,500
Aggregated Statistics For Year 2003 (Based on 8 partial tracts)
A) FHA, FSA/RHS & VA Home Purchase Loans
B) Conventional Home Purchase Loans
C) Refinancings
D) Home Improvement Loans
F) Non-occupant Loans on < 5 Family Dwellings (A B C & D)
Number
Average Value
Number
Average Value
Number
Average Value
Number
Average Value
Number
Average Value
LOANS ORIGINATED
13
$101,655
66
$118,473
216
$114,334
14
$26,618
15
$93,300
APPLICATIONS APPROVED, NOT ACCEPTED
1
$70,020
12
$91,763
32
$98,597
3
$45,053
3
$80,390
APPLICATIONS DENIED
0
$0
27
$83,991
76
$97,806
14
$26,846
5
$83,202
APPLICATIONS WITHDRAWN
1
$117,030
9
$126,672
47
$104,498
1
$11,310
3
$95,337
FILES CLOSED FOR INCOMPLETENESS
0
$0
2
$278,630
8
$84,131
1
$24,220
0
$0
Aggregated Statistics For Year 2002 (Based on 6 partial tracts)
A) FHA, FSA/RHS & VA Home Purchase Loans
B) Conventional Home Purchase Loans
C) Refinancings
D) Home Improvement Loans
F) Non-occupant Loans on < 5 Family Dwellings (A B C & D)
Number
Average Value
Number
Average Value
Number
Average Value
Number
Average Value
Number
Average Value
LOANS ORIGINATED
7
$116,203
55
$119,319
94
$103,388
10
$22,417
7
$92,033
APPLICATIONS APPROVED, NOT ACCEPTED
0
$0
8
$50,098
15
$100,526
4
$36,270
0
$0
APPLICATIONS DENIED
1
$47,290
30
$55,762
33
$87,593
11
$13,417
2
$108,410
APPLICATIONS WITHDRAWN
1
$127,900
7
$128,284
27
$96,261
4
$19,412
1
$79,750
FILES CLOSED FOR INCOMPLETENESS
0
$0
0
$0
5
$95,788
0
$0
0
$0
Aggregated Statistics For Year 2001 (Based on 6 partial tracts)
A) FHA, FSA/RHS & VA Home Purchase Loans
B) Conventional Home Purchase Loans
C) Refinancings
D) Home Improvement Loans
F) Non-occupant Loans on < 5 Family Dwellings (A B C & D)
Number
Average Value
Number
Average Value
Number
Average Value
Number
Average Value
Number
Average Value
LOANS ORIGINATED
7
$99,269
39
$97,348
68
$100,799
14
$14,449
4
$101,875
APPLICATIONS APPROVED, NOT ACCEPTED
0
$0
12
$56,838
10
$64,200
2
$46,075
1
$73,060
APPLICATIONS DENIED
1
$104,530
35
$37,068
39
$78,030
18
$11,498
2
$85,225
APPLICATIONS WITHDRAWN
1
$77,810
5
$67,474
26
$81,251
5
$22,838
1
$30,250
FILES CLOSED FOR INCOMPLETENESS
0
$0
1
$26,890
5
$76,980
0
$0
0
$0
Aggregated Statistics For Year 2000 (Based on 6 partial tracts)
A) FHA, FSA/RHS & VA Home Purchase Loans
B) Conventional Home Purchase Loans
C) Refinancings
D) Home Improvement Loans
F) Non-occupant Loans on < 5 Family Dwellings (A B C & D)
Number
Average Value
Number
Average Value
Number
Average Value
Number
Average Value
Number
Average Value
LOANS ORIGINATED
10
$96,940
43
$92,760
28
$73,248
14
$16,388
4
$77,725
APPLICATIONS APPROVED, NOT ACCEPTED
0
$0
16
$60,314
8
$60,165
4
$28,485
1
$55,540
APPLICATIONS DENIED
2
$79,915
60
$45,736
33
$64,973
10
$17,713
2
$138,930
APPLICATIONS WITHDRAWN
1
$94,330
5
$81,410
19
$68,100
2
$39,565
2
$65,980
FILES CLOSED FOR INCOMPLETENESS
0
$0
0
$0
2
$125,235
0
$0
0
$0
Aggregated Statistics For Year 1999 (Based on 3 partial tracts)
A) FHA, FSA/RHS & VA Home Purchase Loans
B) Conventional Home Purchase Loans
C) Refinancings
D) Home Improvement Loans
F) Non-occupant Loans on < 5 Family Dwellings (A B C & D)
2002 - 2018 National Fire Incident Reporting System (NFIRS) incidents
According to the data from the years 2002 - 2018 the average number of fire incidents per year is 12. The highest number of reported fires - 32 took place in 2014, and the least - 1 in 2010. The data has an increasing trend.
When looking into fire subcategories, the most incidents belonged to: Structure Fires (46.7%), and Outside Fires (28.3%).
Fire incident types reported to NFIRS in Zip Code 12850


 Nearest zip codes: 12863, 12074, 12859, 12822, 12086, 12833.


 According to the data from the years 2002 - 2018 the average number of fire incidents per year is 12. The highest number of reported fires - 32 took place in 2014, and the least - 1 in 2010. The data has an increasing trend.
 When looking into fire subcategories, the most incidents belonged to: Structure Fires (46.7%), and Outside Fires (28.3%).