Estimated zip code population in 2022: 1,621 Zip code population in 2010: 1,865 Zip code population in 2000: 1,554
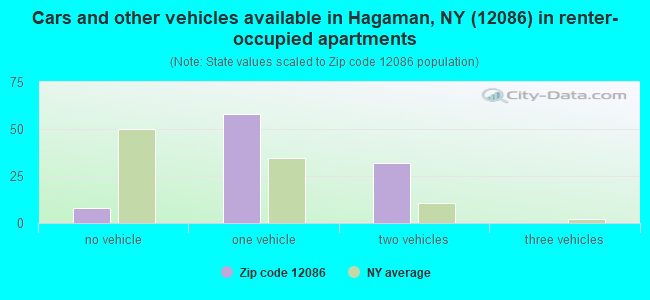
Houses and condos: 916 Renter-occupied apartments: 97
% of renters here:
14%
State:
46%
March 2022 cost of living index in zip code 12086: 104.4 (near average, U.S. average is 100)
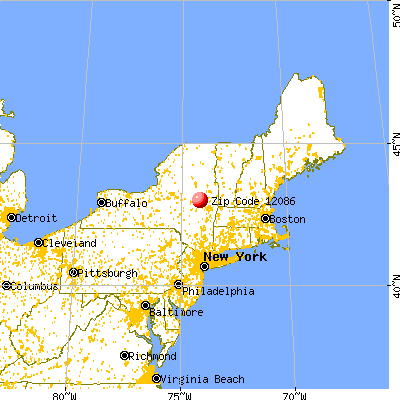
Land area: 6.1 sq. mi. Water area: 0.1 sq. mi.
Population density: 268 people per square mile
(very low).
OSM Map
General Map
Google Map
MSN Map
OSM Map
General Map
Google Map
MSN Map
OSM Map
General Map
Google Map
MSN Map
OSM Map
General Map
Google Map
MSN Map
Please wait while loading the map...
Real estate property taxes paid for housing units in 2022:
This zip code:
2.0% ($3,954)
New York:
1.5% ($6,180)
Median real estate property taxes paid for housing units with mortgages in 2022: $4,809 (2.2%) Median real estate property taxes paid for housing units with no mortgage in 2022: $2,744 (1.4%)
Business Search- 14 Million verified businesses
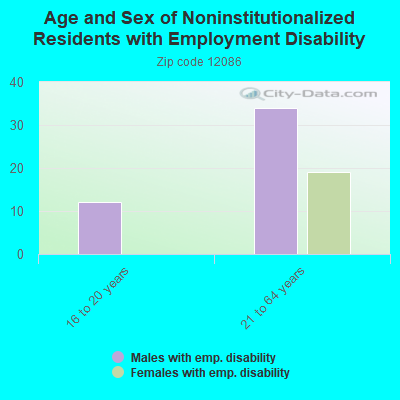
Males: 717
(44.2%)
Females: 904
(55.8%)
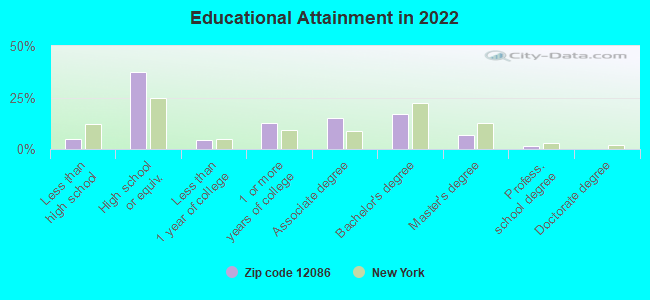
For population 25 years and over in 12086:
High school or higher: 93.6%
Bachelor's degree or higher: 25.1%
Graduate or professional degree: 8.3%
Mean travel time to work (commute): 21.3 minutes
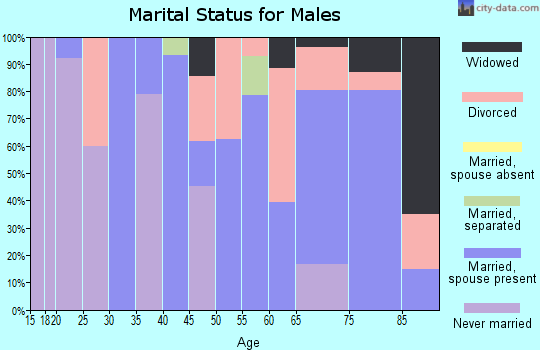
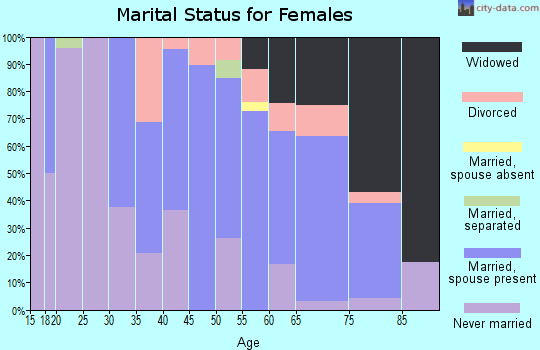
For population 15 years and over in 12086:
Never married: 27.1%
Now married: 47.7%
Separated: 6.4%
Widowed: 6.9%
Divorced: 11.8%
Zip code 12086 compared to state average:
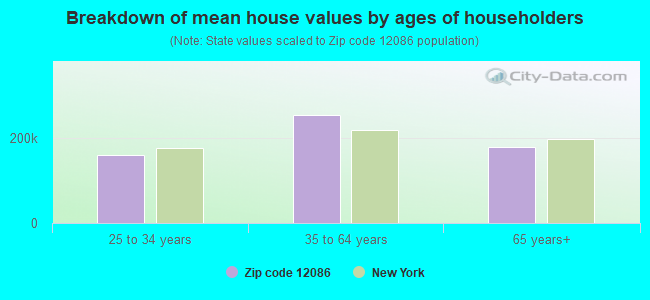
Median house value below state average.
Unemployed percentage significantly below state average.
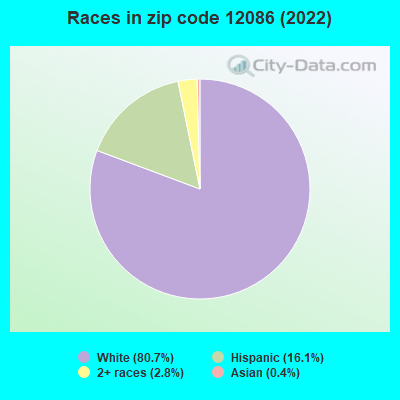
Black race population percentage significantly below state average.
Median age significantly above state average.
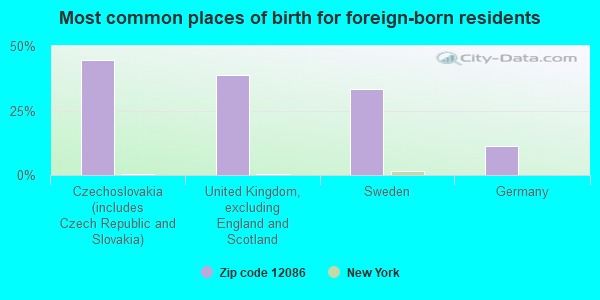
Foreign-born population percentage significantly below state average.
Renting percentage significantly below state average.
Length of stay since moving in significantly above state average.
Estimated median house/condo value in 2022: $201,503
12086:
$201,503
New York:
$400,400
According to our research of New York and other state lists, there was 1 registered sex offender living in 12086 zip code as of April 27, 2024. The ratio of all residents to sex offenders in zip code 12086 is 1,609 to 1. The ratio of registered sex offenders to all residents in this zip code is lower than the state average.
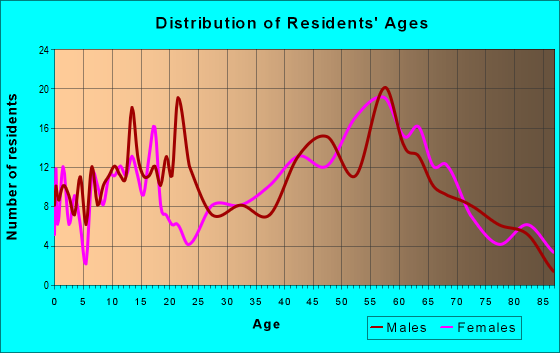
Median resident age:
This zip code:
55.5 years
New York median age:
40.0 years
Average household size:
This zip code:
2.3 people
New York:
2.5 people
Averages for the 2020 tax year for zip code 12086, filed in 2021:
Average Adjusted Gross Income (AGI) in 2020: $61,266 (Individual Income Tax Returns)
Here:
$61,266
State:
$90,930
Salary/wage: $53,042 (reported on 77.6% of returns)
Here:
$53,042
State:
$72,104
(% of AGI for various income ranges: 874.1% for AGIs below $25k, 3380.5% for AGIs $25k-50k, 6232.9% for AGIs $50k-75k, 7287.1% for AGIs $75k-100k, 16272.7% for AGIs $100k-200k)
Taxable interest for individuals: $531 (reported on 39.8% of returns)
This zip code:
$531
New York:
$3,075
(% of AGI for various income ranges: 10.6% for AGIs below $25k, 9.5% for AGIs $25k-50k, 30.7% for AGIs $50k-75k, 80.0% for AGIs $75k-100k, 63.6% for AGIs $100k-200k)
Ordinary dividends: $1,921 (reported on 24.5% of returns)
Here:
$1,921
State:
$11,095
(% of AGI for various income ranges: 24.1% for AGIs below $25k, 52.9% for AGIs $25k-50k, 44.3% for AGIs $50k-75k, 91.4% for AGIs $75k-100k, 166.4% for AGIs $100k-200k)
Net capital gain/loss in AGI: +$3,294 (reported on 16.3% of returns)
Here:
+$3,294
State:
+$44,925
(% of AGI for various income ranges: 3.5% for AGIs below $25k, 15.7% for AGIs $25k-50k, 25.7% for AGIs $50k-75k, 98.6% for AGIs $75k-100k, 348.2% for AGIs $100k-200k)
Profit/loss from business: +$5,660 (reported on 10.2% of returns)
Here:
+$5,660
State:
+$14,940
(% of AGI for various income ranges: 66.5% for AGIs below $25k, 61.0% for AGIs $25k-50k, 158.6% for AGIs $50k-75k, 93.6% for AGIs $100k-200k)
Taxable individual retirement arrangement distribution: $12,267 (reported on 12.2% of returns)
12086:
$12,267
New York:
$19,609
(% of AGI for various income ranges: 241.4% for AGIs $25k-50k, 487.1% for AGIs $75k-100k, 567.3% for AGIs $100k-200k)
Total itemized deductions: $27,200 (reported on 4.1% of returns)
Here:
$27,200
State:
$39,326
(% of AGI for various income ranges: 1554.3% for AGIs $75k-100k)
Charity contributions: $6,850 (reported on 2.0% of returns)
Here:
$6,850
State:
$15,420
(% of AGI for various income ranges: 97.9% for AGIs $50k-75k)
Taxes paid: $8,950 (reported on 4.1% of returns)
12086:
$8,950
State:
$9,183
(% of AGI for various income ranges: 80.0% for AGIs below $25k, 317.1% for AGIs $75k-100k)
Earned income credit: $1,400 (reported on 10.2% of returns)
Here:
$1,400
State:
$2,138
(% of AGI for various income ranges: 45.9% for AGIs below $25k, 29.5% for AGIs $25k-50k)
Percentage of individuals using paid preparers for their 2020 taxes: 95.9%
Here:
96%
State:
95%
(% for various income ranges: 95.8% for AGIs below $25k, 96.3% for AGIs $25k-50k, 100.0% for AGIs $50k-75k, 90.0% for AGIs $75k-100k, 94.4% for AGIs $100k-200k)
Averages for the 2012 tax year for zip code 12086, filed in 2013:
Average Adjusted Gross Income (AGI) in 2012: $51,938 (Individual Income Tax Returns)
Here:
$51,938
State:
$77,088
Salary/wage: $46,277 (reported on 78.8% of returns)
Here:
$46,277
State:
$60,593
(% of AGI for various income ranges: 66.9% for AGIs below $25k, 69.2% for AGIs $25k-50k, 70.5% for AGIs $50k-75k, 72.8% for AGIs $75k-100k, 69.8% for AGIs $100k-200k)
Taxable interest for individuals: $549 (reported on 45.5% of returns)
This zip code:
$549
New York:
$3,125
(% of AGI for various income ranges: 1.1% for AGIs below $25k, 0.8% for AGIs $25k-50k, 0.7% for AGIs $50k-75k, 0.3% for AGIs $75k-100k, 0.2% for AGIs $100k-200k)
Ordinary dividends: $1,566 (reported on 32.3% of returns)
Here:
$1,566
State:
$10,299
(% of AGI for various income ranges: 2.3% for AGIs below $25k, 1.1% for AGIs $25k-50k, 0.8% for AGIs $50k-75k, 0.3% for AGIs $75k-100k, 1.0% for AGIs $100k-200k)
Net capital gain/loss in AGI: +$1,012 (reported on 16.2% of returns)
Here:
+$1,012
State:
+$42,474
(% of AGI for various income ranges: 1.2% for AGIs $100k-200k)
Profit/loss from business: +$6,967 (reported on 12.1% of returns)
Here:
+$6,967
State:
+$16,168
(% of AGI for various income ranges: 5.4% for AGIs below $25k, 3.0% for AGIs $25k-50k, 1.6% for AGIs $50k-75k, 1.0% for AGIs $100k-200k)
Taxable individual retirement arrangement distribution: $8,623 (reported on 13.1% of returns)
12086:
$8,623
New York:
$17,621
(% of AGI for various income ranges: 4.7% for AGIs below $25k, 3.1% for AGIs $25k-50k, 1.8% for AGIs $50k-75k, 4.6% for AGIs $75k-100k)
Total itemized deductions: $18,494 (20% of AGI, reported on 31.3% of returns)
Here:
$18,494
State:
$34,985
Here:
20.4% of AGI
State:
21.3% of AGI
(% of AGI for various income ranges: 8.8% for AGIs below $25k, 6.7% for AGIs $25k-50k, 9.0% for AGIs $50k-75k, 13.1% for AGIs $75k-100k, 14.1% for AGIs $100k-200k)
Charity contributions: $1,964 (reported on 25.3% of returns)
Here:
$1,964
State:
$5,572
(% of AGI for various income ranges: 0.6% for AGIs $25k-50k, 0.9% for AGIs $50k-75k, 0.9% for AGIs $75k-100k, 1.4% for AGIs $100k-200k)
Taxes paid: $8,948 (reported on 31.3% of returns)
12086:
$8,948
State:
$18,656
(% of AGI for various income ranges: 2.5% for AGIs below $25k, 3.0% for AGIs $25k-50k, 3.9% for AGIs $50k-75k, 6.4% for AGIs $75k-100k, 7.6% for AGIs $100k-200k)
Earned income credit: $1,840 (reported on 10.1% of returns)
Here:
$1,840
State:
$2,230
(% of AGI for various income ranges: 3.3% for AGIs below $25k, 0.6% for AGIs $25k-50k)
Percentage of individuals using paid preparers for their 2012 taxes: 57.6%
Here:
58%
State:
66%
(% for various income ranges: 51.6% for AGIs below $25k, 61.5% for AGIs $25k-50k, 58.8% for AGIs $50k-75k, 58.3% for AGIs $75k-100k, 61.5% for AGIs $100k-200k)
Averages for the 2004 tax year for zip code 12086, filed in 2005:
Average Adjusted Gross Income (AGI) in 2004: $42,490 (Individual Income Tax Returns)
Here:
$42,490
State:
$59,519
Salary/wage: $37,757 (reported on 84.8% of returns)
Here:
$37,757
State:
$50,673
(% of AGI for various income ranges: 94.0% for AGIs below $10k, 66.4% for AGIs $10k-25k, 81.4% for AGIs $25k-50k, 73.4% for AGIs $50k-75k, 85.2% for AGIs $75k-100k, 66.1% for AGIs over 100k)
Taxable interest for individuals: $860 (reported on 60.7% of returns)
This zip code:
$860
New York:
$2,377
(% of AGI for various income ranges: 5.2% for AGIs below $10k, 3.7% for AGIs $10k-25k, 1.1% for AGIs $25k-50k, 0.7% for AGIs $50k-75k, 0.9% for AGIs $75k-100k, 0.9% for AGIs over 100k)
Taxable dividends: $1,564 (reported on 36.5% of returns)
Here:
$1,564
State:
$5,394
(% of AGI for various income ranges: 2.6% for AGIs below $10k, 2.5% for AGIs $10k-25k, 1.0% for AGIs $25k-50k, 1.9% for AGIs $50k-75k, 0.5% for AGIs $75k-100k, 1.2% for AGIs over 100k)
Net capital gain/loss: +$629 (reported on 21.3% of returns)
Here:
+$629
State:
+$23,581
(% of AGI for various income ranges: -2.3% for AGIs below $10k, -0.4% for AGIs $10k-25k, -0.1% for AGIs $25k-50k, 0.5% for AGIs $50k-75k, 0.2% for AGIs $75k-100k, 1.1% for AGIs over 100k)
Profit/loss from business: +$9,779 (reported on 14.6% of returns)
Here:
+$9,779
State:
+$13,809
(% of AGI for various income ranges: 9.9% for AGIs below $10k, 4.2% for AGIs $10k-25k, 2.1% for AGIs $25k-50k, 1.7% for AGIs $50k-75k, 0.4% for AGIs $75k-100k, 7.8% for AGIs over 100k)
IRA payment deduction: $2,846 (reported on 4.1% of returns)
12086:
$2,846
New York:
$3,115
Total itemized deductions: $15,705 (21% of AGI, reported on 32.7% of returns)
Here:
$15,705
State:
$25,864
Here:
21.2% of AGI
State:
21.9% of AGI
(% of AGI for various income ranges: 7.1% for AGIs $10k-25k, 9.7% for AGIs $25k-50k, 12.4% for AGIs $50k-75k, 14.0% for AGIs $75k-100k, 15.3% for AGIs over 100k)
Charity contributions deductions: $2,240 (3% of AGI, reported on 30.8% of returns)
Here:
$2,240
State:
$4,439
Here:
3.0% of AGI
State:
3.6% of AGI
(% of AGI for various income ranges: 0.7% for AGIs $10k-25k, 1.0% for AGIs $25k-50k, 1.9% for AGIs $50k-75k, 1.7% for AGIs $75k-100k, 2.4% for AGIs over 100k)
Total tax: $5,120 (reported on 82.1% of returns)
12086:
$5,120
State:
$11,730
(% of AGI for various income ranges: 2.3% for AGIs below $10k, 4.5% for AGIs $10k-25k, 7.1% for AGIs $25k-50k, 8.8% for AGIs $50k-75k, 10.5% for AGIs $75k-100k, 15.8% for AGIs over 100k)
Earned income credit: $1,551 (reported on 9.3% of returns)
Here:
$1,551
State:
$1,757
Percentage of individuals using paid preparers for their 2004 taxes: 59.1%
Here:
59%
State:
67%
(% for various income ranges: 46.2% for AGIs below $10k, 57.3% for AGIs $10k-25k, 61.5% for AGIs $25k-50k, 62.3% for AGIs $50k-75k, 61.8% for AGIs $75k-100k, 76.4% for AGIs over 100k)
Likely homosexual households (counted as self-reported same-sex unmarried-partner households)
Lesbian couples: 0.5% of all households
Gay men: 0.0% of all households
Household received Food Stamps/SNAP in the past 12 months: 78 Household did not receive Food Stamps/SNAP in the past 12 months: 606
Women who had a birth in the past 12 months: 4 (0 now married, 4 unmarried) Women who did not have a birth in the past 12 months: 331 (133 now married, 197 unmarried)
Housing units in zip code 12086 with a mortgage: 313 (21 second mortgage, 21 both second mortgage and home equity loan) Houses without a mortgage: 81
Median monthly owner costs for units with a mortgage: $1,515 Median monthly owner costs for units without a mortgage: $483
Residents with income below the poverty level in 2022:
This zip code:
4.2%
Whole state:
14.3%
Residents with income below 50% of the poverty level in 2022:
This zip code:
2.1%
Whole state:
6.8%
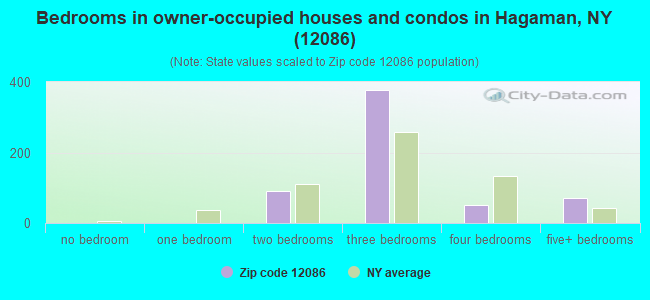
Median number of rooms in houses and condos:
Here:
6.8
State:
6.3
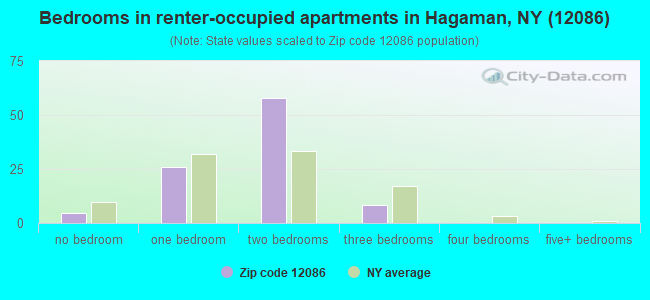
Median number of rooms in apartments:
Here:
4.0
State:
3.8
Notable locations in this zip code not listed on our city pages
In group quarters: 33 (-1 institutionalized population)
Size of family households: 218 2-persons, 58 3-persons, 77 4-persons, 43 6-persons
Size of nonfamily households: 261 1-person, 31 2-persons
72 married couples with children.
91 single-parent households (45 men, 46 women).
95.9% of residents of 12086 zip code speak English at home.
3.7% of residents speak Spanish at home (100% very well).
0.4% of residents speak other Indo-European language at home (100% very well).
0.3% of residents speak Asian or Pacific Island language at home (100% well).
Foreign born population: 19 (1.2%) (100.0% of them are naturalized citizens)
This zip code:
1.2%
Whole state:
22.7%
44%Czechoslovakia (includes Czech Republic and Slovakia)
39%United Kingdom, excluding England and Scotland
33%Sweden
11%Germany
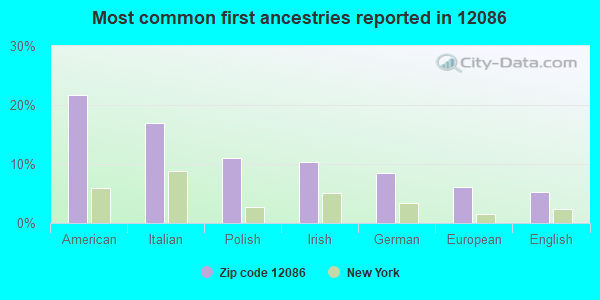
22%American
17%Italian
11%Polish
10%Irish
8%German
6%European
5%English
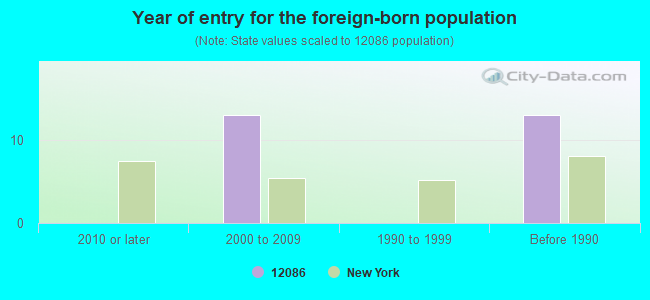
Year of entry for the foreign-born population
02010 or later
132000 to 2009
01990 to 1999
13Before 1990
Housing units lacking complete plumbing facilities: 8.1% Housing units lacking complete kitchen facilities: 6.2%
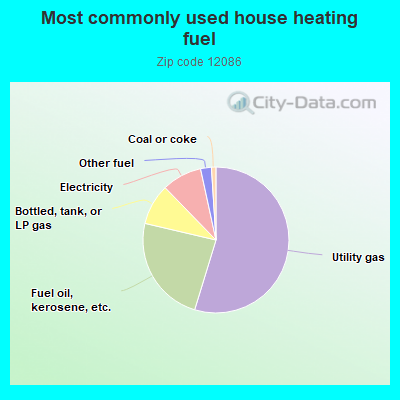
54.9%Utility gas
24.0%Fuel oil, kerosene, etc.
9.1%Bottled, tank, or LP gas
8.9%Electricity
2.4%Other fuel
1.0%Coal or coke
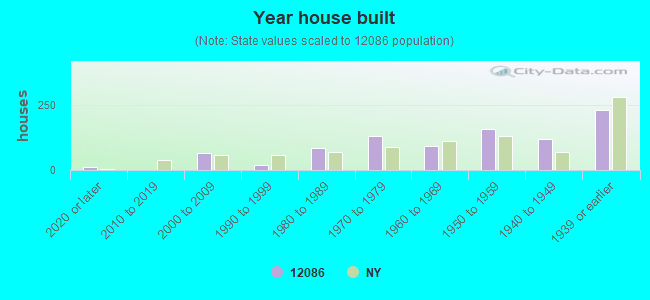
Population in 1990: 114. Population change in the 1990s: +1,440 (+1263.2%).
Place of birth for U.S.-born residents:
This state: 1,432
Northeast: 70
Midwest: 34
South: 48
West: 2
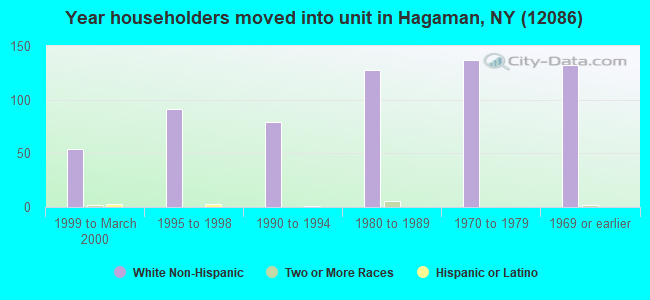
77% of the 12086 zip code residents lived in the same house 5 years ago. Out of people who lived in different houses, 47% lived in this county. Out of people who lived in different counties, 50% lived in New York.
94% of the 12086 zip code residents lived in the same house 1 year ago. Out of people who lived in different houses, 25% moved from this county. Out of people who lived in different houses, 52% moved from different county within same state. Out of people who lived in different houses, 22% moved from different state. Out of people who lived in different houses, 3% moved from abroad.
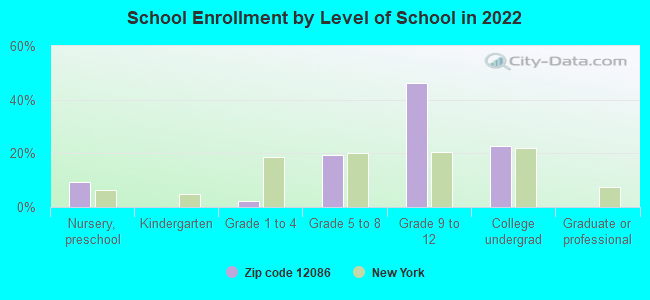
Private vs. public school enrollment:
Students in private schools in grades 1 to 8 (elementary and middle school):
Here:
0.0%
New York:
15.6%
Students in private schools in grades 9 to 12 (high school): 6
Here:
5.3%
New York:
15.0%
Students in private undergraduate colleges:
Here:
0.0%
New York:
39.2%
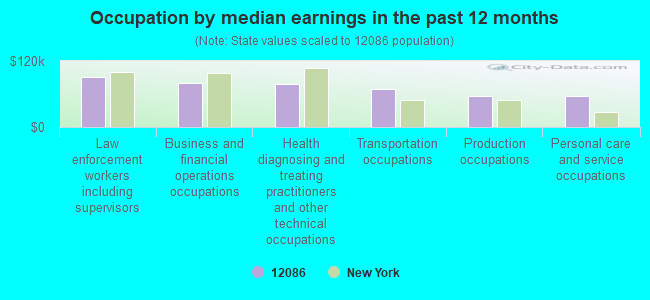
Occupation by median earnings in the past 12 months ($)
91,417Law enforcement workers including supervisors
79,258Business and financial operations occupations
77,668Health diagnosing and treating practitioners and other technical occupations
68,505Transportation occupations
56,507Production occupations
55,742Personal care and service occupations
Top industries in this zip code by the number of employees in 2005:
Professional, Scientific, and Technical Services: Other Computer Related Services (10-19 employees: 1 establishment)
Accommodation and Food Services: Full-Service Restaurants (5-9: 2)
Construction: Residential Remodelers (1-4: 2)
Other Services (except Public Administration): General Automotive Repair (1-4: 2)
Health Care and Social Assistance: Child Day Care Services (1-4: 1)
Other Services (except Public Administration): Cemeteries and Crematories (1-4: 1)
Information: Cable and Other Program Distribution (1-4: 1)
People in group quarters in 2010:
21 people in residential treatment centers for adults
People in group quarters in 2000:
14 people in other nonhousehold living situations
Home Mortgage Disclosure Act Aggregated Statistics For Year 2009 (Based on 2 partial tracts)
A) FHA, FSA/RHS & VA Home Purchase Loans
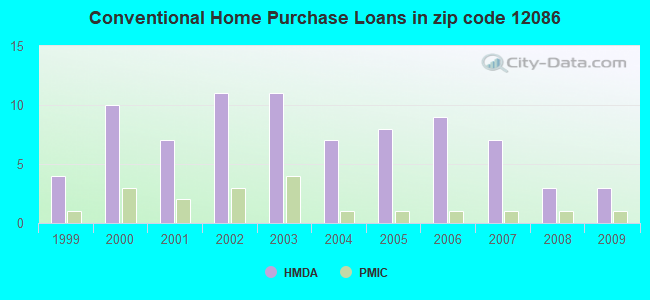
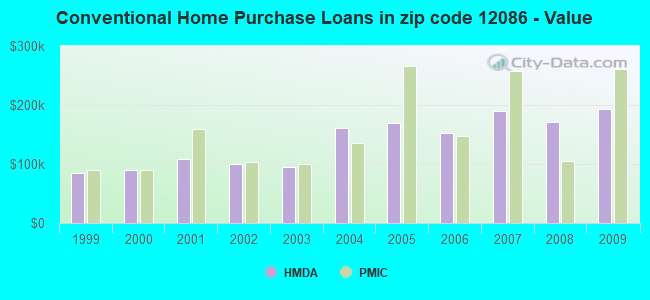
B) Conventional Home Purchase Loans
C) Refinancings
D) Home Improvement Loans
F) Non-occupant Loans on < 5 Family Dwellings (A B C & D)
Number
Average Value
Number
Average Value
Number
Average Value
Number
Average Value
Number
Average Value
LOANS ORIGINATED
2
$186,390
3
$193,563
12
$179,020
3
$45,163
1
$85,920
APPLICATIONS APPROVED, NOT ACCEPTED
0
$0
0
$0
1
$169,030
0
$0
0
$0
APPLICATIONS DENIED
0
$0
0
$0
4
$173,812
0
$0
0
$0
APPLICATIONS WITHDRAWN
0
$0
0
$0
2
$138,530
0
$0
0
$0
FILES CLOSED FOR INCOMPLETENESS
0
$0
0
$0
1
$122,430
0
$0
0
$0
Aggregated Statistics For Year 2008 (Based on 2 partial tracts)
A) FHA, FSA/RHS & VA Home Purchase Loans
B) Conventional Home Purchase Loans
C) Refinancings
D) Home Improvement Loans
F) Non-occupant Loans on < 5 Family Dwellings (A B C & D)
Number
Average Value
Number
Average Value
Number
Average Value
Number
Average Value
Number
Average Value
LOANS ORIGINATED
2
$153,225
3
$171,007
9
$151,616
3
$65,643
1
$58,020
APPLICATIONS APPROVED, NOT ACCEPTED
0
$0
1
$124,950
1
$244,710
1
$107,590
0
$0
APPLICATIONS DENIED
1
$108,180
0
$0
6
$185,105
2
$45,485
0
$0
APPLICATIONS WITHDRAWN
0
$0
0
$0
3
$125,200
0
$0
0
$0
FILES CLOSED FOR INCOMPLETENESS
0
$0
0
$0
1
$273,500
0
$0
0
$0
Aggregated Statistics For Year 2007 (Based on 2 partial tracts)
B) Conventional Home Purchase Loans
C) Refinancings
D) Home Improvement Loans
F) Non-occupant Loans on < 5 Family Dwellings (A B C & D)
G) Loans On Manufactured Home Dwelling (A B C & D)
Number
Average Value
Number
Average Value
Number
Average Value
Number
Average Value
Number
Average Value
LOANS ORIGINATED
7
$189,613
10
$144,349
5
$48,408
2
$108,260
1
$71,380
APPLICATIONS APPROVED, NOT ACCEPTED
2
$131,555
1
$232,690
1
$7,270
1
$135,490
0
$0
APPLICATIONS DENIED
3
$174,567
7
$196,694
3
$47,783
0
$0
1
$31,910
APPLICATIONS WITHDRAWN
1
$136,680
4
$174,778
1
$131,630
0
$0
0
$0
FILES CLOSED FOR INCOMPLETENESS
0
$0
1
$240,110
0
$0
0
$0
0
$0
Aggregated Statistics For Year 2006 (Based on 2 partial tracts)
A) FHA, FSA/RHS & VA Home Purchase Loans
B) Conventional Home Purchase Loans
C) Refinancings
D) Home Improvement Loans
F) Non-occupant Loans on < 5 Family Dwellings (A B C & D)
Number
Average Value
Number
Average Value
Number
Average Value
Number
Average Value
Number
Average Value
LOANS ORIGINATED
1
$185,650
9
$152,127
12
$141,957
5
$63,278
1
$148,850
APPLICATIONS APPROVED, NOT ACCEPTED
0
$0
1
$138,010
3
$117,880
0
$0
0
$0
APPLICATIONS DENIED
0
$0
2
$152,260
9
$135,011
1
$43,330
1
$63,070
APPLICATIONS WITHDRAWN
0
$0
1
$84,290
7
$135,193
1
$64,410
0
$0
FILES CLOSED FOR INCOMPLETENESS
0
$0
0
$0
1
$155,970
0
$0
0
$0
Aggregated Statistics For Year 2005 (Based on 2 partial tracts)
B) Conventional Home Purchase Loans
C) Refinancings
D) Home Improvement Loans
F) Non-occupant Loans on < 5 Family Dwellings (A B C & D)
Number
Average Value
Number
Average Value
Number
Average Value
Number
Average Value
LOANS ORIGINATED
8
$168,675
13
$126,037
5
$38,970
2
$161,385
APPLICATIONS APPROVED, NOT ACCEPTED
1
$205,980
1
$207,460
0
$0
0
$0
APPLICATIONS DENIED
1
$169,620
6
$107,095
2
$66,485
0
$0
APPLICATIONS WITHDRAWN
1
$238,180
8
$126,419
0
$0
0
$0
FILES CLOSED FOR INCOMPLETENESS
0
$0
1
$206,570
0
$0
0
$0
Aggregated Statistics For Year 2004 (Based on 2 partial tracts)
A) FHA, FSA/RHS & VA Home Purchase Loans
B) Conventional Home Purchase Loans
C) Refinancings
D) Home Improvement Loans
F) Non-occupant Loans on < 5 Family Dwellings (A B C & D)
G) Loans On Manufactured Home Dwelling (A B C & D)
Number
Average Value
Number
Average Value
Number
Average Value
Number
Average Value
Number
Average Value
Number
Average Value
LOANS ORIGINATED
1
$155,820
7
$161,480
13
$105,398
3
$25,227
2
$79,615
0
$0
APPLICATIONS APPROVED, NOT ACCEPTED
0
$0
1
$128,370
2
$97,055
0
$0
0
$0
0
$0
APPLICATIONS DENIED
0
$0
1
$72,720
6
$109,098
1
$39,470
0
$0
1
$36,950
APPLICATIONS WITHDRAWN
0
$0
0
$0
7
$97,753
1
$77,760
0
$0
0
$0
FILES CLOSED FOR INCOMPLETENESS
0
$0
0
$0
1
$122,430
0
$0
0
$0
0
$0
Aggregated Statistics For Year 2003 (Based on 4 partial tracts)
A) FHA, FSA/RHS & VA Home Purchase Loans
B) Conventional Home Purchase Loans
C) Refinancings
D) Home Improvement Loans
F) Non-occupant Loans on < 5 Family Dwellings (A B C & D)
Number
Average Value
Number
Average Value
Number
Average Value
Number
Average Value
Number
Average Value
LOANS ORIGINATED
2
$95,880
11
$95,157
38
$105,591
2
$33,245
1
$107,400
APPLICATIONS APPROVED, NOT ACCEPTED
0
$0
2
$64,260
6
$87,285
1
$48,320
1
$46,890
APPLICATIONS DENIED
0
$0
4
$51,615
13
$83,049
2
$19,510
1
$37,260
APPLICATIONS WITHDRAWN
0
$0
1
$160,610
9
$96,124
0
$0
0
$0
FILES CLOSED FOR INCOMPLETENESS
0
$0
0
$0
1
$102,960
0
$0
0
$0
Aggregated Statistics For Year 2002 (Based on 4 partial tracts)
A) FHA, FSA/RHS & VA Home Purchase Loans
B) Conventional Home Purchase Loans
C) Refinancings
D) Home Improvement Loans
F) Non-occupant Loans on < 5 Family Dwellings (A B C & D)
Number
Average Value
Number
Average Value
Number
Average Value
Number
Average Value
Number
Average Value
LOANS ORIGINATED
2
$106,065
11
$100,045
24
$89,744
3
$27,007
2
$103,515
APPLICATIONS APPROVED, NOT ACCEPTED
0
$0
1
$77,340
4
$74,122
1
$8,270
0
$0
APPLICATIONS DENIED
0
$0
3
$50,537
11
$77,215
2
$7,740
1
$40,240
APPLICATIONS WITHDRAWN
0
$0
1
$112,100
7
$80,456
1
$22,570
0
$0
FILES CLOSED FOR INCOMPLETENESS
0
$0
0
$0
1
$105,160
0
$0
0
$0
Aggregated Statistics For Year 2001 (Based on 4 partial tracts)
A) FHA, FSA/RHS & VA Home Purchase Loans
B) Conventional Home Purchase Loans
C) Refinancings
D) Home Improvement Loans
F) Non-occupant Loans on < 5 Family Dwellings (A B C & D)
Number
Average Value
Number
Average Value
Number
Average Value
Number
Average Value
Number
Average Value
LOANS ORIGINATED
3
$63,020
7
$108,386
23
$83,630
4
$15,598
2
$78,475
APPLICATIONS APPROVED, NOT ACCEPTED
0
$0
2
$55,225
2
$67,040
1
$50,340
0
$0
APPLICATIONS DENIED
0
$0
4
$53,868
13
$62,316
5
$12,794
1
$36,260
APPLICATIONS WITHDRAWN
0
$0
1
$128,240
10
$72,121
1
$39,390
0
$0
FILES CLOSED FOR INCOMPLETENESS
0
$0
0
$0
1
$93,620
0
$0
0
$0
Aggregated Statistics For Year 2000 (Based on 4 partial tracts)
A) FHA, FSA/RHS & VA Home Purchase Loans
B) Conventional Home Purchase Loans
C) Refinancings
D) Home Improvement Loans
F) Non-occupant Loans on < 5 Family Dwellings (A B C & D)
Number
Average Value
Number
Average Value
Number
Average Value
Number
Average Value
Number
Average Value
LOANS ORIGINATED
3
$76,573
10
$89,081
8
$70,048
6
$16,113
1
$88,330
APPLICATIONS APPROVED, NOT ACCEPTED
0
$0
3
$54,720
2
$54,315
2
$16,590
0
$0
APPLICATIONS DENIED
1
$77,400
8
$67,346
11
$59,703
5
$15,768
1
$84,230
APPLICATIONS WITHDRAWN
0
$0
1
$36,770
5
$46,862
1
$42,170
0
$0
FILES CLOSED FOR INCOMPLETENESS
0
$0
0
$0
1
$93,790
0
$0
0
$0
Aggregated Statistics For Year 1999 (Based on 2 partial tracts)


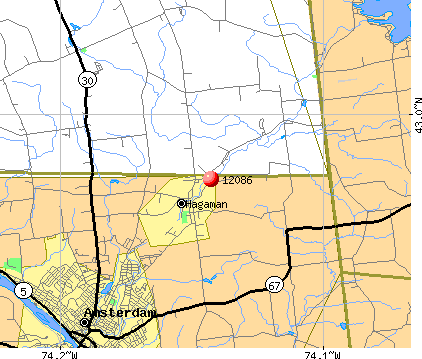 Nearest zip codes: 12074, 12025, 12010, 12150, 12850, 12137.