Estimated zip code population in 2022: 10,611 Zip code population in 2010: 11,183 Zip code population in 2000: 11,612
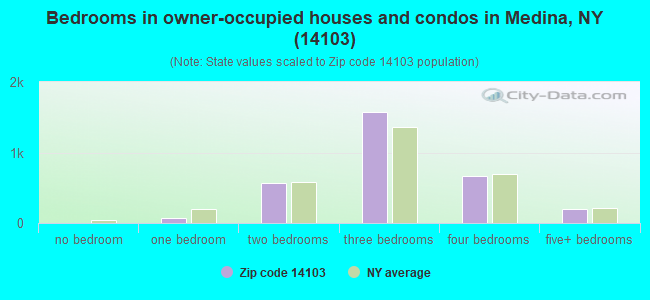
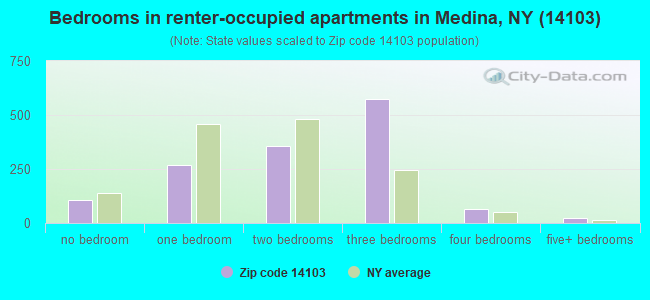
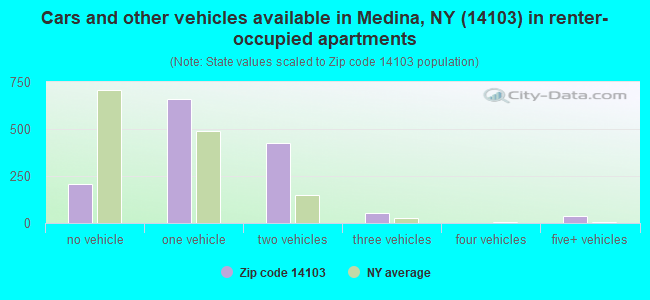
Houses and condos: 4,707 Renter-occupied apartments: 1,389
% of renters here:
31%
State:
46%
March 2022 cost of living index in zip code 14103: 101.1 (near average, U.S. average is 100)
Land area: 79.9 sq. mi. Water area: 0.5 sq. mi.
Population density: 133 people per square mile
(very low).
OSM Map
General Map
Google Map
MSN Map
OSM Map
General Map
Google Map
MSN Map
OSM Map
General Map
Google Map
MSN Map
OSM Map
General Map
Google Map
MSN Map
Please wait while loading the map...
Real estate property taxes paid for housing units in 2022:
This zip code:
3.0% ($3,725)
New York:
1.5% ($6,180)
Median real estate property taxes paid for housing units with mortgages in 2022: $4,075 (2.5%) Median real estate property taxes paid for housing units with no mortgage in 2022: $3,364 (3.2%)
Business Search- 14 Million verified businesses
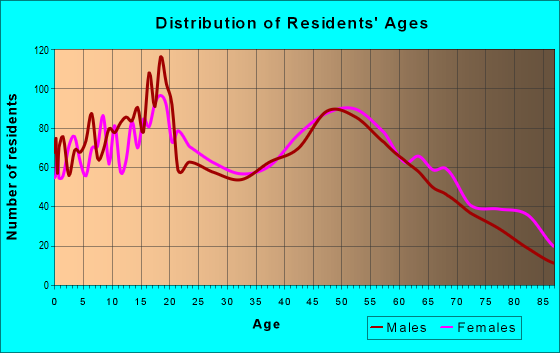
Males: 5,529
(52.1%)
Females: 5,082
(47.9%)
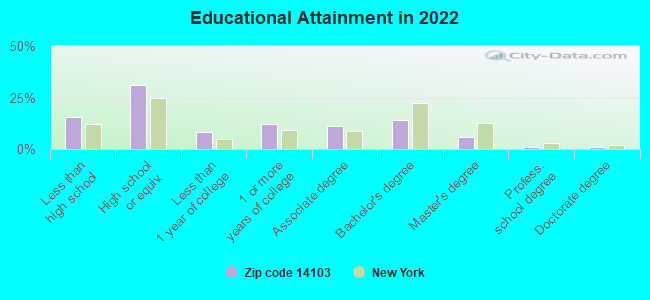
For population 25 years and over in 14103:
High school or higher: 83.4%
Bachelor's degree or higher: 21.7%
Graduate or professional degree: 7.8%
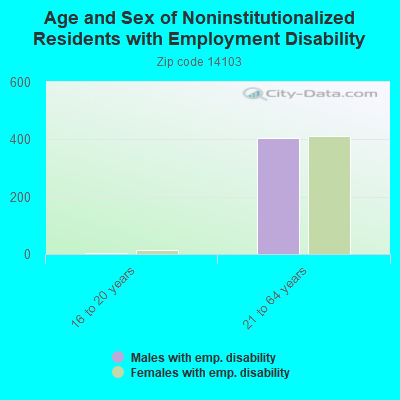
Unemployed: 4.4%
Mean travel time to work (commute): 25.3 minutes
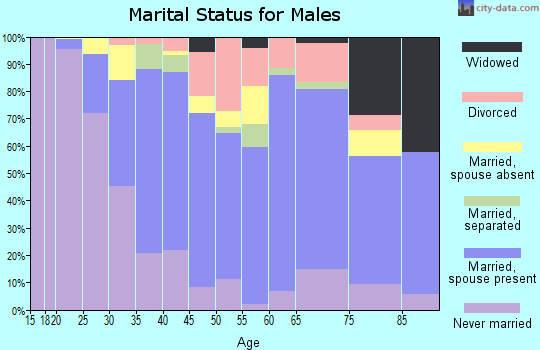
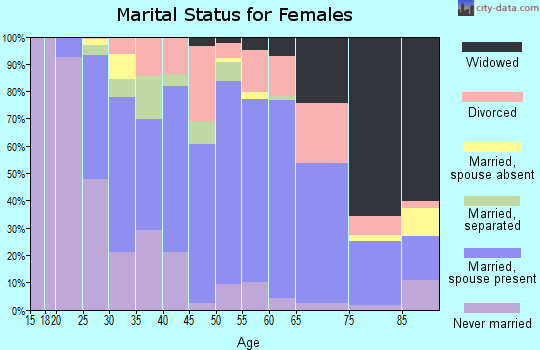
For population 15 years and over in 14103:
Never married: 33.4%
Now married: 50.0%
Separated: 1.0%
Widowed: 5.4%
Divorced: 10.2%
Zip code 14103 compared to state average:
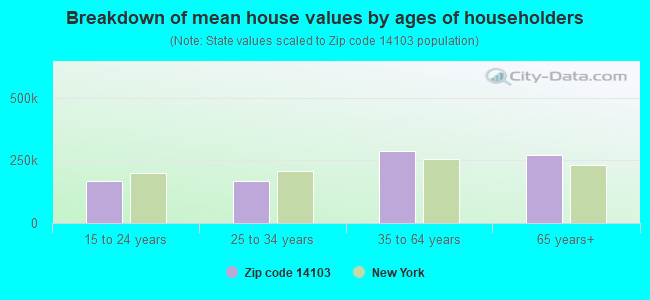
Median house value significantly below state average.
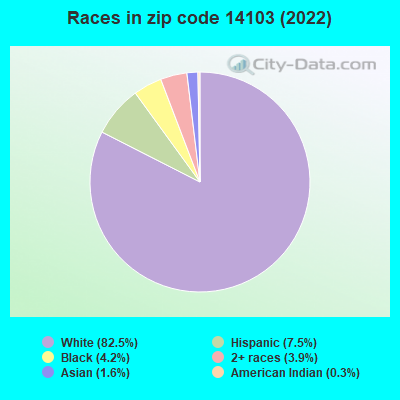
Black race population percentage significantly below state average.
Hispanic race population percentage below state average.
Foreign-born population percentage significantly below state average.
Length of stay since moving in significantly above state average.
Number of rooms per house above state average.
Number of college students below state average.
Percentage of population with a bachelor's degree or higher below state average.
Averages for the 2020 tax year for zip code 14103, filed in 2021:
Average Adjusted Gross Income (AGI) in 2020: $50,483 (Individual Income Tax Returns)
Here:
$50,483
State:
$90,930
Salary/wage: $41,791 (reported on 80.9% of returns)
Here:
$41,791
State:
$72,104
(% of AGI for various income ranges: 1031.4% for AGIs below $25k, 3377.1% for AGIs $25k-50k, 6099.5% for AGIs $50k-75k, 9174.0% for AGIs $75k-100k, 14453.7% for AGIs $100k-200k)
Taxable interest for individuals: $984 (reported on 34.4% of returns)
This zip code:
$984
New York:
$3,075
(% of AGI for various income ranges: 12.6% for AGIs below $25k, 18.1% for AGIs $25k-50k, 26.9% for AGIs $50k-75k, 72.3% for AGIs $75k-100k, 120.7% for AGIs $100k-200k)
Ordinary dividends: $2,929 (reported on 15.1% of returns)
Here:
$2,929
State:
$11,095
(% of AGI for various income ranges: 15.8% for AGIs below $25k, 26.5% for AGIs $25k-50k, 36.0% for AGIs $50k-75k, 55.7% for AGIs $75k-100k, 123.3% for AGIs $100k-200k)
Net capital gain/loss in AGI: +$10,680 (reported on 10.7% of returns)
Here:
+$10,680
State:
+$44,925
(% of AGI for various income ranges: 6.2% for AGIs below $25k, 24.0% for AGIs $25k-50k, 73.2% for AGIs $50k-75k, 107.3% for AGIs $75k-100k, 268.0% for AGIs $100k-200k)
Profit/loss from business: +$11,359 (reported on 10.7% of returns)
Here:
+$11,359
State:
+$14,940
(% of AGI for various income ranges: 74.5% for AGIs below $25k, 52.4% for AGIs $25k-50k, 99.8% for AGIs $50k-75k, 102.0% for AGIs $75k-100k, 1209.3% for AGIs $100k-200k)
Taxable individual retirement arrangement distribution: $13,230 (reported on 9.3% of returns)
14103:
$13,230
New York:
$19,609
(% of AGI for various income ranges: 62.0% for AGIs below $25k, 71.4% for AGIs $25k-50k, 180.2% for AGIs $50k-75k, 296.7% for AGIs $75k-100k, 850.3% for AGIs $100k-200k)
Total itemized deductions: $24,608 (reported on 2.6% of returns)
Here:
$24,608
State:
$39,326
(% of AGI for various income ranges: 48.8% for AGIs $25k-50k, 120.5% for AGIs $50k-75k, 615.7% for AGIs $100k-200k)
Charity contributions: $8,775 (reported on 1.6% of returns)
Here:
$8,775
State:
$15,420
(% of AGI for various income ranges: 5.2% for AGIs below $25k, 13.1% for AGIs $50k-75k, 185.3% for AGIs $100k-200k)
Taxes paid: $7,833 (reported on 2.4% of returns)
14103:
$7,833
State:
$9,183
(% of AGI for various income ranges: 14.2% for AGIs $25k-50k, 45.8% for AGIs $50k-75k, 160.0% for AGIs $100k-200k)
Earned income credit: $2,176 (reported on 17.3% of returns)
Here:
$2,176
State:
$2,138
(% of AGI for various income ranges: 85.0% for AGIs below $25k, 66.9% for AGIs $25k-50k)
Percentage of individuals using paid preparers for their 2020 taxes: 96.8%
Here:
97%
State:
95%
(% for various income ranges: 96.4% for AGIs below $25k, 97.4% for AGIs $25k-50k, 97.6% for AGIs $50k-75k, 95.5% for AGIs $75k-100k, 95.8% for AGIs $100k-200k, 100.0% for AGIs over 200k)
Averages for the 2012 tax year for zip code 14103, filed in 2013:
Average Adjusted Gross Income (AGI) in 2012: $42,126 (Individual Income Tax Returns)
Here:
$42,126
State:
$77,088
Salary/wage: $35,738 (reported on 84.6% of returns)
Here:
$35,738
State:
$60,593
(% of AGI for various income ranges: 71.2% for AGIs below $25k, 79.7% for AGIs $25k-50k, 73.6% for AGIs $50k-75k, 76.6% for AGIs $75k-100k, 70.6% for AGIs $100k-200k, 28.9% for AGIs over 200k)
Taxable interest for individuals: $828 (reported on 42.5% of returns)
This zip code:
$828
New York:
$3,125
(% of AGI for various income ranges: 1.1% for AGIs below $25k, 0.5% for AGIs $25k-50k, 0.4% for AGIs $50k-75k, 0.5% for AGIs $75k-100k, 1.1% for AGIs $100k-200k, 2.4% for AGIs over 200k)
Ordinary dividends: $2,229 (reported on 17.8% of returns)
Here:
$2,229
State:
$10,299
(% of AGI for various income ranges: 1.1% for AGIs below $25k, 0.5% for AGIs $25k-50k, 0.6% for AGIs $50k-75k, 0.8% for AGIs $75k-100k, 1.1% for AGIs $100k-200k, 3.3% for AGIs over 200k)
Net capital gain/loss in AGI: +$6,635 (reported on 10.2% of returns)
Here:
+$6,635
State:
+$42,474
(% of AGI for various income ranges: 0.3% for AGIs below $25k, 0.4% for AGIs $25k-50k, 0.6% for AGIs $50k-75k, 1.0% for AGIs $75k-100k, 0.9% for AGIs $100k-200k, 15.2% for AGIs over 200k)
Profit/loss from business: +$9,351 (reported on 10.2% of returns)
Here:
+$9,351
State:
+$16,168
(% of AGI for various income ranges: 3.4% for AGIs below $25k, 1.6% for AGIs $25k-50k, 1.1% for AGIs $50k-75k, 1.1% for AGIs $75k-100k, 5.1% for AGIs $100k-200k)
Taxable individual retirement arrangement distribution: $10,410 (reported on 10.2% of returns)
14103:
$10,410
New York:
$17,621
(% of AGI for various income ranges: 3.1% for AGIs below $25k, 2.0% for AGIs $25k-50k, 3.0% for AGIs $50k-75k, 2.3% for AGIs $75k-100k, 3.2% for AGIs $100k-200k)
Total itemized deductions: $17,694 (21% of AGI, reported on 20.6% of returns)
Here:
$17,694
State:
$34,985
Here:
21.1% of AGI
State:
21.3% of AGI
(% of AGI for various income ranges: 4.3% for AGIs below $25k, 6.3% for AGIs $25k-50k, 8.3% for AGIs $50k-75k, 10.2% for AGIs $75k-100k, 12.2% for AGIs $100k-200k, 12.0% for AGIs over 200k)
Charity contributions: $3,019 (reported on 15.4% of returns)
Here:
$3,019
State:
$5,572
(% of AGI for various income ranges: 0.3% for AGIs below $25k, 0.5% for AGIs $25k-50k, 1.2% for AGIs $50k-75k, 1.2% for AGIs $75k-100k, 1.7% for AGIs $100k-200k, 2.5% for AGIs over 200k)
Taxes paid: $8,598 (reported on 20.6% of returns)
14103:
$8,598
State:
$18,656
(% of AGI for various income ranges: 1.4% for AGIs below $25k, 2.3% for AGIs $25k-50k, 3.5% for AGIs $50k-75k, 5.1% for AGIs $75k-100k, 7.1% for AGIs $100k-200k, 7.1% for AGIs over 200k)
Earned income credit: $2,182 (reported on 20.4% of returns)
Here:
$2,182
State:
$2,230
(% of AGI for various income ranges: 5.9% for AGIs below $25k, 1.3% for AGIs $25k-50k)
Percentage of individuals using paid preparers for their 2012 taxes: 57.5%
Here:
58%
State:
66%
(% for various income ranges: 50.5% for AGIs below $25k, 59.4% for AGIs $25k-50k, 65.7% for AGIs $50k-75k, 64.3% for AGIs $75k-100k, 67.6% for AGIs $100k-200k, 75.0% for AGIs over 200k)
Averages for the 2004 tax year for zip code 14103, filed in 2005:
Average Adjusted Gross Income (AGI) in 2004: $34,639 (Individual Income Tax Returns)
Here:
$34,639
State:
$59,519
Salary/wage: $30,767 (reported on 86.0% of returns)
Here:
$30,767
State:
$50,673
(% of AGI for various income ranges: 91.7% for AGIs below $10k, 74.4% for AGIs $10k-25k, 78.2% for AGIs $25k-50k, 80.1% for AGIs $50k-75k, 82.3% for AGIs $75k-100k, 62.7% for AGIs over 100k)
Taxable interest for individuals: $1,000 (reported on 51.8% of returns)
This zip code:
$1,000
New York:
$2,377
(% of AGI for various income ranges: 5.0% for AGIs below $10k, 2.0% for AGIs $10k-25k, 1.2% for AGIs $25k-50k, 0.9% for AGIs $50k-75k, 1.5% for AGIs $75k-100k, 1.9% for AGIs over 100k)
Taxable dividends: $1,666 (reported on 24.0% of returns)
Here:
$1,666
State:
$5,394
(% of AGI for various income ranges: 1.6% for AGIs below $10k, 1.2% for AGIs $10k-25k, 0.9% for AGIs $25k-50k, 0.6% for AGIs $50k-75k, 0.9% for AGIs $75k-100k, 2.5% for AGIs over 100k)
Net capital gain/loss: +$5,080 (reported on 15.1% of returns)
Here:
+$5,080
State:
+$23,581
(% of AGI for various income ranges: 0.7% for AGIs below $10k, 0.8% for AGIs $10k-25k, 0.9% for AGIs $25k-50k, 1.2% for AGIs $50k-75k, 1.1% for AGIs $75k-100k, 8.0% for AGIs over 100k)
Profit/loss from business: +$10,460 (reported on 11.0% of returns)
Here:
+$10,460
State:
+$13,809
(% of AGI for various income ranges: 1.8% for AGIs below $10k, 2.8% for AGIs $10k-25k, 1.9% for AGIs $25k-50k, 2.0% for AGIs $50k-75k, 1.5% for AGIs $75k-100k, 9.7% for AGIs over 100k)
IRA payment deduction: $2,579 (reported on 2.2% of returns)
14103:
$2,579
New York:
$3,115
(% of AGI for various income ranges: 0.1% for AGIs $10k-25k, 0.3% for AGIs $25k-50k, 0.2% for AGIs $50k-75k, 0.2% for AGIs $75k-100k)
Self-employed pension: $13,042 (reported on 0.5% of returns)
Here:
$13,042
New York:
$19,016
Total itemized deductions: $15,134 (21% of AGI, reported on 22.5% of returns)
Here:
$15,134
State:
$25,864
Here:
21.4% of AGI
State:
21.9% of AGI
(% of AGI for various income ranges: 6.9% for AGIs below $10k, 4.7% for AGIs $10k-25k, 7.1% for AGIs $25k-50k, 10.2% for AGIs $50k-75k, 13.2% for AGIs $75k-100k, 15.1% for AGIs over 100k)
Charity contributions deductions: $2,221 (3% of AGI, reported on 19.5% of returns)
Here:
$2,221
State:
$4,439
Here:
3.0% of AGI
State:
3.6% of AGI
(% of AGI for various income ranges: 0.2% for AGIs below $10k, 0.4% for AGIs $10k-25k, 0.9% for AGIs $25k-50k, 1.1% for AGIs $50k-75k, 1.9% for AGIs $75k-100k, 2.2% for AGIs over 100k)
Total tax: $4,306 (reported on 70.8% of returns)
14103:
$4,306
State:
$11,730
(% of AGI for various income ranges: 2.2% for AGIs below $10k, 3.7% for AGIs $10k-25k, 6.4% for AGIs $25k-50k, 8.7% for AGIs $50k-75k, 10.3% for AGIs $75k-100k, 16.5% for AGIs over 100k)
Earned income credit: $1,697 (reported on 18.7% of returns)
Here:
$1,697
State:
$1,757
Percentage of individuals using paid preparers for their 2004 taxes: 64.5%
Here:
65%
State:
67%
(% for various income ranges: 54.5% for AGIs below $10k, 63.7% for AGIs $10k-25k, 68.7% for AGIs $25k-50k, 70.9% for AGIs $50k-75k, 66.9% for AGIs $75k-100k, 73.4% for AGIs over 100k)
Likely homosexual households (counted as self-reported same-sex unmarried-partner households)
Lesbian couples: 0.1% of all households
Gay men: 0.0% of all households
Household received Food Stamps/SNAP in the past 12 months: 805 Household did not receive Food Stamps/SNAP in the past 12 months: 3,690
Women who had a birth in the past 12 months: 35 (35 now married, 0 unmarried) Women who did not have a birth in the past 12 months: 2,095 (811 now married, 1,281 unmarried)
Housing units in zip code 14103 with a mortgage: 1,587 (257 second mortgage, 250 both second mortgage and home equity loan) Houses without a mortgage: 84
Median monthly owner costs for units with a mortgage: $1,338 Median monthly owner costs for units without a mortgage: $654
Residents with income below the poverty level in 2022:
This zip code:
13.3%
Whole state:
14.3%
Residents with income below 50% of the poverty level in 2022:
This zip code:
4.3%
Whole state:
6.8%
Median number of rooms in houses and condos:
Here:
6.8
State:
6.3
Median number of rooms in apartments:
Here:
4.7
State:
3.8
Notable locations in this zip code not listed on our city pages
Notable locations in zip code 14103: Shelridge Country Club (A), Flyway Farm (B), Kniland Dairy Farms (C), Sentiff Farms (D), George Farms (E), Petrie Farms (F), Toussaint Farms (G), Pettit Farms (H), Ledge Rock Farms (I), Roberts Farms (J), Elpay Farms (K), K C Farms (L), Giltner Farms (M), Meadowbrook Farms (N), Boyce Farms (O), Hird Farm (P), Medina Business Park (Q), Medina Waste Water Treatment Plant (R), Al-Lin Fruit Farm (S), Bashford's Farm (T). Display/hide their locations on the map
Churches in zip code 14103 include: Saint Peter's Evangelical Lutheran Church (A), Trinity Evangelical Lutheran Church (B), Sacred Heart Roman Catholic Church (C), First Methodist Church (D), First Baptist Church (E), Saint Mary's Roman Catholic Church (F), Saint John's Episcopal Church (G), First Presbyterian Church (H), Bethel Baptist Church (I). Display/hide their locations on the map
Cemeteries: Shelby Center Cemetery (1), Fletcher Chapel Cemetery (2), Maple Ridge Cemetery (3), Hageman Farm Cemetery (4), Sacred Heart Cemetery (5), Saint Marys Cemetery (6), Boxwood Cemetery (7). Display/hide their locations on the map
Parks in zip code 14103 include: Oak Orchard Park (1), Veterans Memorial Baseball Park (2), South Main Street Park (3). Display/hide their locations on the map
1,391 married couples with children.
513 single-parent households (180 men, 333 women).
88.3% of residents of 14103 zip code speak English at home.
6.5% of residents speak Spanish at home (52% very well, 6% well, 34% not well, 7% not at all).
3.4% of residents speak other Indo-European language at home (76% very well, 21% well, 3% not well).
1.4% of residents speak Asian or Pacific Island language at home (25% very well, 68% well, 7% not well).
0.1% of residents speak other language at home (57% very well, 43% well).
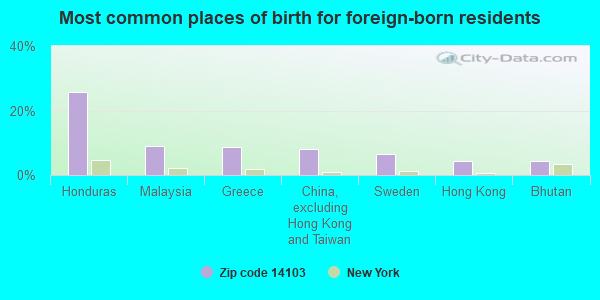
Foreign born population: 416 (3.9%) (51.9% of them are naturalized citizens)
This zip code:
3.9%
Whole state:
22.7%
26%Honduras
9%Malaysia
9%Greece
8%China, excluding Hong Kong and Taiwan
6%Sweden
4%Hong Kong
4%Bhutan
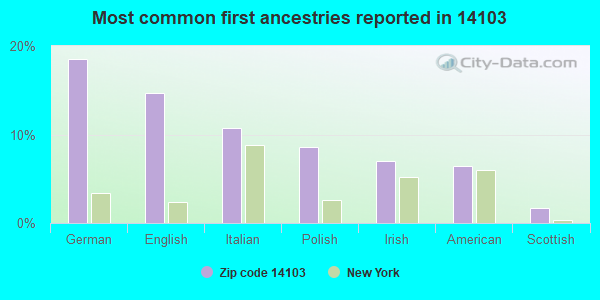
19%German
15%English
11%Italian
9%Polish
7%Irish
6%American
2%Scottish
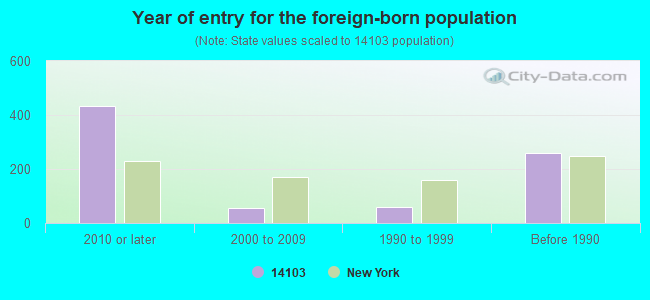
Year of entry for the foreign-born population
4342010 or later
572000 to 2009
591990 to 1999
260Before 1990
Facilities with environmental interests located in this zip code:
BERNZOMATIC (1 BERNZOMATIC DR. in MEDINA, NY)
STATE MASTER (New Jersey environmental info) - NJEMS-003692, PESTICIDES - MANUFACTURE Small Quantity Generators, between 100 kg and 1000 kg of hazardous waste/month (Resource Conservation and Recovery Act (tracking hazardous waste)) - notification TRI REPORTER (Tracking of toxic chemicals releasing facilities) Business SIC classification: HEATING EQUIPMENT, EXCEPT ELECTRIC AND WARM AIR FURNACES Organizations: NEWELL COS (CONTACT/OWNER)
Alternative names: BERNZOMATIC DIV NEWELL COS, NEWELL CO BERNZOMATIC DIVISION
CLIFFORD WISE MS ( in MEDINA, NY)
(National Center for Education Statistics) - STATE ID-450801060003 Organizations: MEDINA CSD (SCHOOL DISTRICT)
CORROSIGN CONTROL SYSTEMS DIV (10478 RIDGE RD in MEDINA, NY)
Large Quantity Generators, more that 1000 kg of hazardous waste/month (Resource Conservation and Recovery Act (tracking hazardous waste)) Organizations: CORROSION CONTROL DIVISION (CONTACT/OPERATOR)
, COUNTY OF ORLEANS INDUSTRIAL DEVELOPMENT (CONTACT/OWNER)
AGWAY PETROLEUM (11827 MILLION DOLLAR HWY in MEDINA, NY)
(Resource Conservation and Recovery Act (tracking hazardous waste))
HAHN HARDWARE CO INC (205 STARR ST in MEDINA, NY)
(Resource Conservation and Recovery Act (tracking hazardous waste))
HARTWAY MOTORS INC (320 N MAIN ST in MEDINA, NY)
(Resource Conservation and Recovery Act (tracking hazardous waste))
CLIFFORD WISE MIDDLE SCHOOL (1016 GWINN ST in MEDINA, NY)
COMPLIANCE ACTIVITY (Tracking inspections of insecticide, fungicide, and rodenticide, and toxic substances) Conditionally Exempt Small Quantity Generators, less than 100 kg/month of hazardous waste (Resource Conservation and Recovery Act (tracking hazardous waste)) - notification Organizations: MEDINA CENTRAL SCHOOL DIST (CONTACT/OWNER)
Alternative names: MEDINA CENTRAL SCHOOL DISTRICT
ASSOCIATED BRANDS INCORPORATED (4001 SALT WORKS ROAD in MEDINA, NY)
Conditionally Exempt Small Quantity Generators, less than 100 kg/month of hazardous waste (Resource Conservation and Recovery Act (tracking hazardous waste)) - notification Alternative names: ONTARIO FOODS INC
Housing units lacking complete plumbing facilities: 0.5% Housing units lacking complete kitchen facilities: 1.9%
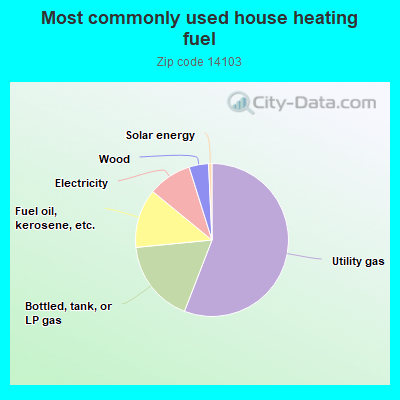
55.6%Utility gas
17.5%Bottled, tank, or LP gas
12.4%Fuel oil, kerosene, etc.
9.2%Electricity
4.1%Wood
0.7%Solar energy
Population in 1990: 12,042.
Place of birth for U.S.-born residents:
This state: 8,888
Northeast: 278
Midwest: 224
South: 259
West: 164
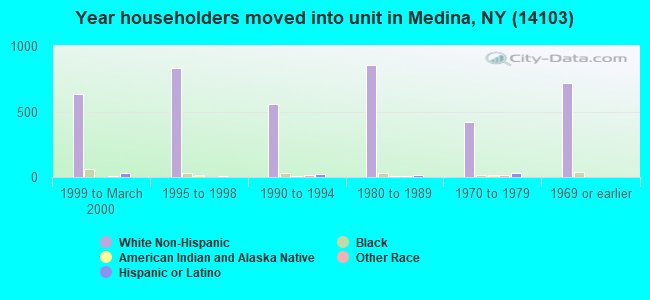
63% of the 14103 zip code residents lived in the same house 5 years ago. Out of people who lived in different houses, 68% lived in this county. Out of people who lived in different counties, 50% lived in New York.
91% of the 14103 zip code residents lived in the same house 1 year ago. Out of people who lived in different houses, 47% moved from this county. Out of people who lived in different houses, 48% moved from different county within same state. Out of people who lived in different houses, 3% moved from different state. Out of people who lived in different houses, 1% moved from abroad.
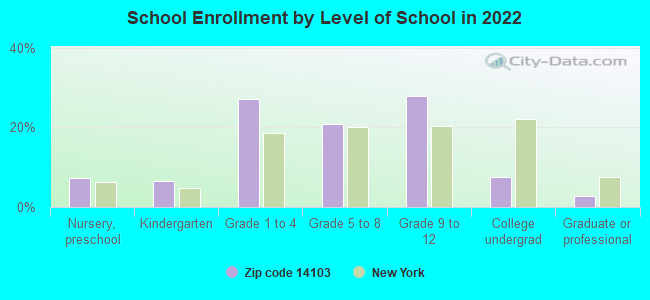
Private vs. public school enrollment:
Students in private schools in grades 1 to 8 (elementary and middle school): 180
Here:
18.7%
New York:
15.6%
Students in private schools in grades 9 to 12 (high school): 89
Here:
16.2%
New York:
15.0%
Students in private undergraduate colleges: 35
Here:
23.8%
New York:
39.2%
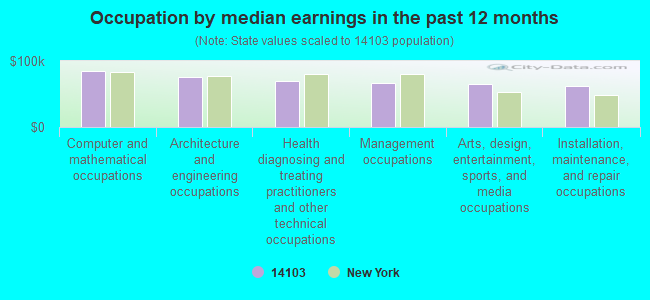
Occupation by median earnings in the past 12 months ($)
85,254Computer and mathematical occupations
75,003Architecture and engineering occupations
69,721Health diagnosing and treating practitioners and other technical occupations
66,863Management occupations
64,765Arts, design, entertainment, sports, and media occupations
61,976Installation, maintenance, and repair occupations
Companies with federal contracts located in this zip code:
TREK INC (11601 MAPLE RIDGE ROAD in MEDINA, NY; small business) : $134,456 in 13 contractsfrom 2000 to 2005
Contracts for Miscellaneous Communication Equipment, Electrical and Electronic Properties Measuring and Testing Instruments, , Amplifiers, and moreby NASA, Air Force, Navy, National Institute of Standards and Technology, and others Signed by year:2000: $49,000; 2001: $0; 2002: $0; 2003: $0; 2004: $40,396; 2005: $45,060; 2006: $0.
Biggest contracts:
$49,000 with NASA for Miscellaneous Communication Equipment. Signed on 2000-06-15. Completion date: 2000-08-15.
$15,980 with Air Force for Electrical and Electronic Properties Measuring and Testing Instruments. Signed on 2005-09-22. Completion date: 2005-10-27.
$14,602 with NASA for . Signed on 2004-06-04. Completion date: 2004-07-09.
$13,933 with Navy for Amplifiers. Signed on 2005-08-08. Completion date: 2005-09-08.
Top industries in this zip code by the number of employees in 2005:
Health Care and Social Assistance: General Medical and Surgical Hospitals (250-499 employees: 1 establishment)
Health Care and Social Assistance: Nursing Care Facilities (100-249: 1, 10-19: 2)
Administrative and Support and Waste Management and Remediation Services: Temporary Help Services (100-249: 1)
Educational Services: Exam Preparation and Tutoring (100-249: 1)
People in group quarters in 2010:
265 people in workers' group living quarters and job corps centers
160 people in nursing facilities/skilled-nursing facilities
18 people in group homes intended for adults
2 people in mental (psychiatric) hospitals and psychiatric units in other hospitals
People in group quarters in 2000:
200 people in nursing homes
193 people in job corps and vocational training facilities
19 people in other group homes
Fatal accident statistics in 2014:
Fatal accident count: 2
Vehicles involved in fatal accidents: 2
Fatal accidents caused by drunken drivers: 0
Fatalities: 2
Persons involved in fatal accidents: 2
Pedestrians involved in fatal accidents: 0
Fatal accident statistics in 2013:
Fatal accident count: 1
Vehicles involved in fatal accidents: 1
Fatal accidents caused by drunken drivers: 0
Fatalities: 1
Persons involved in fatal accidents: 2
Pedestrians involved in fatal accidents: 0
Home Mortgage Disclosure Act Aggregated Statistics For Year 2009 (Based on 2 full and 4 partial tracts)
A) FHA, FSA/RHS & VA Home Purchase Loans
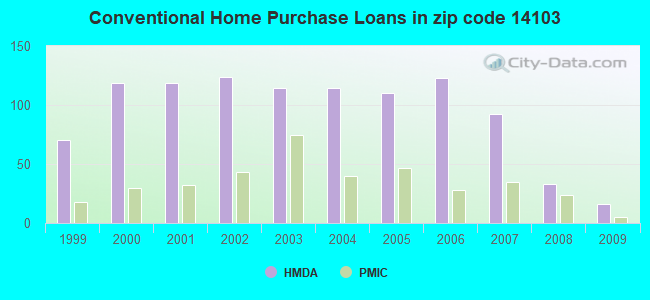
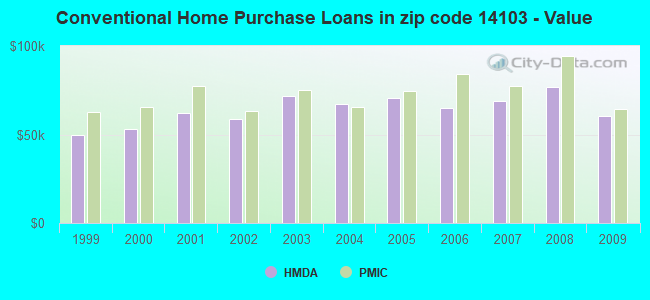
B) Conventional Home Purchase Loans
C) Refinancings
D) Home Improvement Loans
F) Non-occupant Loans on < 5 Family Dwellings (A B C & D)
G) Loans On Manufactured Home Dwelling (A B C & D)
Number
Average Value
Number
Average Value
Number
Average Value
Number
Average Value
Number
Average Value
Number
Average Value
LOANS ORIGINATED
47
$91,297
16
$60,256
65
$86,897
14
$38,269
3
$37,000
3
$85,340
APPLICATIONS APPROVED, NOT ACCEPTED
0
$0
2
$90,360
8
$67,896
0
$0
0
$0
0
$0
APPLICATIONS DENIED
7
$73,821
6
$49,927
57
$79,790
26
$43,051
4
$35,250
1
$19,000
APPLICATIONS WITHDRAWN
0
$0
0
$0
31
$79,205
0
$0
1
$47,000
0
$0
FILES CLOSED FOR INCOMPLETENESS
0
$0
0
$0
4
$76,858
1
$10,000
0
$0
0
$0
Aggregated Statistics For Year 2008 (Based on 2 full and 4 partial tracts)
A) FHA, FSA/RHS & VA Home Purchase Loans
B) Conventional Home Purchase Loans
C) Refinancings
D) Home Improvement Loans
E) Loans on Dwellings For 5+ Families
F) Non-occupant Loans on < 5 Family Dwellings (A B C & D)
G) Loans On Manufactured Home Dwelling (A B C & D)
Number
Average Value
Number
Average Value
Number
Average Value
Number
Average Value
Number
Average Value
Number
Average Value
Number
Average Value
LOANS ORIGINATED
59
$88,928
33
$77,073
51
$68,967
15
$16,916
1
$65,000
6
$34,667
5
$64,730
APPLICATIONS APPROVED, NOT ACCEPTED
6
$106,115
5
$42,760
20
$54,695
4
$8,515
0
$0
0
$0
1
$27,000
APPLICATIONS DENIED
5
$98,330
18
$71,279
119
$82,085
36
$29,945
0
$0
7
$49,499
7
$86,489
APPLICATIONS WITHDRAWN
4
$68,612
5
$63,062
42
$93,991
3
$20,223
0
$0
3
$80,907
0
$0
FILES CLOSED FOR INCOMPLETENESS
2
$65,510
3
$140,057
6
$74,472
2
$67,770
0
$0
2
$49,000
0
$0
Aggregated Statistics For Year 2007 (Based on 2 full and 4 partial tracts)
A) FHA, FSA/RHS & VA Home Purchase Loans
B) Conventional Home Purchase Loans
C) Refinancings
D) Home Improvement Loans
F) Non-occupant Loans on < 5 Family Dwellings (A B C & D)
G) Loans On Manufactured Home Dwelling (A B C & D)
Number
Average Value
Number
Average Value
Number
Average Value
Number
Average Value
Number
Average Value
Number
Average Value
LOANS ORIGINATED
41
$66,862
92
$68,937
98
$75,225
54
$29,353
6
$79,298
6
$50,452
APPLICATIONS APPROVED, NOT ACCEPTED
2
$42,920
10
$60,964
28
$99,712
18
$12,330
3
$87,850
4
$50,972
APPLICATIONS DENIED
5
$50,034
39
$56,463
165
$71,485
96
$32,629
9
$57,000
13
$43,256
APPLICATIONS WITHDRAWN
3
$64,343
9
$61,238
71
$77,601
21
$33,538
5
$41,468
0
$0
FILES CLOSED FOR INCOMPLETENESS
2
$48,945
3
$36,727
20
$110,854
0
$0
0
$0
2
$106,175
Aggregated Statistics For Year 2006 (Based on 2 full and 4 partial tracts)
A) FHA, FSA/RHS & VA Home Purchase Loans
B) Conventional Home Purchase Loans
C) Refinancings
D) Home Improvement Loans
F) Non-occupant Loans on < 5 Family Dwellings (A B C & D)
G) Loans On Manufactured Home Dwelling (A B C & D)
Number
Average Value
Number
Average Value
Number
Average Value
Number
Average Value
Number
Average Value
Number
Average Value
LOANS ORIGINATED
44
$73,848
123
$65,237
100
$67,706
74
$25,661
16
$38,122
14
$60,921
APPLICATIONS APPROVED, NOT ACCEPTED
3
$38,557
7
$89,181
27
$68,696
8
$23,181
3
$30,730
2
$21,835
APPLICATIONS DENIED
5
$58,660
27
$56,532
195
$79,666
92
$40,016
15
$91,213
21
$49,006
APPLICATIONS WITHDRAWN
3
$104,957
11
$67,015
111
$77,784
20
$56,731
7
$63,000
3
$120,033
FILES CLOSED FOR INCOMPLETENESS
0
$0
5
$65,866
25
$84,441
2
$15,000
0
$0
1
$85,000
Aggregated Statistics For Year 2005 (Based on 2 full and 4 partial tracts)
A) FHA, FSA/RHS & VA Home Purchase Loans
B) Conventional Home Purchase Loans
C) Refinancings
D) Home Improvement Loans
E) Loans on Dwellings For 5+ Families
F) Non-occupant Loans on < 5 Family Dwellings (A B C & D)
G) Loans On Manufactured Home Dwelling (A B C & D)
Number
Average Value
Number
Average Value
Number
Average Value
Number
Average Value
Number
Average Value
Number
Average Value
Number
Average Value
LOANS ORIGINATED
33
$63,664
110
$70,339
124
$63,279
61
$25,405
1
$94,000
17
$50,049
13
$50,692
APPLICATIONS APPROVED, NOT ACCEPTED
6
$58,302
21
$64,824
28
$66,653
12
$19,009
0
$0
2
$52,500
4
$52,148
APPLICATIONS DENIED
1
$51,000
27
$46,525
297
$72,774
72
$28,282
0
$0
15
$36,831
19
$42,589
APPLICATIONS WITHDRAWN
5
$68,480
14
$50,003
133
$75,439
12
$28,743
0
$0
9
$58,700
5
$26,396
FILES CLOSED FOR INCOMPLETENESS
2
$78,000
2
$86,500
44
$97,121
0
$0
0
$0
1
$84,000
0
$0
Aggregated Statistics For Year 2004 (Based on 2 full and 4 partial tracts)
A) FHA, FSA/RHS & VA Home Purchase Loans
B) Conventional Home Purchase Loans
C) Refinancings
D) Home Improvement Loans
E) Loans on Dwellings For 5+ Families
F) Non-occupant Loans on < 5 Family Dwellings (A B C & D)
G) Loans On Manufactured Home Dwelling (A B C & D)
Number
Average Value
Number
Average Value
Number
Average Value
Number
Average Value
Number
Average Value
Number
Average Value
Number
Average Value
LOANS ORIGINATED
45
$74,320
114
$67,012
171
$69,971
75
$21,909
2
$48,710
36
$49,728
7
$41,687
APPLICATIONS APPROVED, NOT ACCEPTED
7
$81,699
12
$57,988
35
$78,413
7
$31,157
0
$0
3
$109,100
4
$76,438
APPLICATIONS DENIED
10
$77,243
34
$56,873
228
$66,278
75
$25,668
0
$0
11
$52,909
20
$49,848
APPLICATIONS WITHDRAWN
1
$45,000
16
$68,962
113
$71,437
16
$45,318
0
$0
5
$51,590
2
$69,275
FILES CLOSED FOR INCOMPLETENESS
4
$62,440
8
$60,584
36
$85,153
3
$35,667
0
$0
1
$71,000
0
$0
Aggregated Statistics For Year 2003 (Based on 2 full and 4 partial tracts)
A) FHA, FSA/RHS & VA Home Purchase Loans
B) Conventional Home Purchase Loans
C) Refinancings
D) Home Improvement Loans
E) Loans on Dwellings For 5+ Families
F) Non-occupant Loans on < 5 Family Dwellings (A B C & D)
Number
Average Value
Number
Average Value
Number
Average Value
Number
Average Value
Number
Average Value
Number
Average Value
LOANS ORIGINATED
23
$68,464
114
$71,838
314
$68,987
71
$17,321
0
$0
21
$44,125
APPLICATIONS APPROVED, NOT ACCEPTED
1
$50,000
9
$47,842
54
$56,019
4
$17,012
2
$18,825
3
$26,333
APPLICATIONS DENIED
6
$58,232
11
$59,298
191
$69,670
44
$14,526
0
$0
15
$47,863
APPLICATIONS WITHDRAWN
3
$65,783
9
$85,703
139
$69,729
9
$27,101
0
$0
3
$43,333
FILES CLOSED FOR INCOMPLETENESS
0
$0
2
$43,490
9
$90,591
1
$61,000
0
$0
2
$38,500
Aggregated Statistics For Year 2002 (Based on 2 full and 4 partial tracts)
A) FHA, FSA/RHS & VA Home Purchase Loans
B) Conventional Home Purchase Loans
C) Refinancings
D) Home Improvement Loans
F) Non-occupant Loans on < 5 Family Dwellings (A B C & D)
Number
Average Value
Number
Average Value
Number
Average Value
Number
Average Value
Number
Average Value
LOANS ORIGINATED
25
$66,466
124
$58,671
232
$65,835
50
$18,326
30
$40,815
APPLICATIONS APPROVED, NOT ACCEPTED
0
$0
10
$62,074
52
$52,575
10
$10,541
3
$33,053
APPLICATIONS DENIED
2
$46,100
28
$38,759
219
$61,737
59
$17,815
13
$51,469
APPLICATIONS WITHDRAWN
0
$0
3
$57,803
133
$74,464
11
$22,060
0
$0
FILES CLOSED FOR INCOMPLETENESS
1
$64,000
7
$46,979
29
$61,168
0
$0
0
$0
Aggregated Statistics For Year 2001 (Based on 2 full and 4 partial tracts)
A) FHA, FSA/RHS & VA Home Purchase Loans
B) Conventional Home Purchase Loans
C) Refinancings
D) Home Improvement Loans
E) Loans on Dwellings For 5+ Families
F) Non-occupant Loans on < 5 Family Dwellings (A B C & D)
Number
Average Value
Number
Average Value
Number
Average Value
Number
Average Value
Number
Average Value
Number
Average Value
LOANS ORIGINATED
29
$76,732
119
$61,888
187
$62,455
65
$20,201
4
$49,250
17
$39,895
APPLICATIONS APPROVED, NOT ACCEPTED
1
$60,000
5
$38,968
38
$66,580
11
$27,085
0
$0
3
$63,333
APPLICATIONS DENIED
3
$71,000
30
$52,493
233
$52,866
39
$22,022
0
$0
4
$32,750
APPLICATIONS WITHDRAWN
1
$48,000
7
$37,854
114
$58,709
8
$19,231
0
$0
7
$49,690
FILES CLOSED FOR INCOMPLETENESS
0
$0
4
$105,050
20
$61,358
3
$33,333
0
$0
0
$0
Aggregated Statistics For Year 2000 (Based on 2 full and 4 partial tracts)
A) FHA, FSA/RHS & VA Home Purchase Loans
B) Conventional Home Purchase Loans
C) Refinancings
D) Home Improvement Loans
E) Loans on Dwellings For 5+ Families
F) Non-occupant Loans on < 5 Family Dwellings (A B C & D)
Number
Average Value
Number
Average Value
Number
Average Value
Number
Average Value
Number
Average Value
Number
Average Value
LOANS ORIGINATED
33
$57,728
119
$53,303
86
$47,397
72
$14,401
2
$39,140
17
$35,358
APPLICATIONS APPROVED, NOT ACCEPTED
3
$39,257
11
$42,096
35
$56,275
15
$29,471
0
$0
1
$27,000
APPLICATIONS DENIED
9
$67,451
33
$40,749
193
$52,838
60
$20,568
0
$0
8
$33,360
APPLICATIONS WITHDRAWN
3
$83,437
11
$48,454
82
$45,392
6
$42,847
0
$0
5
$37,520
FILES CLOSED FOR INCOMPLETENESS
2
$41,750
4
$46,572
23
$71,280
0
$0
0
$0
2
$18,825
Aggregated Statistics For Year 1999 (Based on 2 full and 2 partial tracts)
A) FHA, FSA/RHS & VA Home Purchase Loans
B) Conventional Home Purchase Loans
C) Refinancings
D) Home Improvement Loans
E) Loans on Dwellings For 5+ Families
F) Non-occupant Loans on < 5 Family Dwellings (A B C & D)
2002 - 2018 National Fire Incident Reporting System (NFIRS) incidents
Based on the data from the years 2002 - 2018 the average number of fire incidents per year is 43. The highest number of reported fires - 92 took place in 2016, and the least - 7 in 2003. The data has a constant trend.
When looking into fire subcategories, the most reports belonged to: Structure Fires (40.0%), and Outside Fires (28.2%).
Fire incident types reported to NFIRS in Zip Code 14103


 Nearest zip codes: 14479, 14105, 14098, 14013, 14411, 14125.
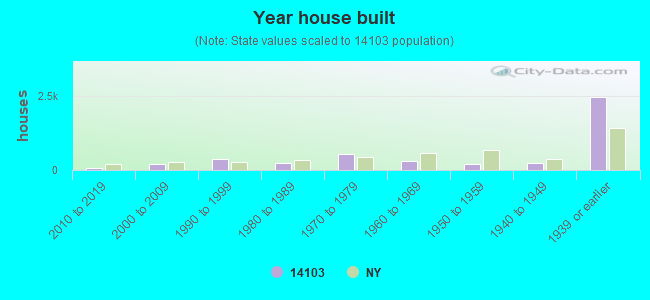


 Based on the data from the years 2002 - 2018 the average number of fire incidents per year is 43. The highest number of reported fires - 92 took place in 2016, and the least - 7 in 2003. The data has a constant trend.
 When looking into fire subcategories, the most reports belonged to: Structure Fires (40.0%), and Outside Fires (28.2%).