Estimated zip code population in 2022: 19,424
Zip code population in 2010: 19,804
Zip code population in 2000: 19,789
Houses and condos: 8,430
Renter-occupied apartments: 1,271
% of renters here:
16%State:
46%
March 2022 cost of living index in zip code 14526: 102.3
(near average, U.S. average is 100)
Land area: 16.7
sq. mi.
Water area: 0.0
sq. mi.
Population density: 1,161 people per square mile (low).
OSM Map
General Map
Google Map
MSN Map
OSM Map
General Map
Google Map
MSN Map
OSM Map
General Map
Google Map
MSN Map
OSM Map
General Map
Google Map
MSN Map
Please wait while loading the map...
Real estate property taxes paid for housing units in 2022:
This zip code:
2.6% ($6,469)New York:
1.5% ($6,180)
Median real estate property taxes paid for housing units with mortgages in 2022: $6,852 (2.6%)
Median real estate property taxes paid for housing units with no mortgage in 2022: $5,609 (2.3%)
Profiles of local businesses
Business Search - 14 Million verified businesses
Males: 9,003 Females: 10,421
For population 25 years and over in 14526:
High school or higher: 98.0%Bachelor's degree or higher: 63.0%Graduate or professional degree: 28.6%Unemployed: 4.1%Mean travel time to work (commute): 19.7 minutes
For population 15 years and over in 14526:
Never married: 23.7%Now married: 60.4%Separated: 0.6%Widowed: 7.3%Divorced: 8.1%
Zip code 14526 compared to state average:
Median house value below state average. Black race population percentage significantly below state average. Hispanic race population percentage significantly below state average. Median age above state average. Foreign-born population percentage significantly below state average. Renting percentage significantly below state average. Number of rooms per house above state average. House age below state average. Percentage of population with a bachelor's degree or higher above state average. 17,397 89.6% White 732 3.8% Hispanic or Latino 656 3.4% Two or more races 382 2.0% Asian 159 0.8% Black 83 0.4% Some other race 8 0.04% American Indian 3 0.02% Native Hawaiian and Other
Data:
Median household income ($)
Median household income (% change since 2000)
Household income diversity
Ratio of average income to average house value (%)
Ratio of average income to average rent
Median household income ($) - White
Median household income ($) - Black or African American
Median household income ($) - Asian
Median household income ($) - Hispanic or Latino
Median household income ($) - American Indian and Alaska Native
Median household income ($) - Multirace
Median household income ($) - Other Race
Median household income for houses/condos with a mortgage ($)
Median household income for apartments without a mortgage ($)
Races - White alone (%)
Races - White alone (% change since 2000)
Races - Black alone (%)
Races - Black alone (% change since 2000)
Races - American Indian alone (%)
Races - American Indian alone (% change since 2000)
Races - Asian alone (%)
Races - Asian alone (% change since 2000)
Races - Hispanic (%)
Races - Hispanic (% change since 2000)
Races - Native Hawaiian and Other Pacific Islander alone (%)
Races - Native Hawaiian and Other Pacific Islander alone (% change since 2000)
Races - Two or more races (%)
Races - Two or more races (% change since 2000)
Races - Other race alone (%)
Races - Other race alone (% change since 2000)
Racial diversity
Unemployment (%)
Unemployment (% change since 2000)
Unemployment (%) - White
Unemployment (%) - Black or African American
Unemployment (%) - Asian
Unemployment (%) - Hispanic or Latino
Unemployment (%) - American Indian and Alaska Native
Unemployment (%) - Multirace
Unemployment (%) - Other Race
Population density (people per square mile)
Population - Males (%)
Population - Females (%)
Population - Males (%) - White
Population - Males (%) - Black or African American
Population - Males (%) - Asian
Population - Males (%) - Hispanic or Latino
Population - Males (%) - American Indian and Alaska Native
Population - Males (%) - Multirace
Population - Males (%) - Other Race
Population - Females (%) - White
Population - Females (%) - Black or African American
Population - Females (%) - Asian
Population - Females (%) - Hispanic or Latino
Population - Females (%) - American Indian and Alaska Native
Population - Females (%) - Multirace
Population - Females (%) - Other Race
Coronavirus confirmed cases (Apr 27, 2024)
Deaths caused by coronavirus (Apr 27, 2024)
Coronavirus confirmed cases (per 100k population) (Apr 27, 2024)
Deaths caused by coronavirus (per 100k population) (Apr 27, 2024)
Daily increase in number of cases (Apr 27, 2024)
Weekly increase in number of cases (Apr 27, 2024)
Cases doubled (in days) (Apr 27, 2024)
Hospitalized patients (Apr 18, 2022)
Negative test results (Apr 18, 2022)
Total test results (Apr 18, 2022)
COVID Vaccine doses distributed (per 100k population) (Sep 19, 2023)
COVID Vaccine doses administered (per 100k population) (Sep 19, 2023)
COVID Vaccine doses distributed (Sep 19, 2023)
COVID Vaccine doses administered (Sep 19, 2023)
Likely homosexual households (%)
Likely homosexual households (% change since 2000)
Likely homosexual households - Lesbian couples (%)
Likely homosexual households - Lesbian couples (% change since 2000)
Likely homosexual households - Gay men (%)
Likely homosexual households - Gay men (% change since 2000)
Cost of living index
Median gross rent ($)
Median contract rent ($)
Median monthly housing costs ($)
Median house or condo value ($)
Median house or condo value ($ change since 2000)
Mean house or condo value by units in structure - 1, detached ($)
Mean house or condo value by units in structure - 1, attached ($)
Mean house or condo value by units in structure - 2 ($)
Mean house or condo value by units in structure by units in structure - 3 or 4 ($)
Mean house or condo value by units in structure - 5 or more ($)
Mean house or condo value by units in structure - Boat, RV, van, etc. ($)
Mean house or condo value by units in structure - Mobile home ($)
Median house or condo value ($) - White
Median house or condo value ($) - Black or African American
Median house or condo value ($) - Asian
Median house or condo value ($) - Hispanic or Latino
Median house or condo value ($) - American Indian and Alaska Native
Median house or condo value ($) - Multirace
Median house or condo value ($) - Other Race
Median resident age
Resident age diversity
Median resident age - Males
Median resident age - Females
Median resident age - White
Median resident age - Black or African American
Median resident age - Asian
Median resident age - Hispanic or Latino
Median resident age - American Indian and Alaska Native
Median resident age - Multirace
Median resident age - Other Race
Median resident age - Males - White
Median resident age - Males - Black or African American
Median resident age - Males - Asian
Median resident age - Males - Hispanic or Latino
Median resident age - Males - American Indian and Alaska Native
Median resident age - Males - Multirace
Median resident age - Males - Other Race
Median resident age - Females - White
Median resident age - Females - Black or African American
Median resident age - Females - Asian
Median resident age - Females - Hispanic or Latino
Median resident age - Females - American Indian and Alaska Native
Median resident age - Females - Multirace
Median resident age - Females - Other Race
Commute - mean travel time to work (minutes)
Travel time to work - Less than 5 minutes (%)
Travel time to work - Less than 5 minutes (% change since 2000)
Travel time to work - 5 to 9 minutes (%)
Travel time to work - 5 to 9 minutes (% change since 2000)
Travel time to work - 10 to 19 minutes (%)
Travel time to work - 10 to 19 minutes (% change since 2000)
Travel time to work - 20 to 29 minutes (%)
Travel time to work - 20 to 29 minutes (% change since 2000)
Travel time to work - 30 to 39 minutes (%)
Travel time to work - 30 to 39 minutes (% change since 2000)
Travel time to work - 40 to 59 minutes (%)
Travel time to work - 40 to 59 minutes (% change since 2000)
Travel time to work - 60 to 89 minutes (%)
Travel time to work - 60 to 89 minutes (% change since 2000)
Travel time to work - 90 or more minutes (%)
Travel time to work - 90 or more minutes (% change since 2000)
Marital status - Never married (%)
Marital status - Now married (%)
Marital status - Separated (%)
Marital status - Widowed (%)
Marital status - Divorced (%)
Median family income ($)
Median family income (% change since 2000)
Median non-family income ($)
Median non-family income (% change since 2000)
Median per capita income ($)
Median per capita income (% change since 2000)
Median family income ($) - White
Median family income ($) - Black or African American
Median family income ($) - Asian
Median family income ($) - Hispanic or Latino
Median family income ($) - American Indian and Alaska Native
Median family income ($) - Multirace
Median family income ($) - Other Race
Median year house/condo built
Median year apartment built
Year house built - Built 2005 or later (%)
Year house built - Built 2000 to 2004 (%)
Year house built - Built 1990 to 1999 (%)
Year house built - Built 1980 to 1989 (%)
Year house built - Built 1970 to 1979 (%)
Year house built - Built 1960 to 1969 (%)
Year house built - Built 1950 to 1959 (%)
Year house built - Built 1940 to 1949 (%)
Year house built - Built 1939 or earlier (%)
Average household size
Household density (households per square mile)
Average household size - White
Average household size - Black or African American
Average household size - Asian
Average household size - Hispanic or Latino
Average household size - American Indian and Alaska Native
Average household size - Multirace
Average household size - Other Race
Occupied housing units (%)
Vacant housing units (%)
Owner occupied housing units (%)
Renter occupied housing units (%)
Vacancy status - For rent (%)
Vacancy status - For sale only (%)
Vacancy status - Rented or sold, not occupied (%)
Vacancy status - For seasonal, recreational, or occasional use (%)
Vacancy status - For migrant workers (%)
Vacancy status - Other vacant (%)
Residents with income below the poverty level (%)
Residents with income below 50% of the poverty level (%)
Children below poverty level (%)
Poor families by family type - Married-couple family (%)
Poor families by family type - Male, no wife present (%)
Poor families by family type - Female, no husband present (%)
Poverty status for native-born residents (%)
Poverty status for foreign-born residents (%)
Poverty among high school graduates not in families (%)
Poverty among people who did not graduate high school not in families (%)
Residents with income below the poverty level (%) - White
Residents with income below the poverty level (%) - Black or African American
Residents with income below the poverty level (%) - Asian
Residents with income below the poverty level (%) - Hispanic or Latino
Residents with income below the poverty level (%) - American Indian and Alaska Native
Residents with income below the poverty level (%) - Multirace
Residents with income below the poverty level (%) - Other Race
Air pollution - Air Quality Index (AQI)
Air pollution - CO
Air pollution - NO2
Air pollution - SO2
Air pollution - Ozone
Air pollution - PM10
Air pollution - PM25
Air pollution - Pb
Crime - Murders per 100,000 population
Crime - Rapes per 100,000 population
Crime - Robberies per 100,000 population
Crime - Assaults per 100,000 population
Crime - Burglaries per 100,000 population
Crime - Thefts per 100,000 population
Crime - Auto thefts per 100,000 population
Crime - Arson per 100,000 population
Crime - City-data.com crime index
Crime - Violent crime index
Crime - Property crime index
Crime - Murders per 100,000 population (5 year average)
Crime - Rapes per 100,000 population (5 year average)
Crime - Robberies per 100,000 population (5 year average)
Crime - Assaults per 100,000 population (5 year average)
Crime - Burglaries per 100,000 population (5 year average)
Crime - Thefts per 100,000 population (5 year average)
Crime - Auto thefts per 100,000 population (5 year average)
Crime - Arson per 100,000 population (5 year average)
Crime - City-data.com crime index (5 year average)
Crime - Violent crime index (5 year average)
Crime - Property crime index (5 year average)
1996 Presidential Elections Results (%) - Democratic Party (Clinton)
1996 Presidential Elections Results (%) - Republican Party (Dole)
1996 Presidential Elections Results (%) - Other
2000 Presidential Elections Results (%) - Democratic Party (Gore)
2000 Presidential Elections Results (%) - Republican Party (Bush)
2000 Presidential Elections Results (%) - Other
2004 Presidential Elections Results (%) - Democratic Party (Kerry)
2004 Presidential Elections Results (%) - Republican Party (Bush)
2004 Presidential Elections Results (%) - Other
2008 Presidential Elections Results (%) - Democratic Party (Obama)
2008 Presidential Elections Results (%) - Republican Party (McCain)
2008 Presidential Elections Results (%) - Other
2012 Presidential Elections Results (%) - Democratic Party (Obama)
2012 Presidential Elections Results (%) - Republican Party (Romney)
2012 Presidential Elections Results (%) - Other
2016 Presidential Elections Results (%) - Democratic Party (Clinton)
2016 Presidential Elections Results (%) - Republican Party (Trump)
2016 Presidential Elections Results (%) - Other
2020 Presidential Elections Results (%) - Democratic Party (Biden)
2020 Presidential Elections Results (%) - Republican Party (Trump)
2020 Presidential Elections Results (%) - Other
Ancestries Reported - Arab (%)
Ancestries Reported - Czech (%)
Ancestries Reported - Danish (%)
Ancestries Reported - Dutch (%)
Ancestries Reported - English (%)
Ancestries Reported - French (%)
Ancestries Reported - French Canadian (%)
Ancestries Reported - German (%)
Ancestries Reported - Greek (%)
Ancestries Reported - Hungarian (%)
Ancestries Reported - Irish (%)
Ancestries Reported - Italian (%)
Ancestries Reported - Lithuanian (%)
Ancestries Reported - Norwegian (%)
Ancestries Reported - Polish (%)
Ancestries Reported - Portuguese (%)
Ancestries Reported - Russian (%)
Ancestries Reported - Scotch-Irish (%)
Ancestries Reported - Scottish (%)
Ancestries Reported - Slovak (%)
Ancestries Reported - Subsaharan African (%)
Ancestries Reported - Swedish (%)
Ancestries Reported - Swiss (%)
Ancestries Reported - Ukrainian (%)
Ancestries Reported - United States (%)
Ancestries Reported - Welsh (%)
Ancestries Reported - West Indian (%)
Ancestries Reported - Other (%)
Educational Attainment - No schooling completed (%)
Educational Attainment - Less than high school (%)
Educational Attainment - High school or equivalent (%)
Educational Attainment - Less than 1 year of college (%)
Educational Attainment - 1 or more years of college (%)
Educational Attainment - Associate degree (%)
Educational Attainment - Bachelor's degree (%)
Educational Attainment - Master's degree (%)
Educational Attainment - Professional school degree (%)
Educational Attainment - Doctorate degree (%)
School Enrollment - Nursery, preschool (%)
School Enrollment - Kindergarten (%)
School Enrollment - Grade 1 to 4 (%)
School Enrollment - Grade 5 to 8 (%)
School Enrollment - Grade 9 to 12 (%)
School Enrollment - College undergrad (%)
School Enrollment - Graduate or professional (%)
School Enrollment - Not enrolled in school (%)
School enrollment - Public schools (%)
School enrollment - Private schools (%)
School enrollment - Not enrolled (%)
Median number of rooms in houses and condos
Median number of rooms in apartments
Housing units lacking complete plumbing facilities (%)
Housing units lacking complete kitchen facilities (%)
Density of houses
Urban houses (%)
Rural houses (%)
Households with people 60 years and over (%)
Households with people 65 years and over (%)
Households with people 75 years and over (%)
Households with one or more nonrelatives (%)
Households with no nonrelatives (%)
Population in households (%)
Family households (%)
Nonfamily households (%)
Population in families (%)
Family households with own children (%)
Median number of bedrooms in owner occupied houses
Mean number of bedrooms in owner occupied houses
Median number of bedrooms in renter occupied houses
Mean number of bedrooms in renter occupied houses
Median number of vehichles in owner occupied houses
Mean number of vehichles in owner occupied houses
Median number of vehichles in renter occupied houses
Mean number of vehichles in renter occupied houses
Mortgage status - with mortgage (%)
Mortgage status - with second mortgage (%)
Mortgage status - with home equity loan (%)
Mortgage status - with both second mortgage and home equity loan (%)
Mortgage status - without a mortgage (%)
Average family size
Average family size - White
Average family size - Black or African American
Average family size - Asian
Average family size - Hispanic or Latino
Average family size - American Indian and Alaska Native
Average family size - Multirace
Average family size - Other Race
Geographical mobility - Same house 1 year ago (%)
Geographical mobility - Moved within same county (%)
Geographical mobility - Moved from different county within same state (%)
Geographical mobility - Moved from different state (%)
Geographical mobility - Moved from abroad (%)
Place of birth - Born in state of residence (%)
Place of birth - Born in other state (%)
Place of birth - Native, outside of US (%)
Place of birth - Foreign born (%)
Housing units in structures - 1, detached (%)
Housing units in structures - 1, attached (%)
Housing units in structures - 2 (%)
Housing units in structures - 3 or 4 (%)
Housing units in structures - 5 to 9 (%)
Housing units in structures - 10 to 19 (%)
Housing units in structures - 20 to 49 (%)
Housing units in structures - 50 or more (%)
Housing units in structures - Mobile home (%)
Housing units in structures - Boat, RV, van, etc. (%)
House/condo owner moved in on average (years ago)
Renter moved in on average (years ago)
Year householder moved into unit - Moved in 1999 to March 2000 (%)
Year householder moved into unit - Moved in 1995 to 1998 (%)
Year householder moved into unit - Moved in 1990 to 1994 (%)
Year householder moved into unit - Moved in 1980 to 1989 (%)
Year householder moved into unit - Moved in 1970 to 1979 (%)
Year householder moved into unit - Moved in 1969 or earlier (%)
Means of transportation to work - Drove car alone (%)
Means of transportation to work - Carpooled (%)
Means of transportation to work - Public transportation (%)
Means of transportation to work - Bus or trolley bus (%)
Means of transportation to work - Streetcar or trolley car (%)
Means of transportation to work - Subway or elevated (%)
Means of transportation to work - Railroad (%)
Means of transportation to work - Ferryboat (%)
Means of transportation to work - Taxicab (%)
Means of transportation to work - Motorcycle (%)
Means of transportation to work - Bicycle (%)
Means of transportation to work - Walked (%)
Means of transportation to work - Other means (%)
Working at home (%)
Industry diversity
Most Common Industries - Agriculture, forestry, fishing and hunting, and mining (%)
Most Common Industries - Agriculture, forestry, fishing and hunting (%)
Most Common Industries - Mining, quarrying, and oil and gas extraction (%)
Most Common Industries - Construction (%)
Most Common Industries - Manufacturing (%)
Most Common Industries - Wholesale trade (%)
Most Common Industries - Retail trade (%)
Most Common Industries - Transportation and warehousing, and utilities (%)
Most Common Industries - Transportation and warehousing (%)
Most Common Industries - Utilities (%)
Most Common Industries - Information (%)
Most Common Industries - Finance and insurance, and real estate and rental and leasing (%)
Most Common Industries - Finance and insurance (%)
Most Common Industries - Real estate and rental and leasing (%)
Most Common Industries - Professional, scientific, and management, and administrative and waste management services (%)
Most Common Industries - Professional, scientific, and technical services (%)
Most Common Industries - Management of companies and enterprises (%)
Most Common Industries - Administrative and support and waste management services (%)
Most Common Industries - Educational services, and health care and social assistance (%)
Most Common Industries - Educational services (%)
Most Common Industries - Health care and social assistance (%)
Most Common Industries - Arts, entertainment, and recreation, and accommodation and food services (%)
Most Common Industries - Arts, entertainment, and recreation (%)
Most Common Industries - Accommodation and food services (%)
Most Common Industries - Other services, except public administration (%)
Most Common Industries - Public administration (%)
Occupation diversity
Most Common Occupations - Management, business, science, and arts occupations (%)
Most Common Occupations - Management, business, and financial occupations (%)
Most Common Occupations - Management occupations (%)
Most Common Occupations - Business and financial operations occupations (%)
Most Common Occupations - Computer, engineering, and science occupations (%)
Most Common Occupations - Computer and mathematical occupations (%)
Most Common Occupations - Architecture and engineering occupations (%)
Most Common Occupations - Life, physical, and social science occupations (%)
Most Common Occupations - Education, legal, community service, arts, and media occupations (%)
Most Common Occupations - Community and social service occupations (%)
Most Common Occupations - Legal occupations (%)
Most Common Occupations - Education, training, and library occupations (%)
Most Common Occupations - Arts, design, entertainment, sports, and media occupations (%)
Most Common Occupations - Healthcare practitioners and technical occupations (%)
Most Common Occupations - Health diagnosing and treating practitioners and other technical occupations (%)
Most Common Occupations - Health technologists and technicians (%)
Most Common Occupations - Service occupations (%)
Most Common Occupations - Healthcare support occupations (%)
Most Common Occupations - Protective service occupations (%)
Most Common Occupations - Fire fighting and prevention, and other protective service workers including supervisors (%)
Most Common Occupations - Law enforcement workers including supervisors (%)
Most Common Occupations - Food preparation and serving related occupations (%)
Most Common Occupations - Building and grounds cleaning and maintenance occupations (%)
Most Common Occupations - Personal care and service occupations (%)
Most Common Occupations - Sales and office occupations (%)
Most Common Occupations - Sales and related occupations (%)
Most Common Occupations - Office and administrative support occupations (%)
Most Common Occupations - Natural resources, construction, and maintenance occupations (%)
Most Common Occupations - Farming, fishing, and forestry occupations (%)
Most Common Occupations - Construction and extraction occupations (%)
Most Common Occupations - Installation, maintenance, and repair occupations (%)
Most Common Occupations - Production, transportation, and material moving occupations (%)
Most Common Occupations - Production occupations (%)
Most Common Occupations - Transportation occupations (%)
Most Common Occupations - Material moving occupations (%)
People in Group quarters - Institutionalized population (%)
People in Group quarters - Correctional institutions (%)
People in Group quarters - Federal prisons and detention centers (%)
People in Group quarters - Halfway houses (%)
People in Group quarters - Local jails and other confinement facilities (including police lockups) (%)
People in Group quarters - Military disciplinary barracks (%)
People in Group quarters - State prisons (%)
People in Group quarters - Other types of correctional institutions (%)
People in Group quarters - Nursing homes (%)
People in Group quarters - Hospitals/wards, hospices, and schools for the handicapped (%)
People in Group quarters - Hospitals/wards and hospices for chronically ill (%)
People in Group quarters - Hospices or homes for chronically ill (%)
People in Group quarters - Military hospitals or wards for chronically ill (%)
People in Group quarters - Other hospitals or wards for chronically ill (%)
People in Group quarters - Hospitals or wards for drug/alcohol abuse (%)
People in Group quarters - Mental (Psychiatric) hospitals or wards (%)
People in Group quarters - Schools, hospitals, or wards for the mentally retarded (%)
People in Group quarters - Schools, hospitals, or wards for the physically handicapped (%)
People in Group quarters - Institutions for the deaf (%)
People in Group quarters - Institutions for the blind (%)
People in Group quarters - Orthopedic wards and institutions for the physically handicapped (%)
People in Group quarters - Wards in general hospitals for patients who have no usual home elsewhere (%)
People in Group quarters - Wards in military hospitals for patients who have no usual home elsewhere (%)
People in Group quarters - Juvenile institutions (%)
People in Group quarters - Long-term care (%)
People in Group quarters - Homes for abused, dependent, and neglected children (%)
People in Group quarters - Residential treatment centers for emotionally disturbed children (%)
People in Group quarters - Training schools for juvenile delinquents (%)
People in Group quarters - Short-term care, detention or diagnostic centers for delinquent children (%)
People in Group quarters - Type of juvenile institution unknown (%)
People in Group quarters - Noninstitutionalized population (%)
People in Group quarters - College dormitories (includes college quarters off campus) (%)
People in Group quarters - Military quarters (%)
People in Group quarters - On base (%)
People in Group quarters - Barracks, unaccompanied personnel housing (UPH), (Enlisted/Officer), ;and similar group living quarters for military personnel (%)
People in Group quarters - Transient quarters for temporary residents (%)
People in Group quarters - Military ships (%)
People in Group quarters - Group homes (%)
People in Group quarters - Homes or halfway houses for drug/alcohol abuse (%)
People in Group quarters - Homes for the mentally ill (%)
People in Group quarters - Homes for the mentally retarded (%)
People in Group quarters - Homes for the physically handicapped (%)
People in Group quarters - Other group homes (%)
People in Group quarters - Religious group quarters (%)
People in Group quarters - Dormitories (%)
People in Group quarters - Agriculture workers' dormitories on farms (%)
People in Group quarters - Job Corps and vocational training facilities (%)
People in Group quarters - Other workers' dormitories (%)
People in Group quarters - Crews of maritime vessels (%)
People in Group quarters - Other nonhousehold living situations (%)
People in Group quarters - Other noninstitutional group quarters (%)
Residents speaking English at home (%)
Residents speaking English at home - Born in the United States (%)
Residents speaking English at home - Native, born elsewhere (%)
Residents speaking English at home - Foreign born (%)
Residents speaking Spanish at home (%)
Residents speaking Spanish at home - Born in the United States (%)
Residents speaking Spanish at home - Native, born elsewhere (%)
Residents speaking Spanish at home - Foreign born (%)
Residents speaking other language at home (%)
Residents speaking other language at home - Born in the United States (%)
Residents speaking other language at home - Native, born elsewhere (%)
Residents speaking other language at home - Foreign born (%)
Class of Workers - Employee of private company (%)
Class of Workers - Self-employed in own incorporated business (%)
Class of Workers - Private not-for-profit wage and salary workers (%)
Class of Workers - Local government workers (%)
Class of Workers - State government workers (%)
Class of Workers - Federal government workers (%)
Class of Workers - Self-employed workers in own not incorporated business and Unpaid family workers (%)
House heating fuel used in houses and condos - Utility gas (%)
House heating fuel used in houses and condos - Bottled, tank, or LP gas (%)
House heating fuel used in houses and condos - Electricity (%)
House heating fuel used in houses and condos - Fuel oil, kerosene, etc. (%)
House heating fuel used in houses and condos - Coal or coke (%)
House heating fuel used in houses and condos - Wood (%)
House heating fuel used in houses and condos - Solar energy (%)
House heating fuel used in houses and condos - Other fuel (%)
House heating fuel used in houses and condos - No fuel used (%)
House heating fuel used in apartments - Utility gas (%)
House heating fuel used in apartments - Bottled, tank, or LP gas (%)
House heating fuel used in apartments - Electricity (%)
House heating fuel used in apartments - Fuel oil, kerosene, etc. (%)
House heating fuel used in apartments - Coal or coke (%)
House heating fuel used in apartments - Wood (%)
House heating fuel used in apartments - Solar energy (%)
House heating fuel used in apartments - Other fuel (%)
House heating fuel used in apartments - No fuel used (%)
Armed forces status - In Armed Forces (%)
Armed forces status - Civilian (%)
Armed forces status - Civilian - Veteran (%)
Armed forces status - Civilian - Nonveteran (%)
Fatal accidents locations in years 2005-2021
Fatal accidents locations in 2005
Fatal accidents locations in 2006
Fatal accidents locations in 2007
Fatal accidents locations in 2008
Fatal accidents locations in 2009
Fatal accidents locations in 2010
Fatal accidents locations in 2011
Fatal accidents locations in 2012
Fatal accidents locations in 2013
Fatal accidents locations in 2014
Fatal accidents locations in 2015
Fatal accidents locations in 2016
Fatal accidents locations in 2017
Fatal accidents locations in 2018
Fatal accidents locations in 2019
Fatal accidents locations in 2020
Fatal accidents locations in 2021
Alcohol use - People drinking some alcohol every month (%)
Alcohol use - People not drinking at all (%)
Alcohol use - Average days/month drinking alcohol
Alcohol use - Average drinks/week
Alcohol use - Average days/year people drink much
Audiometry - Average condition of hearing (%)
Audiometry - People that can hear a whisper from across a quiet room (%)
Audiometry - People that can hear normal voice from across a quiet room (%)
Audiometry - Ears ringing, roaring, buzzing (%)
Audiometry - Had a job exposure to loud noise (%)
Audiometry - Had off-work exposure to loud noise (%)
Blood Pressure & Cholesterol - Has high blood pressure (%)
Blood Pressure & Cholesterol - Checking blood pressure at home (%)
Blood Pressure & Cholesterol - Frequently checking blood cholesterol (%)
Blood Pressure & Cholesterol - Has high cholesterol level (%)
Consumer Behavior - Money monthly spent on food at supermarket/grocery store
Consumer Behavior - Money monthly spent on food at other stores
Consumer Behavior - Money monthly spent on eating out
Consumer Behavior - Money monthly spent on carryout/delivered foods
Consumer Behavior - Income spent on food at supermarket/grocery store (%)
Consumer Behavior - Income spent on food at other stores (%)
Consumer Behavior - Income spent on eating out (%)
Consumer Behavior - Income spent on carryout/delivered foods (%)
Current Health Status - General health condition (%)
Current Health Status - Blood donors (%)
Current Health Status - Has blood ever tested for HIV virus (%)
Current Health Status - Left-handed people (%)
Dermatology - People using sunscreen (%)
Diabetes - Diabetics (%)
Diabetes - Had a blood test for high blood sugar (%)
Diabetes - People taking insulin (%)
Diet Behavior & Nutrition - Diet health (%)
Diet Behavior & Nutrition - Milk product consumption (# of products/month)
Diet Behavior & Nutrition - Meals not home prepared (#/week)
Diet Behavior & Nutrition - Meals from fast food or pizza place (#/week)
Diet Behavior & Nutrition - Ready-to-eat foods (#/month)
Diet Behavior & Nutrition - Frozen meals/pizza (#/month)
Drug Use - People that ever used marijuana or hashish (%)
Drug Use - Ever used hard drugs (%)
Drug Use - Ever used any form of cocaine (%)
Drug Use - Ever used heroin (%)
Drug Use - Ever used methamphetamine (%)
Health Insurance - People covered by health insurance (%)
Kidney Conditions-Urology - Avg. # of times urinating at night
Medical Conditions - People with asthma (%)
Medical Conditions - People with anemia (%)
Medical Conditions - People with psoriasis (%)
Medical Conditions - People with overweight (%)
Medical Conditions - Elderly people having difficulties in thinking or remembering (%)
Medical Conditions - People who ever received blood transfusion (%)
Medical Conditions - People having trouble seeing even with glass/contacts (%)
Medical Conditions - People with arthritis (%)
Medical Conditions - People with gout (%)
Medical Conditions - People with congestive heart failure (%)
Medical Conditions - People with coronary heart disease (%)
Medical Conditions - People with angina pectoris (%)
Medical Conditions - People who ever had heart attack (%)
Medical Conditions - People who ever had stroke (%)
Medical Conditions - People with emphysema (%)
Medical Conditions - People with thyroid problem (%)
Medical Conditions - People with chronic bronchitis (%)
Medical Conditions - People with any liver condition (%)
Medical Conditions - People who ever had cancer or malignancy (%)
Mental Health - People who have little interest in doing things (%)
Mental Health - People feeling down, depressed, or hopeless (%)
Mental Health - People who have trouble sleeping or sleeping too much (%)
Mental Health - People feeling tired or having little energy (%)
Mental Health - People with poor appetite or overeating (%)
Mental Health - People feeling bad about themself (%)
Mental Health - People who have trouble concentrating on things (%)
Mental Health - People moving or speaking slowly or too fast (%)
Mental Health - People having thoughts they would be better off dead (%)
Oral Health - Average years since last visit a dentist
Oral Health - People embarrassed because of mouth (%)
Oral Health - People with gum disease (%)
Oral Health - General health of teeth and gums (%)
Oral Health - Average days a week using dental floss/device
Oral Health - Average days a week using mouthwash for dental problem
Oral Health - Average number of teeth
Pesticide Use - Households using pesticides to control insects (%)
Pesticide Use - Households using pesticides to kill weeds (%)
Physical Activity - People doing vigorous-intensity work activities (%)
Physical Activity - People doing moderate-intensity work activities (%)
Physical Activity - People walking or bicycling (%)
Physical Activity - People doing vigorous-intensity recreational activities (%)
Physical Activity - People doing moderate-intensity recreational activities (%)
Physical Activity - Average hours a day doing sedentary activities
Physical Activity - Average hours a day watching TV or videos
Physical Activity - Average hours a day using computer
Physical Functioning - People having limitations keeping them from working (%)
Physical Functioning - People limited in amount of work they can do (%)
Physical Functioning - People that need special equipment to walk (%)
Physical Functioning - People experiencing confusion/memory problems (%)
Physical Functioning - People requiring special healthcare equipment (%)
Prescription Medications - Average number of prescription medicines taking
Preventive Aspirin Use - Adults 40+ taking low-dose aspirin (%)
Reproductive Health - Vaginal deliveries (%)
Reproductive Health - Cesarean deliveries (%)
Reproductive Health - Deliveries resulted in a live birth (%)
Reproductive Health - Pregnancies resulted in a delivery (%)
Reproductive Health - Women breastfeeding newborns (%)
Reproductive Health - Women that had a hysterectomy (%)
Reproductive Health - Women that had both ovaries removed (%)
Reproductive Health - Women that have ever taken birth control pills (%)
Reproductive Health - Women taking birth control pills (%)
Reproductive Health - Women that have ever used Depo-Provera or injectables (%)
Reproductive Health - Women that have ever used female hormones (%)
Sexual Behavior - People 18+ that ever had sex (vaginal, anal, or oral) (%)
Sexual Behavior - Males 18+ that ever had vaginal sex with a woman (%)
Sexual Behavior - Males 18+ that ever performed oral sex on a woman (%)
Sexual Behavior - Males 18+ that ever had anal sex with a woman (%)
Sexual Behavior - Males 18+ that ever had any sex with a man (%)
Sexual Behavior - Females 18+ that ever had vaginal sex with a man (%)
Sexual Behavior - Females 18+ that ever performed oral sex on a man (%)
Sexual Behavior - Females 18+ that ever had anal sex with a man (%)
Sexual Behavior - Females 18+ that ever had any kind of sex with a woman (%)
Sexual Behavior - Average age people first had sex
Sexual Behavior - Average number of female sex partners in lifetime (males 18+)
Sexual Behavior - Average number of female vaginal sex partners in lifetime (males 18+)
Sexual Behavior - Average age people first performed oral sex on a woman (18+)
Sexual Behavior - Average number of woman performed oral sex on in lifetime (18+)
Sexual Behavior - Average number of male sex partners in lifetime (males 18+)
Sexual Behavior - Average number of male anal sex partners in lifetime (males 18+)
Sexual Behavior - Average age people first performed oral sex on a man (18+)
Sexual Behavior - Average number of male oral sex partners in lifetime (18+)
Sexual Behavior - People using protection when performing oral sex (%)
Sexual Behavior - Average number of times people have vaginal or anal sex a year
Sexual Behavior - People having sex without condom (%)
Sexual Behavior - Average number of male sex partners in lifetime (females 18+)
Sexual Behavior - Average number of male vaginal sex partners in lifetime (females 18+)
Sexual Behavior - Average number of female sex partners in lifetime (females 18+)
Sexual Behavior - Circumcised males 18+ (%)
Sleep Disorders - Average hours sleeping at night
Sleep Disorders - People that has trouble sleeping (%)
Smoking-Cigarette Use - People smoking cigarettes (%)
Taste & Smell - People 40+ having problems with smell (%)
Taste & Smell - People 40+ having problems with taste (%)
Taste & Smell - People 40+ that ever had wisdom teeth removed (%)
Taste & Smell - People 40+ that ever had tonsils teeth removed (%)
Taste & Smell - People 40+ that ever had a loss of consciousness because of a head injury (%)
Taste & Smell - People 40+ that ever had a broken nose or other serious injury to face or skull (%)
Taste & Smell - People 40+ that ever had two or more sinus infections (%)
Weight - Average height (inches)
Weight - Average weight (pounds)
Weight - Average BMI
Weight - People that are obese (%)
Weight - People that ever were obese (%)
Weight - People trying to lose weight (%)
Urban population: 17,202
Rural population: 2,221
Estimated median house/condo value in 2022: $252,687
14526:
$252,687New York:
$400,400
Median resident age: This zip code:
46.9 yearsNew York median age:
40.0 years
Average household size: This zip code:
2.3 peopleNew York:
2.5 people
Averages for the 2020 tax year for zip code 14526, filed in 2021:
Average Adjusted Gross Income (AGI) in 2020: $94,722 (Individual Income Tax Returns) Here:
$94,722State:
$90,930
Salary/wage: $79,004 (reported on 78.3% of returns )Here:
$79,004State:
$72,104
(% of AGI for various income ranges: 1005.4% for AGIs below $25k , 3260.3% for AGIs $25k-50k , 5815.5% for AGIs $50k-75k , 8337.8% for AGIs $75k-100k , 17619.4% for AGIs $100k-200k , 71688.7% for AGIs over 200k ) Taxable interest for individuals: $1,211 (reported on 58.9% of returns )This zip code:
$1,211New York:
$3,075
(% of AGI for various income ranges: 31.4% for AGIs below $25k , 39.7% for AGIs $25k-50k , 61.5% for AGIs $50k-75k , 123.4% for AGIs $75k-100k , 171.9% for AGIs $100k-200k , 807.4% for AGIs over 200k ) Ordinary dividends: $6,263 (reported on 37.6% of returns )(% of AGI for various income ranges: 64.2% for AGIs below $25k , 93.5% for AGIs $25k-50k , 166.9% for AGIs $50k-75k , 304.6% for AGIs $75k-100k , 498.6% for AGIs $100k-200k , 3758.1% for AGIs over 200k ) Net capital gain/loss in AGI: +$19,242 (reported on 32.8% of returns )Here:
+$19,242State:
+$44,925
(% of AGI for various income ranges: 26.0% for AGIs below $25k , 62.8% for AGIs $25k-50k , 144.1% for AGIs $50k-75k , 302.7% for AGIs $75k-100k , 731.2% for AGIs $100k-200k , 16920.0% for AGIs over 200k ) Profit/loss from business: +$21,269 (reported on 14.2% of returns )Here:
+$21,269State:
+$14,940
(% of AGI for various income ranges: 78.3% for AGIs below $25k , 137.3% for AGIs $25k-50k , 213.7% for AGIs $50k-75k , 324.9% for AGIs $75k-100k , 591.2% for AGIs $100k-200k , 5164.8% for AGIs over 200k ) Taxable individual retirement arrangement distribution: $23,453 (reported on 17.5% of returns )14526:
$23,453New York:
$19,609
(% of AGI for various income ranges: 141.8% for AGIs below $25k , 290.2% for AGIs $25k-50k , 488.6% for AGIs $50k-75k , 857.7% for AGIs $75k-100k , 1257.2% for AGIs $100k-200k , 2517.4% for AGIs over 200k ) Self-employed (Keogh) retirement plans: $26,944 (reported on 1.5% of returns )14526:
$26,944New York:
$32,497
(% of AGI for various income ranges: 23.1% for AGIs $50k-75k , 46.4% for AGIs $100k-200k , 1091.6% for AGIs over 200k ) Total itemized deductions: $29,366 (reported on 9.5% of returns )Here:
$29,366State:
$39,326
(% of AGI for various income ranges: 85.9% for AGIs below $25k , 181.5% for AGIs $25k-50k , 322.7% for AGIs $50k-75k , 619.3% for AGIs $75k-100k , 624.7% for AGIs $100k-200k , 2860.6% for AGIs over 200k ) Charity contributions: $8,685 (reported on 7.8% of returns )(% of AGI for various income ranges: 4.8% for AGIs below $25k , 18.5% for AGIs $25k-50k , 25.8% for AGIs $50k-75k , 97.7% for AGIs $75k-100k , 154.5% for AGIs $100k-200k , 1186.5% for AGIs over 200k ) Taxes paid: $8,854 (reported on 9.5% of returns )(% of AGI for various income ranges: 19.7% for AGIs below $25k , 46.0% for AGIs $25k-50k , 129.5% for AGIs $50k-75k , 210.0% for AGIs $75k-100k , 204.0% for AGIs $100k-200k , 697.1% for AGIs over 200k ) Earned income credit: $1,846 (reported on 6.2% of returns )(% of AGI for various income ranges: 41.8% for AGIs below $25k , 34.4% for AGIs $25k-50k ) Percentage of individuals using paid preparers for their 2020 taxes: 95.1%(% for various income ranges: 93.3% for AGIs below $25k , 94.9% for AGIs $25k-50k , 96.0% for AGIs $50k-75k , 94.6% for AGIs $75k-100k , 96.1% for AGIs $100k-200k , 96.9% for AGIs over 200k )
Averages for the 2012 tax year for zip code 14526, filed in 2013:
Average Adjusted Gross Income (AGI) in 2012: $79,243 (Individual Income Tax Returns) Here:
$79,243State:
$77,088
Salary/wage: $66,515 (reported on 81.0% of returns )Here:
$66,515State:
$60,593
(% of AGI for various income ranges: 66.6% for AGIs below $25k , 72.7% for AGIs $25k-50k , 69.8% for AGIs $50k-75k , 70.1% for AGIs $75k-100k , 75.0% for AGIs $100k-200k , 57.1% for AGIs over 200k ) Taxable interest for individuals: $1,072 (reported on 60.9% of returns )This zip code:
$1,072New York:
$3,125
(% of AGI for various income ranges: 1.8% for AGIs below $25k , 1.0% for AGIs $25k-50k , 0.9% for AGIs $50k-75k , 0.6% for AGIs $75k-100k , 0.5% for AGIs $100k-200k , 1.1% for AGIs over 200k ) Ordinary dividends: $5,291 (reported on 38.5% of returns )(% of AGI for various income ranges: 3.8% for AGIs below $25k , 2.1% for AGIs $25k-50k , 2.0% for AGIs $50k-75k , 1.9% for AGIs $75k-100k , 1.9% for AGIs $100k-200k , 3.8% for AGIs over 200k ) Net capital gain/loss in AGI: +$6,518 (reported on 30.7% of returns )Here:
+$6,518State:
+$42,474
(% of AGI for various income ranges: 0.4% for AGIs $25k-50k , 0.7% for AGIs $50k-75k , 0.9% for AGIs $75k-100k , 1.1% for AGIs $100k-200k , 6.6% for AGIs over 200k ) Profit/loss from business: +$23,104 (reported on 14.3% of returns )Here:
+$23,104State:
+$16,168
(% of AGI for various income ranges: 5.0% for AGIs below $25k , 3.2% for AGIs $25k-50k , 3.0% for AGIs $50k-75k , 2.5% for AGIs $75k-100k , 3.2% for AGIs $100k-200k , 6.6% for AGIs over 200k ) Taxable individual retirement arrangement distribution: $18,841 (reported on 17.5% of returns )14526:
$18,841New York:
$17,621
(% of AGI for various income ranges: 7.7% for AGIs below $25k , 5.7% for AGIs $25k-50k , 5.2% for AGIs $50k-75k , 5.6% for AGIs $75k-100k , 4.5% for AGIs $100k-200k , 1.8% for AGIs over 200k ) Self-employment retirement plans: $23,874 (reported on 1.8% of returns )14526:
$23,874New York:
$27,330
(% of AGI for various income ranges: 0.3% for AGIs $50k-75k , 0.4% for AGIs $100k-200k , 1.3% for AGIs over 200k ) Total itemized deductions: $24,772 (19% of AGI, reported on 50.5% of returns )Here:
$24,772State:
$34,985
Here:
19.4% of AGIState:
21.3% of AGI
(% of AGI for various income ranges: 14.0% for AGIs below $25k , 13.7% for AGIs $25k-50k , 15.6% for AGIs $50k-75k , 16.4% for AGIs $75k-100k , 17.1% for AGIs $100k-200k , 14.9% for AGIs over 200k ) Charity contributions: $3,254 (reported on 45.4% of returns )(% of AGI for various income ranges: 0.8% for AGIs below $25k , 1.4% for AGIs $25k-50k , 1.5% for AGIs $50k-75k , 1.7% for AGIs $75k-100k , 2.0% for AGIs $100k-200k , 2.1% for AGIs over 200k ) Taxes paid: $14,013 (reported on 50.5% of returns )14526:
$14,013State:
$18,656
(% of AGI for various income ranges: 4.2% for AGIs below $25k , 5.5% for AGIs $25k-50k , 7.6% for AGIs $50k-75k , 8.7% for AGIs $75k-100k , 10.0% for AGIs $100k-200k , 9.8% for AGIs over 200k ) Earned income credit: $1,789 (reported on 6.6% of returns )(% of AGI for various income ranges: 2.6% for AGIs below $25k , 0.5% for AGIs $25k-50k ) Percentage of individuals using paid preparers for their 2012 taxes: 52.8%(% for various income ranges: 44.1% for AGIs below $25k , 52.4% for AGIs $25k-50k , 57.5% for AGIs $50k-75k , 54.4% for AGIs $75k-100k , 56.2% for AGIs $100k-200k , 72.3% for AGIs over 200k )
Averages for the 2004 tax year for zip code 14526, filed in 2005:
Average Adjusted Gross Income (AGI) in 2004: $65,212 (Individual Income Tax Returns) Here:
$65,212State:
$59,519
Salary/wage: $58,202 (reported on 82.1% of returns )Here:
$58,202State:
$50,673
(% of AGI for various income ranges: 100.2% for AGIs below $10k , 64.7% for AGIs $10k-25k , 72.2% for AGIs $25k-50k , 73.8% for AGIs $50k-75k , 78.9% for AGIs $75k-100k , 71.8% for AGIs over 100k ) Taxable interest for individuals: $1,261 (reported on 73.5% of returns )This zip code:
$1,261New York:
$2,377
(% of AGI for various income ranges: 6.8% for AGIs below $10k , 3.6% for AGIs $10k-25k , 1.8% for AGIs $25k-50k , 1.3% for AGIs $50k-75k , 1.4% for AGIs $75k-100k , 1.1% for AGIs over 100k ) Taxable dividends: $3,000 (reported on 48.9% of returns )(% of AGI for various income ranges: 7.2% for AGIs below $10k , 4.8% for AGIs $10k-25k , 2.0% for AGIs $25k-50k , 1.7% for AGIs $50k-75k , 1.5% for AGIs $75k-100k , 2.4% for AGIs over 100k ) Net capital gain/loss: +$6,283 (reported on 37.7% of returns )Here:
+$6,283State:
+$23,581
(% of AGI for various income ranges: -4.4% for AGIs below $10k , 0.7% for AGIs $10k-25k , 0.3% for AGIs $25k-50k , 1.3% for AGIs $50k-75k , 0.9% for AGIs $75k-100k , 6.1% for AGIs over 100k ) Profit/loss from business: +$17,214 (reported on 15.0% of returns )Here:
+$17,214State:
+$13,809
(% of AGI for various income ranges: 7.6% for AGIs below $10k , 4.1% for AGIs $10k-25k , 3.8% for AGIs $25k-50k , 2.8% for AGIs $50k-75k , 3.0% for AGIs $75k-100k , 4.5% for AGIs over 100k ) Profit/loss from farming: +$900 (reported on 0.1% of returns )
Here : State :
IRA payment deduction: $3,196 (reported on 3.3% of returns )14526:
$3,196New York:
$3,115
(% of AGI for various income ranges: 0.5% for AGIs below $10k , 0.4% for AGIs $10k-25k , 0.4% for AGIs $25k-50k , 0.2% for AGIs $50k-75k , 0.2% for AGIs $75k-100k , 0.1% for AGIs over 100k ) Self-employed pension: $14,824 (reported on 2.1% of returns )Here:
$14,824New York:
$19,016
(% of AGI for various income ranges: 0.2% for AGIs $25k-50k , 0.2% for AGIs $50k-75k , 0.2% for AGIs $75k-100k , 0.7% for AGIs over 100k ) Total itemized deductions: $20,592 (20% of AGI, reported on 54.4% of returns )Here:
$20,592State:
$25,864
Here:
20.3% of AGIState:
21.9% of AGI
(% of AGI for various income ranges: 18.5% for AGIs below $10k , 16.7% for AGIs $10k-25k , 16.8% for AGIs $25k-50k , 18.9% for AGIs $50k-75k , 18.8% for AGIs $75k-100k , 16.4% for AGIs over 100k ) Charity contributions deductions: $3,039 (3% of AGI, reported on 51.3% of returns )Here:
2.9% of AGIState:
3.6% of AGI
(% of AGI for various income ranges: 1.0% for AGIs below $10k , 1.6% for AGIs $10k-25k , 1.7% for AGIs $25k-50k , 2.4% for AGIs $50k-75k , 2.4% for AGIs $75k-100k , 2.6% for AGIs over 100k ) Total tax: $10,760 (reported on 80.8% of returns )14526:
$10,760State:
$11,730
(% of AGI for various income ranges: 2.8% for AGIs below $10k , 4.4% for AGIs $10k-25k , 7.6% for AGIs $25k-50k , 9.0% for AGIs $50k-75k , 9.9% for AGIs $75k-100k , 17.4% for AGIs over 100k ) Earned income credit: $1,336 (reported on 5.2% of returns )Percentage of individuals using paid preparers for their 2004 taxes: 56.0%(% for various income ranges: 46.2% for AGIs below $10k , 55.7% for AGIs $10k-25k , 58.5% for AGIs $25k-50k , 61.3% for AGIs $50k-75k , 57.2% for AGIs $75k-100k , 59.0% for AGIs over 100k )
Estimated median household income in 2022: This zip code:
$105,140New York:
$79,557
Nearest zip codes: 14445 ,
14625 ,
14450 ,
14580 ,
14610 ,
14609 .
Percentage of family households: This zip code:
46.8%New York:
41.3%
Percentage of households with unmarried partners: This zip code:
6.0%New York:
42.3%
Likely homosexual households (counted as self-reported same-sex unmarried-partner households)
Lesbian couples: 0.6% of all households Gay men: 0.1% of all households
Household received Food Stamps/SNAP in the past 12 months: 247Household did not receive Food Stamps/SNAP in the past 12 months: 7,760
Women who had a birth in the past 12 months: 312 (239 now married , 71 unmarried) Women who did not have a birth in the past 12 months: 3,513 (1,555 now married , 1,944 unmarried)
Housing units in zip code 14526 with a mortgage: 4,024 (602
second mortgage , 78
home equity loan , 519
both second mortgage and home equity loan )
Houses without a mortgage: 142
Median monthly owner costs for units with a mortgage: $1,917
Median monthly owner costs for units without a mortgage: $782
Residents with income below the poverty level in 2022:
This zip code:
4.2%Whole state:
14.3%
Residents with income below 50% of the poverty level in 2022:
This zip code:
2.6%Whole state:
6.8%
Median number of rooms in houses and condos: Median number of rooms in apartments: Notable locations in this zip code not listed on our city pages
Click to draw/clear zip code borders Notable locations in zip code 14526: (A) , Schutts Farm (B) , Penfield Country Club (C) , Midvals Golf Club (D) , Aaron Manor Rehabilitation and Nursing Center (E) , Grande Vie Senior Living Community (F) , Penfield Community Center (G) , Penfield Public Library (H) , Town of Penfield Courthouse (I) , Penfield Town Hall (J) , Penfield Fire Company Station 3 (K) , Penfield Fire Company (L) . Display/hide their locations on the map
Shopping Centers: (1) , Parkside Commons Shopping Center (2) . Display/hide their locations on the map
Churches in zip code 14526 include: (A) , Penfield Church (B) . Display/hide their locations on the map
Cemeteries: (1) , Oakwood Cemetery (2) . Display/hide their locations on the map
Swamps: (A) . Display/hide its location on the map
Year house built (houses)
4 2020 or later734 2010 to 2019540 2000 to 20091,161 1990 to 19991,835 1980 to 19891,556 1970 to 19791,317 1960 to 1969838 1950 to 195973 1940 to 1949427 1939 or earlier
Zip code 14526 household income distribution in 2022 151 Less than $10,00071 $10,000 to $14,999241 $15,000 to $19,999204 $20,000 to $24,999131 $25,000 to $29,999210 $30,000 to $34,999145 $35,000 to $39,999268 $40,000 to $44,999154 $45,000 to $49,999330 $50,000 to $59,999883 $60,000 to $74,9991,154 $75,000 to $99,999744 $100,000 to $124,999877 $125,000 to $149,9991,127 $150,000 to $199,9991,386 $200,000 or moreEstimate of home value of owner-occupied houses/condos in 2022 in zip code 14526 42 Less than $10,00019 $15,000 to $19,99917 $20,000 to $24,99921 $30,000 to $34,99947 $80,000 to $89,99920 $90,000 to $99,999126 $100,000 to $124,999348 $125,000 to $149,999714 $150,000 to $174,999427 $175,000 to $199,9991,701 $200,000 to $249,999988 $250,000 to $299,9991,044 $300,000 to $399,999740 $400,000 to $499,999402 $500,000 to $749,99928 $750,000 to $999,999Rent paid by renters in 2022 in zip code 14526 19 $200 to $24950 $400 to $44922 $450 to $49952 $600 to $64910 $650 to $69982 $700 to $7496 $750 to $79962 $800 to $899328 $900 to $999219 $1,000 to $1,24988 $1,250 to $1,499226 $1,500 to $1,99947 $2,000 to $2,49925 $3,500 or more14 No cash rent
Median gross rent in 2022: $1,135.
Median price asked for vacant for-sale houses and condos in 2022: $312,720.
Estimated median house (or condo) value in 2022 for: White Non-Hispanic householders: $251,143Black or African American householders: $265,224American Indian or Alaska Native householders: $163,957Asian householders: $425,902Some other race householders: $187,682Two or more races householders: $227,418Hispanic or Latino householders: $201,570Estimated median house or condo value in 2022: $252,687
14526:
$252,687New York:
$400,400
Lower value quartile - upper value quartile: $200,528 - $352,539
Housing units in structures:
One, detached: 6,070One, attached: 1,131Two: 1813 or 4: 2265 to 9: 15510 to 19: 18020 to 49: 9050 or more: 349Unemployment : 4.1%
Means of transportation to work in zip code 14526 68.3% 6,569 Drove a car alone6.1% 585 Carpooled0.2% 20 Bus or trolley bus0.2% 22 Motorcycle0.1% 5 Bicycle0.9% 85 Walked1.8% 170 Other means26.0% 2,498 Worked at homeTravel time to work (commute) in zip code 14526 119 Less than 5 minutes592 5 to 9 minutes1,010 10 to 14 minutes1,574 15 to 19 minutes1,871 20 to 24 minutes1,008 25 to 29 minutes722 30 to 34 minutes134 35 to 39 minutes57 40 to 44 minutes202 45 to 59 minutes16 60 to 89 minutes52 90 or more minutes
Percentage of zip code residents living and working in this county: 93.3%
Household type by relationship:
Households: 19,424
Male householders: 3,822 (720 living alone ), Female householders: 4,313 (1,494 living alone )4,620 spouses (4,590 opposite-sex spouses ), 568 unmarried partners , (528 opposite-sex unmarried partners ), 5,422 children (5,065 natural , 64 adopted , 283 stepchildren ), 17 grandchildren , 111 brothers or sisters , 82 parents , 27 foster children , 0 other relatives , 257 non-relatives In group quarters: 328 (-1 institutionalized population )
Size of family households: 2,773 2-persons , 1,004 3-persons , 1,311 4-persons , 415 5-persons , 94 6-persons , 18 7-or-more-persons
Size of nonfamily households: 2,211 1-person , 258 2-persons , 23 4-persons
3,062 married couples with children. single-parent households (537 men , 553 women ).
93.5% of residents of 14526 zip code speak English at home. of residents speak Spanish at home (61% very well, 23% well, 4% not well, 12% not at all ).of residents speak other Indo-European language at home (74% very well, 19% well, 7% not well ).of residents speak Asian or Pacific Island language at home (61% very well, 39% well ).of residents speak other language at home (100% very well ).
Foreign born population: 1,408 (7.2%)
(67.1%
of them are naturalized citizens )
This zip code:
7.2%Whole state:
22.7%
12% Bolivia 7% France 7% Greece 7% Bhutan 4% Barbados 4% Serbia 4% China, excluding Hong Kong and Taiwan 19% Italian 17% German 14% American 9% Irish 5% English 5% European 2% Ukrainian
Year of entry for the foreign-born population
366 2010 or later 157 2000 to 2009 458 1990 to 1999 680 Before 1990
Facilities with environmental interests located in this zip code:
HARRIS HILL ES ( in PENFIELD, NY)
(National Center for Education Statistics) - STATE ID-261201060009 Organizations: PENFIELD CSD (SCHOOL DISTRICT)
COBBLES ES ( in PENFIELD, NY)
(National Center for Education Statistics) - STATE ID-261201060003 Organizations: PENFIELD CSD (SCHOOL DISTRICT)
GOODYEAR AUTO SERVICE CENTER (1663 PENFIELD RD in PENFIELD, NY)
Conditionally Exempt Small Quantity Generators, less than 100 kg/month of hazardous waste (Resource Conservation and Recovery Act (tracking hazardous waste)) - notification Organizations: THE GOODYEAR TIRE & RUBBER CO (CONTACT/OWNER)
AMERADA HESS STATION 32357 (2180 PENFIELD RD in PENFIELD, NY)
Conditionally Exempt Small Quantity Generators, less than 100 kg/month of hazardous waste (Resource Conservation and Recovery Act (tracking hazardous waste))
Housing units lacking complete plumbing facilities: 0.7%
Housing units lacking complete kitchen facilities: 3.0%
82.4% Utility gas 15.4% Electricity 0.9% Bottled, tank, or LP gas 0.7% No fuel used
Population in 1990: 16,675. Population change in the 1990s: +3,114 (+18.7%).
Place of birth for U.S.-born residents:
This state: 14,098Northeast: 1,032Midwest: 1,344South: 690West: 592
66% of the 14526 zip code residents lived in the same house 5 years ago.
Out of people who lived in different houses, 70% lived in this county.
Out of people who lived in different counties, 50% lived in New York.
93% of the 14526 zip code residents lived in the same house 1 year ago.
Out of people who lived in different houses, 56% moved from this county.
Out of people who lived in different houses, 31% moved from different county within same state.
Out of people who lived in different houses, 12% moved from different state.
Private vs. public school enrollment:
Students in private schools in grades 1 to 8 (elementary and middle school): 65
Students in private schools in grades 9 to 12 (high school): 108
Students in private undergraduate colleges: 147
Occupation by median earnings in the past 12 months ($)
113,661 Law enforcement workers including supervisors 108,979 Life, physical, and social science occupations 107,497 Architecture and engineering occupations 89,823 Computer and mathematical occupations 87,976 Business and financial operations occupations 87,525 Management occupations
Companies with federal contracts located in this zip code:
JAYNES RECONN IMAGING SYSTEMS (910 WHALEN ROAD in PENFIELD, NY; small business) in 2 contracts from 2000 to 2002
$1,159,750 with Department of Defense for Drafting, Surveying, and Mapping Instruments. Signed on 2000-09-25. Completion date: 2001-02-28.
with Department of Defense for Optoelectronic Devices and Associated Hardware. Signed on 2002-09-23. Completion date: 2002-11-14.
INTERNATIONAL INTELLECTUAL GRO (15 BREMEN CIR in PENFIELD, NY; small business)
$15,024 with Navy for ADP Software. Signed on 2006-03-31. Completion date: 2006-04-13.
HUNSINGER, JOHN & JANICE (61 BROOKTREE DR in PENFIELD, NY) in 3 contracts from 2003 to 2005
$2,444 with U.S. Army Corps of Engineers - civil program financing only for Facilities Operations Support Services. Taking place in MA. Signed on 2005-01-27. Completion date: 2005-10-10.
with Army for Facilities Operations Support Services. Taking place in MA. Signed on 2005-01-27. Completion date: 2005-10-10.
with U.S. Army Corps of Engineers - civil program financing only for Other Management Support Services. Taking place in MA. Signed on 2003-02-14. Completion date: 2003-07-12.
Top industries in this zip code by the number of employees in 2005:
Health Care and Social Assistance: Homes for the Elderly (100-249 employees: 1 establishment, 50-99 employees: 1 establishment)Health Care and Social Assistance: Residential Mental Retardation Facilities (50-99: 1, 20-49: 3, 10-19: 3, 5-9: 2, 1-4: 2)Accommodation and Food Services: Full-Service Restaurants (20-49: 5, 10-19: 2, 5-9: 3, 1-4: 3)Accommodation and Food Services: Limited-Service Restaurants (50-99: 1, 20-49: 2, 10-19: 2, 5-9: 2, 1-4: 3)Professional, Scientific, and Technical Services: Engineering Services (20-49: 3, 10-19: 1)Educational Services: Elementary and Secondary Schools (50-99: 1, 20-49: 1, 5-9: 1)Health Care and Social Assistance: Offices of Dentists (10-19: 3, 5-9: 7, 1-4: 5)Health Care and Social Assistance: Child Day Care Services (20-49: 2, 10-19: 2, 5-9: 1)
People in group quarters in 2010:
110 people in nursing facilities/skilled-nursing facilities
76 people in group homes intended for adults
People in group quarters in 2000:
160 people in other noninstitutional group quarters
150 people in nursing homes
35 people in homes for the mentally retarded
21 people in other group homes
9 people in homes for the mentally ill
4 people in religious group quarters
Fatal accident statistics in 2013:
Fatal accident count: 2Vehicles involved in fatal accidents: 2Fatal accidents caused by drunken drivers: 1Fatalities: 2Persons involved in fatal accidents: 2Pedestrians involved in fatal accidents: 0
Fatal accident statistics in 2012:
Fatal accident count: 1Vehicles involved in fatal accidents: 1Fatal accidents caused by drunken drivers: 0Fatalities: 1Persons involved in fatal accidents: 1Pedestrians involved in fatal accidents: 1
Home Mortgage Disclosure Act Aggregated Statistics For Year 2009(Based on 4 full and 6 partial tracts) A) FHA, FSA/RHS & VA B) Conventional C) Refinancings D) Home Improvement Loans E) Loans on Dwellings For 5+ Families F) Non-occupant Loans on Number Average Value Number Average Value Number Average Value Number Average Value Number Average Value Number Average Value
LOANS ORIGINATED 163 $146,149 334 $162,496 587 $139,722 87 $28,883 1 $9,664,000 11 $108,043 APPLICATIONS APPROVED, NOT ACCEPTED 6 $163,237 12 $166,652 46 $173,223 9 $16,201 0 $0 1 $89,980 APPLICATIONS DENIED 9 $173,486 12 $181,116 142 $160,035 16 $21,633 0 $0 3 $312,700 APPLICATIONS WITHDRAWN 13 $201,782 39 $192,471 106 $155,448 3 $119,777 0 $0 7 $140,571 FILES CLOSED FOR INCOMPLETENESS 4 $97,278 2 $277,650 27 $148,960 0 $0 0 $0 0 $0
Aggregated Statistics For Year 2008(Based on 4 full and 6 partial tracts) A) FHA, FSA/RHS & VA B) Conventional C) Refinancings D) Home Improvement Loans E) Loans on Dwellings For 5+ Families F) Non-occupant Loans on Number Average Value Number Average Value Number Average Value Number Average Value Number Average Value Number Average Value
LOANS ORIGINATED 120 $149,976 380 $149,920 222 $152,569 75 $24,461 6 $5,195,367 12 $106,388 APPLICATIONS APPROVED, NOT ACCEPTED 13 $190,249 61 $255,076 23 $173,940 17 $36,529 0 $0 3 $109,233 APPLICATIONS DENIED 8 $191,665 32 $156,996 115 $144,784 35 $26,219 0 $0 5 $95,884 APPLICATIONS WITHDRAWN 8 $189,835 19 $167,779 78 $156,631 11 $37,338 0 $0 0 $0 FILES CLOSED FOR INCOMPLETENESS 3 $116,927 19 $154,975 29 $134,641 1 $28,990 0 $0 0 $0
Aggregated Statistics For Year 2007(Based on 4 full and 6 partial tracts) A) FHA, FSA/RHS & VA B) Conventional C) Refinancings D) Home Improvement Loans E) Loans on Dwellings For 5+ Families F) Non-occupant Loans on G) Loans On Manufactured Number Average Value Number Average Value Number Average Value Number Average Value Number Average Value Number Average Value Number Average Value
LOANS ORIGINATED 80 $129,239 595 $141,399 317 $112,061 135 $35,302 2 $667,185 25 $123,675 0 $0 APPLICATIONS APPROVED, NOT ACCEPTED 2 $189,640 73 $146,048 69 $110,881 23 $15,682 2 $2,731,365 5 $161,864 0 $0 APPLICATIONS DENIED 11 $124,501 47 $106,088 219 $145,042 57 $73,702 0 $0 11 $90,232 3 $28,027 APPLICATIONS WITHDRAWN 5 $109,192 24 $109,480 134 $136,806 14 $110,198 0 $0 0 $0 1 $220,340 FILES CLOSED FOR INCOMPLETENESS 0 $0 25 $154,107 18 $138,898 2 $65,230 0 $0 1 $79,240 0 $0
Aggregated Statistics For Year 2006(Based on 4 full and 6 partial tracts) A) FHA, FSA/RHS & VA B) Conventional C) Refinancings D) Home Improvement Loans E) Loans on Dwellings For 5+ Families F) Non-occupant Loans on G) Loans On Manufactured Number Average Value Number Average Value Number Average Value Number Average Value Number Average Value Number Average Value Number Average Value
LOANS ORIGINATED 78 $139,000 630 $130,069 341 $101,910 130 $28,236 2 $2,446,675 39 $107,539 0 $0 APPLICATIONS APPROVED, NOT ACCEPTED 6 $131,655 35 $132,644 75 $100,438 25 $24,635 0 $0 4 $73,355 0 $0 APPLICATIONS DENIED 9 $129,206 54 $117,554 316 $135,318 85 $41,055 0 $0 17 $80,738 5 $38,860 APPLICATIONS WITHDRAWN 6 $116,632 48 $148,491 159 $129,569 18 $54,653 0 $0 3 $406,933 0 $0 FILES CLOSED FOR INCOMPLETENESS 2 $109,075 30 $135,871 56 $194,635 7 $84,579 0 $0 2 $129,705 0 $0
Aggregated Statistics For Year 2005(Based on 4 full and 6 partial tracts) A) FHA, FSA/RHS & VA B) Conventional C) Refinancings D) Home Improvement Loans E) Loans on Dwellings For 5+ Families F) Non-occupant Loans on G) Loans On Manufactured Number Average Value Number Average Value Number Average Value Number Average Value Number Average Value Number Average Value Number Average Value
LOANS ORIGINATED 60 $122,985 610 $142,604 456 $109,836 130 $38,223 4 $1,300,548 29 $109,550 0 $0 APPLICATIONS APPROVED, NOT ACCEPTED 5 $112,588 41 $145,853 78 $101,716 16 $18,134 0 $0 1 $79,240 4 $40,070 APPLICATIONS DENIED 4 $108,058 35 $156,519 254 $127,497 48 $35,454 0 $0 4 $87,010 2 $77,460 APPLICATIONS WITHDRAWN 0 $0 59 $167,882 196 $118,572 29 $108,781 0 $0 1 $107,190 2 $158,655 FILES CLOSED FOR INCOMPLETENESS 0 $0 35 $137,401 66 $160,545 2 $34,390 0 $0 2 $86,470 0 $0
Aggregated Statistics For Year 2004(Based on 4 full and 6 partial tracts) A) FHA, FSA/RHS & VA B) Conventional C) Refinancings D) Home Improvement Loans F) Non-occupant Loans on G) Loans On Manufactured Number Average Value Number Average Value Number Average Value Number Average Value Number Average Value Number Average Value
LOANS ORIGINATED 66 $124,966 696 $142,247 639 $114,190 69 $32,028 25 $97,294 2 $14,875 APPLICATIONS APPROVED, NOT ACCEPTED 3 $102,787 73 $159,520 93 $109,807 28 $37,019 3 $112,763 0 $0 APPLICATIONS DENIED 0 $0 55 $143,385 240 $123,526 61 $38,125 13 $148,053 1 $38,340 APPLICATIONS WITHDRAWN 2 $128,720 38 $151,186 205 $114,845 16 $49,286 3 $121,043 0 $0 FILES CLOSED FOR INCOMPLETENESS 0 $0 13 $135,040 90 $126,649 13 $35,358 7 $55,773 0 $0
Aggregated Statistics For Year 2003(Based on 4 full and 6 partial tracts) A) FHA, FSA/RHS & VA B) Conventional C) Refinancings D) Home Improvement Loans F) Non-occupant Loans on Number Average Value Number Average Value Number Average Value Number Average Value Number Average Value
LOANS ORIGINATED 82 $118,767 680 $137,328 1,745 $117,068 75 $15,427 37 $94,863 APPLICATIONS APPROVED, NOT ACCEPTED 2 $137,830 60 $143,549 214 $117,304 8 $34,666 5 $109,976 APPLICATIONS DENIED 9 $126,943 30 $92,605 356 $109,960 45 $26,837 6 $69,633 APPLICATIONS WITHDRAWN 6 $103,125 35 $134,777 242 $124,679 18 $36,483 6 $63,145 FILES CLOSED FOR INCOMPLETENESS 3 $96,153 12 $105,812 65 $143,889 0 $0 2 $99,160
Aggregated Statistics For Year 2002(Based on 4 full and 6 partial tracts) A) FHA, FSA/RHS & VA B) Conventional C) Refinancings D) Home Improvement Loans F) Non-occupant Loans on Number Average Value Number Average Value Number Average Value Number Average Value Number Average Value
LOANS ORIGINATED 81 $114,907 711 $128,535 1,153 $114,456 79 $25,059 16 $93,476 APPLICATIONS APPROVED, NOT ACCEPTED 4 $89,615 40 $142,131 144 $109,122 21 $23,059 4 $105,240 APPLICATIONS DENIED 1 $85,040 28 $99,705 209 $105,956 43 $13,821 6 $103,228 APPLICATIONS WITHDRAWN 2 $120,525 30 $127,667 198 $121,861 24 $36,827 5 $141,696 FILES CLOSED FOR INCOMPLETENESS 2 $137,830 14 $91,431 65 $115,353 3 $8,427 1 $372,420
Aggregated Statistics For Year 2001(Based on 4 full and 6 partial tracts) A) FHA, FSA/RHS & VA B) Conventional C) Refinancings D) Home Improvement Loans E) Loans on Dwellings For 5+ Families F) Non-occupant Loans on Number Average Value Number Average Value Number Average Value Number Average Value Number Average Value Number Average Value
LOANS ORIGINATED 97 $117,156 746 $121,289 806 $108,566 93 $15,885 4 $353,600 21 $97,602 APPLICATIONS APPROVED, NOT ACCEPTED 9 $111,907 42 $132,290 87 $104,625 22 $20,815 0 $0 2 $114,965 APPLICATIONS DENIED 3 $114,217 42 $109,821 242 $93,299 47 $14,535 0 $0 3 $43,060 APPLICATIONS WITHDRAWN 0 $0 39 $115,602 225 $106,741 18 $25,706 0 $0 6 $56,203 FILES CLOSED FOR INCOMPLETENESS 6 $102,465 5 $176,932 46 $90,842 6 $64,318 0 $0 0 $0
Aggregated Statistics For Year 2000(Based on 4 full and 6 partial tracts) A) FHA, FSA/RHS & VA B) Conventional C) Refinancings D) Home Improvement Loans E) Loans on Dwellings For 5+ Families F) Non-occupant Loans on Number Average Value Number Average Value Number Average Value Number Average Value Number Average Value Number Average Value
LOANS ORIGINATED 77 $98,677 710 $120,603 214 $81,170 128 $16,009 3 $6,349,640 12 $79,204 APPLICATIONS APPROVED, NOT ACCEPTED 3 $87,970 72 $136,831 53 $93,285 32 $23,428 1 $6,474,880 5 $50,178 APPLICATIONS DENIED 8 $102,451 45 $121,363 189 $88,598 44 $33,010 0 $0 9 $120,259 APPLICATIONS WITHDRAWN 3 $106,783 40 $135,564 72 $73,439 14 $36,499 0 $0 6 $34,983 FILES CLOSED FOR INCOMPLETENESS 0 $0 5 $198,830 20 $107,929 0 $0 0 $0 0 $0
Aggregated Statistics For Year 1999(Based on 2 full and 3 partial tracts) A) FHA, FSA/RHS & VA B) Conventional C) Refinancings D) Home Improvement Loans F) Non-occupant Loans on Number Average Value Number Average Value Number Average Value Number Average Value Number Average Value
LOANS ORIGINATED 54 $100,806 365 $138,204 298 $93,377 57 $16,874 9 $140,804 APPLICATIONS APPROVED, NOT ACCEPTED 1 $85,670 22 $170,600 53 $96,187 17 $26,826 0 $0 APPLICATIONS DENIED 4 $97,592 31 $146,381 94 $85,605 18 $27,852 11 $108,594 APPLICATIONS WITHDRAWN 4 $112,745 28 $161,732 54 $85,893 17 $71,608 2 $108,165 FILES CLOSED FOR INCOMPLETENESS 0 $0 5 $330,416 23 $94,984 0 $0 0 $0
Private Mortgage Insurance Companies Aggregated Statistics For Year 2009(Based on 4 full and 6 partial tracts) A) Conventional B) Refinancings C) Non-occupant Loans on Number Average Value Number Average Value Number Average Value
LOANS ORIGINATED 74 $185,110 49 $168,357 0 $0 APPLICATIONS APPROVED, NOT ACCEPTED 19 $243,717 7 $208,604 2 $300,455 APPLICATIONS DENIED 12 $150,830 11 $188,516 0 $0 APPLICATIONS WITHDRAWN 2 $260,130 2 $86,470 0 $0 FILES CLOSED FOR INCOMPLETENESS 0 $0 0 $0 0 $0
Aggregated Statistics For Year 2008(Based on 4 full and 6 partial tracts) A) Conventional B) Refinancings C) Non-occupant Loans on Number Average Value Number Average Value Number Average Value
LOANS ORIGINATED 133 $158,943 35 $174,017 5 $98,676 APPLICATIONS APPROVED, NOT ACCEPTED 24 $183,214 6 $254,273 3 $109,233 APPLICATIONS DENIED 5 $140,378 0 $0 0 $0 APPLICATIONS WITHDRAWN 0 $0 0 $0 0 $0 FILES CLOSED FOR INCOMPLETENESS 2 $126,755 0 $0 0 $0
Aggregated Statistics For Year 2007(Based on 4 full and 6 partial tracts) A) Conventional B) Refinancings C) Non-occupant Loans on D) Loans On Manufactured Number Average Value Number Average Value Number Average Value Number Average Value
LOANS ORIGINATED 127 $146,087 24 $176,688 5 $148,352 0 $0 APPLICATIONS APPROVED, NOT ACCEPTED 22 $178,642 9 $158,073 5 $150,896 2 $74,370 APPLICATIONS DENIED 4 $125,282 4 $126,798 0 $0 0 $0 APPLICATIONS WITHDRAWN 3 $152,200 0 $0 0 $0 0 $0 FILES CLOSED FOR INCOMPLETENESS 0 $0 0 $0 0 $0 0 $0
Aggregated Statistics For Year 2006(Based on 4 full and 6 partial tracts) A) Conventional B) Refinancings C) Non-occupant Loans on Number Average Value Number Average Value Number Average Value
LOANS ORIGINATED 89 $149,255 15 $159,823 1 $61,810 APPLICATIONS APPROVED, NOT ACCEPTED 21 $165,187 13 $138,957 0 $0 APPLICATIONS DENIED 0 $0 0 $0 0 $0 APPLICATIONS WITHDRAWN 12 $151,419 10 $162,743 0 $0 FILES CLOSED FOR INCOMPLETENESS 0 $0 0 $0 0 $0
Aggregated Statistics For Year 2005(Based on 4 full and 6 partial tracts) A) Conventional B) Refinancings C) Non-occupant Loans on Number Average Value Number Average Value Number Average Value
LOANS ORIGINATED 128 $150,543 31 $128,891 4 $122,125 APPLICATIONS APPROVED, NOT ACCEPTED 37 $146,987 9 $112,982 2 $86,470 APPLICATIONS DENIED 2 $104,120 0 $0 0 $0 APPLICATIONS WITHDRAWN 5 $150,128 6 $123,242 0 $0 FILES CLOSED FOR INCOMPLETENESS 0 $0 0 $0 0 $0
Aggregated Statistics For Year 2004(Based on 4 full and 6 partial tracts) A) Conventional B) Refinancings C) Non-occupant Loans on D) Loans On Manufactured Number Average Value Number Average Value Number Average Value Number Average Value
LOANS ORIGINATED 126 $134,545 45 $132,801 9 $95,799 0 $0 APPLICATIONS APPROVED, NOT ACCEPTED 30 $137,206 25 $180,882 0 $0 2 $93,345 APPLICATIONS DENIED 1 $81,370 1 $83,110 0 $0 0 $0 APPLICATIONS WITHDRAWN 4 $122,410 7 $112,793 0 $0 2 $127,740 FILES CLOSED FOR INCOMPLETENESS 0 $0 0 $0 0 $0 0 $0
Aggregated Statistics For Year 2003(Based on 4 full and 6 partial tracts) A) Conventional B) Refinancings C) Non-occupant Loans on Number Average Value Number Average Value Number Average Value
LOANS ORIGINATED 154 $144,180 222 $141,773 5 $128,752 APPLICATIONS APPROVED, NOT ACCEPTED 24 $155,192 44 $130,366 6 $89,863 APPLICATIONS DENIED 1 $79,800 1 $145,530 0 $0 APPLICATIONS WITHDRAWN 2 $104,155 14 $116,059 0 $0 FILES CLOSED FOR INCOMPLETENESS 0 $0 0 $0 0 $0
Aggregated Statistics For Year 2002(Based on 4 full and 6 partial tracts) A) Conventional B) Refinancings C) Non-occupant Loans on Number Average Value Number Average Value Number Average Value
LOANS ORIGINATED 179 $127,843 132 $126,711 4 $76,330 APPLICATIONS APPROVED, NOT ACCEPTED 35 $140,077 35 $129,890 2 $87,260 APPLICATIONS DENIED 2 $157,665 2 $118,990 0 $0 APPLICATIONS WITHDRAWN 4 $128,455 9 $99,430 0 $0 FILES CLOSED FOR INCOMPLETENESS 0 $0 0 $0 0 $0
Aggregated Statistics For Year 2001(Based on 4 full and 6 partial tracts) A) Conventional B) Refinancings C) Non-occupant Loans on Number Average Value Number Average Value Number Average Value
LOANS ORIGINATED 177 $133,410 97 $143,050 0 $0 APPLICATIONS APPROVED, NOT ACCEPTED 25 $149,466 19 $142,881 1 $41,560 APPLICATIONS DENIED 4 $165,102 0 $0 0 $0 APPLICATIONS WITHDRAWN 2 $164,095 0 $0 0 $0 FILES CLOSED FOR INCOMPLETENESS 0 $0 0 $0 0 $0
Aggregated Statistics For Year 2000(Based on 4 full and 6 partial tracts) A) Conventional B) Refinancings C) Non-occupant Loans on Number Average Value Number Average Value Number Average Value
LOANS ORIGINATED 186 $120,043 7 $130,739 1 $41,560 APPLICATIONS APPROVED, NOT ACCEPTED 50 $141,419 2 $113,605 0 $0 APPLICATIONS DENIED 10 $110,794 6 $183,840 0 $0 APPLICATIONS WITHDRAWN 5 $233,364 0 $0 0 $0 FILES CLOSED FOR INCOMPLETENESS 2 $75,660 0 $0 0 $0
Aggregated Statistics For Year 1999(Based on 2 full and 3 partial tracts) A) Conventional B) Refinancings Number Average Value Number Average Value
LOANS ORIGINATED 122 $129,610 38 $129,352 APPLICATIONS APPROVED, NOT ACCEPTED 15 $140,716 10 $111,805 APPLICATIONS DENIED 3 $114,843 1 $102,440 APPLICATIONS WITHDRAWN 1 $80,190 1 $222,750 FILES CLOSED FOR INCOMPLETENESS 1 $85,370 0 $0
2002 - 2018 National Fire Incident Reporting System (NFIRS) incidents See full 2006 National Fire Incident Reporting System statistics for zip code 14526, New York
Most common first names in zip code 14526 among deceased individuals Name Count Lived (average)
Mary 110 81.4 years Robert 70 72.7 years Joseph 69 78.1 years John 69 75.8 years William 68 75.1 years Helen 63 85.3 years Charles 60 79.0 years Ruth 56 83.5 years Margaret 55 82.8 years James 53 72.5 years
Most common last names in zip code 14526 among deceased individuals Last name Count Lived (average)
Smith 29 81.2 years Miller 23 79.6 years Brown 16 81.3 years Jones 12 78.3 years Davis 11 65.4 years Clark 11 79.2 years Anderson 10 77.4 years Taylor 10 84.2 years Young 10 83.9 years Cook 9 78.4 years
Businesses in zip code 14526
Name Count Name Count
7-Eleven 1 Nike 2 AT&T 1 Rite Aid 1 CVS 1 Starbucks 1 Dunkin Donuts 2 Subway 1 FedEx 3 True Value 1 GNC 1 UPS 1 H&R Block 1 YMCA 1 McDonald's 1
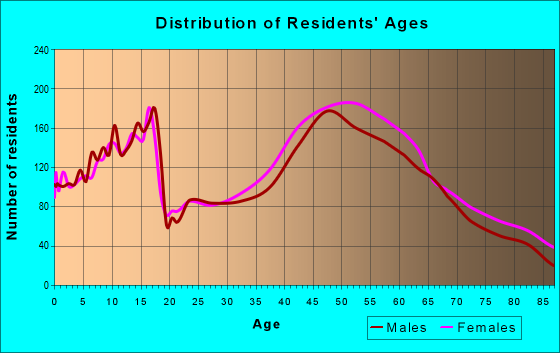
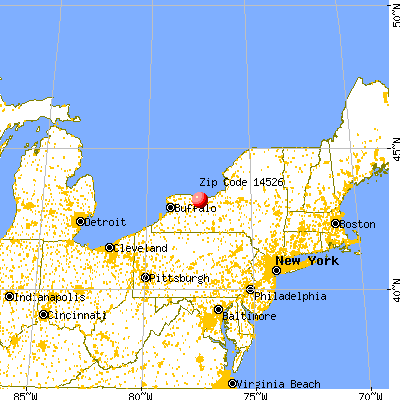


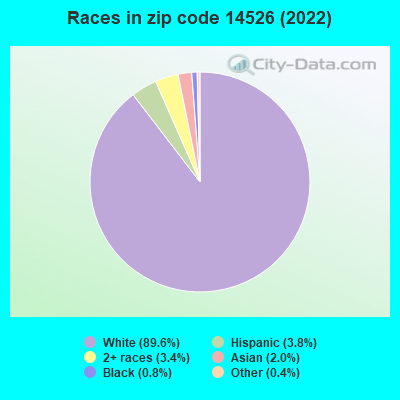


+$900
-$2,666
 Nearest zip codes: 14445, 14625, 14450, 14580, 14610, 14609.
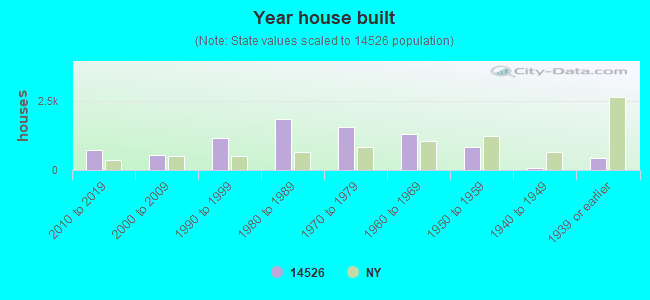
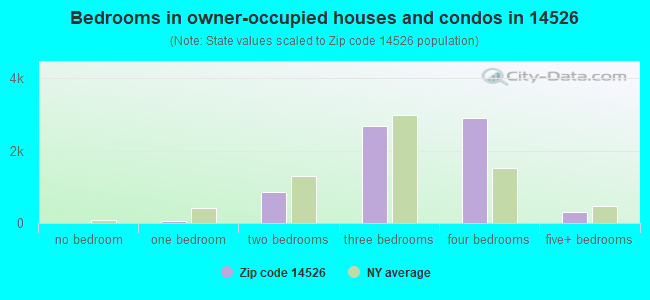
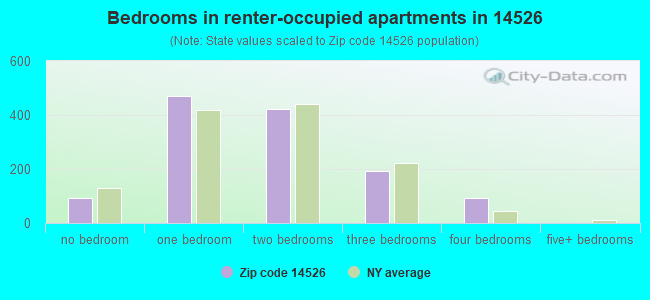
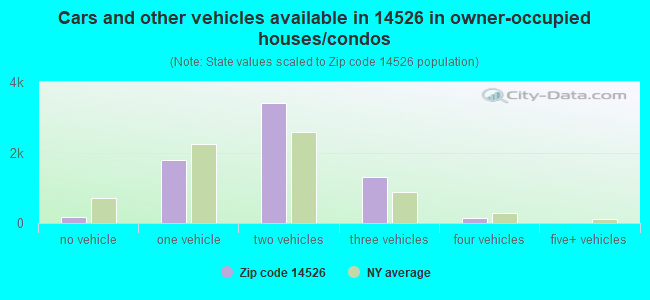
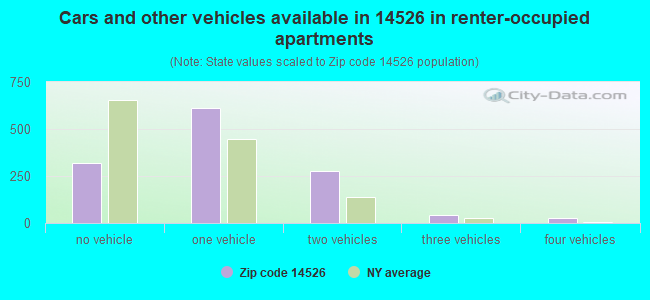


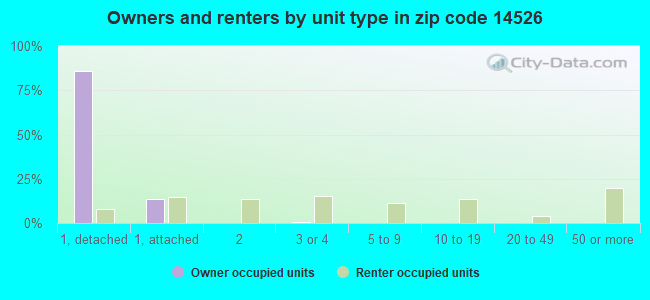
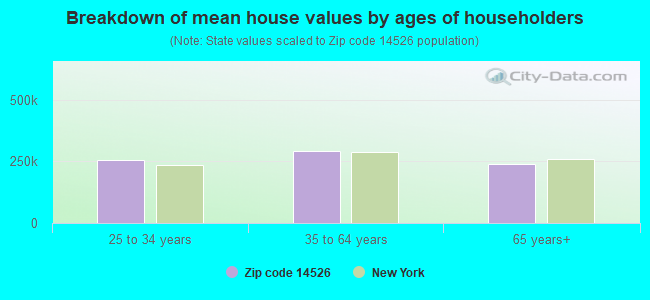


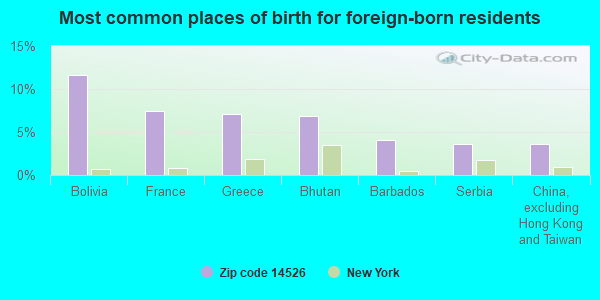
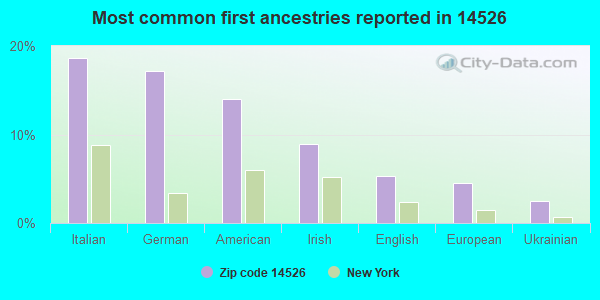
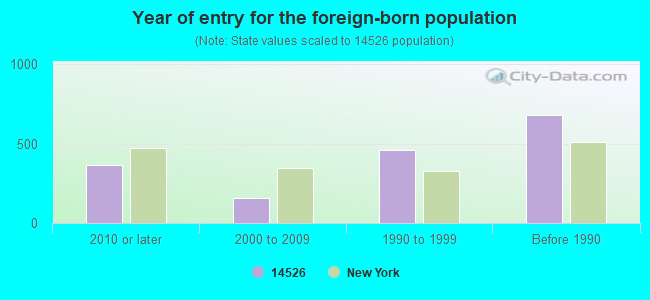
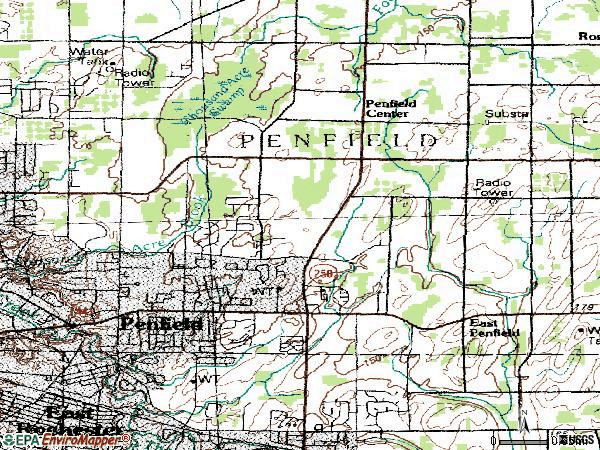

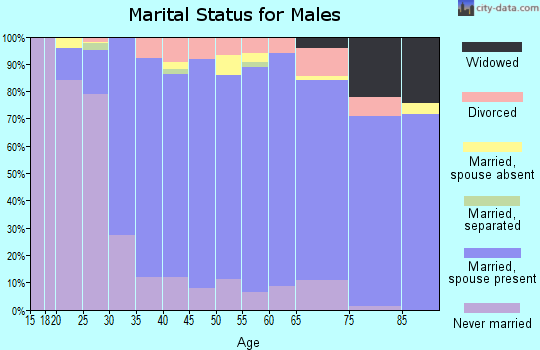
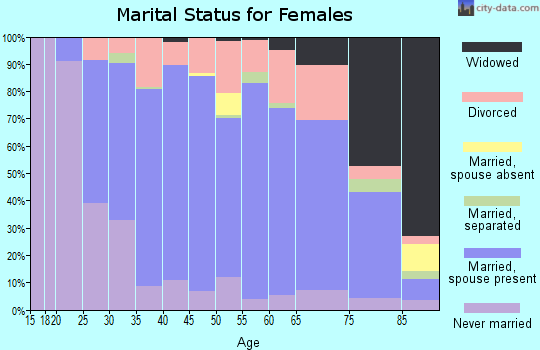
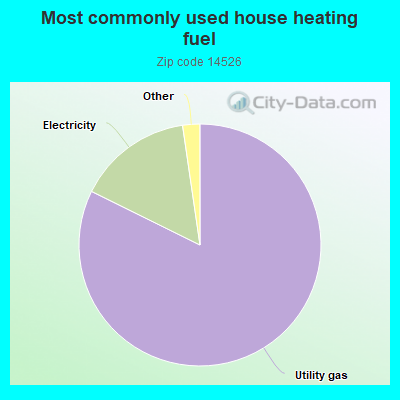
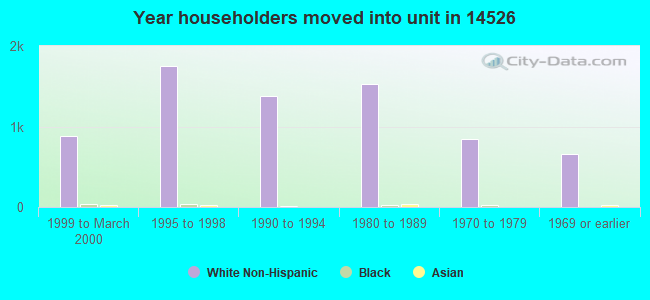
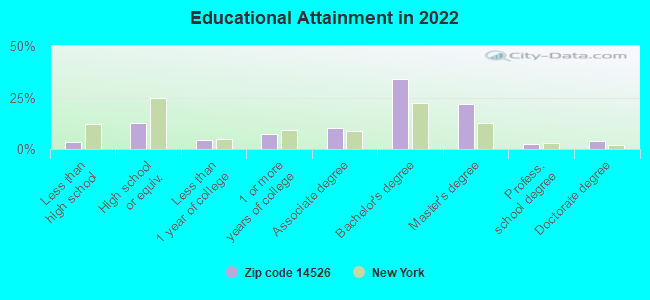
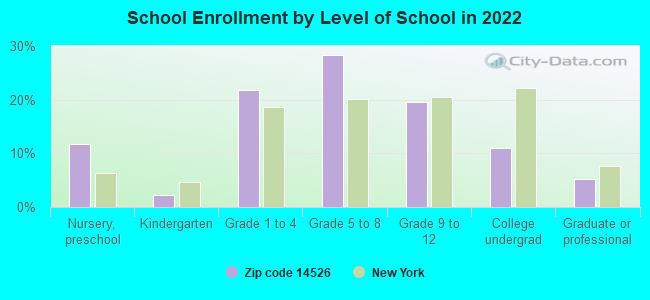
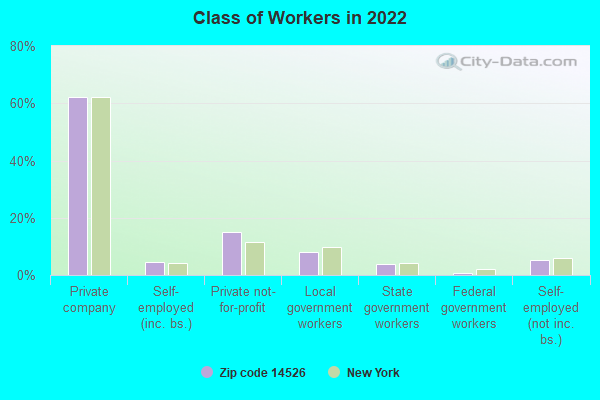
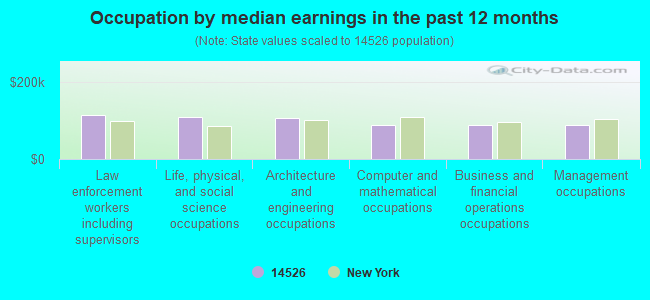
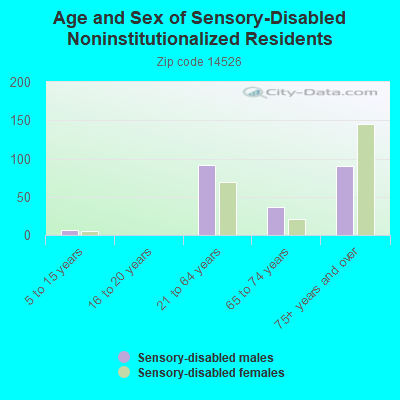
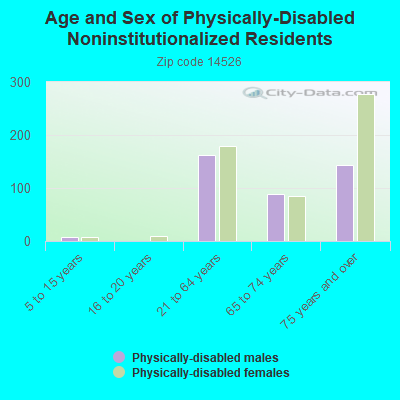
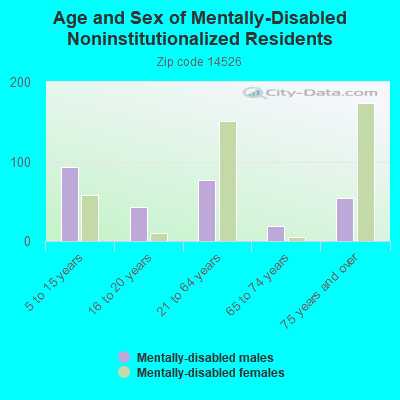
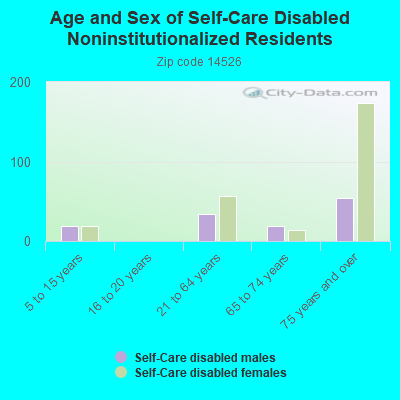
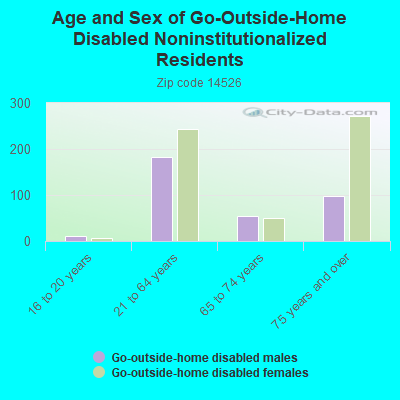
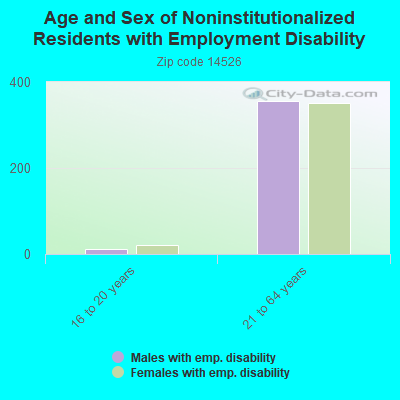
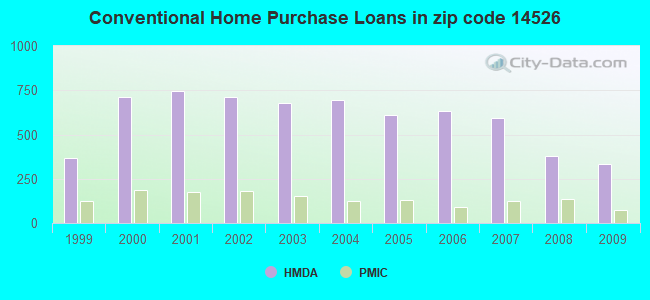
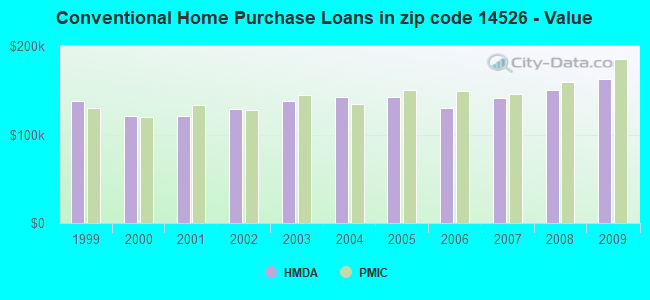
 According to the data from the years 2002 - 2018 the average number of fire incidents per year is 40. The highest number of reported fires - 84 took place in 2018, and the least - 7 in 2009. The data has a rising trend.
 When looking into fire subcategories, the most reports belonged to: Structure Fires (47.3%), and Outside Fires (39.1%).