Estimated zip code population in 2022: 53,654 Zip code population in 2010: 50,587 Zip code population in 2000: 43,824
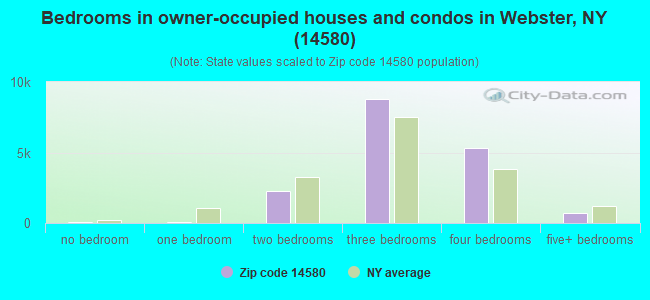
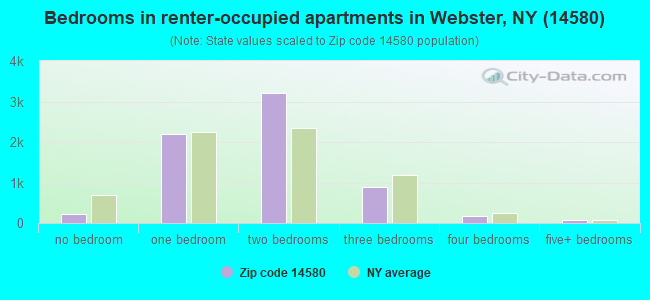
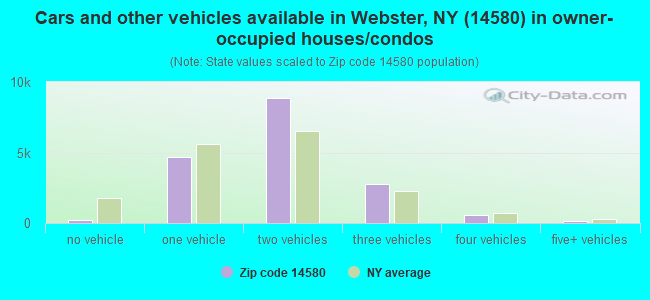
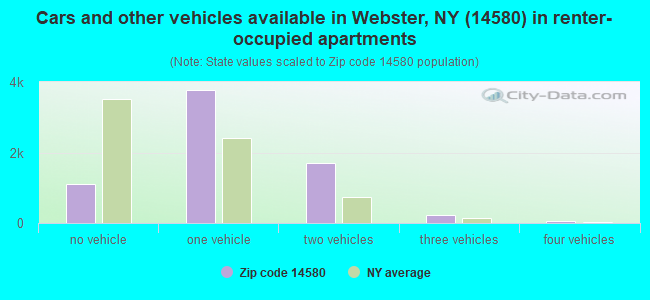
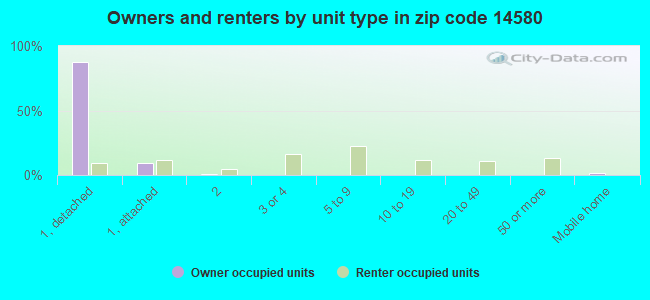
Houses and condos: 24,633 Renter-occupied apartments: 6,848
% of renters here:
28%
State:
46%
March 2022 cost of living index in zip code 14580: 103.3 (near average, U.S. average is 100)
Land area: 42.6 sq. mi. Water area: 2.1 sq. mi.
Population density: 1,260 people per square mile
(low).
OSM Map
General Map
Google Map
MSN Map
OSM Map
General Map
Google Map
MSN Map
OSM Map
General Map
Google Map
MSN Map
OSM Map
General Map
Google Map
MSN Map
Please wait while loading the map...
Real estate property taxes paid for housing units in 2022:
This zip code:
2.5% ($6,320)
New York:
1.5% ($6,180)
Median real estate property taxes paid for housing units with mortgages in 2022: $6,596 (2.6%) Median real estate property taxes paid for housing units with no mortgage in 2022: $5,839 (2.4%)
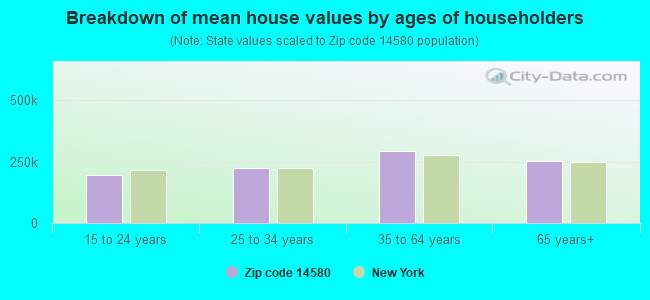
Estimated median house/condo value in 2022: $248,830
14580:
$248,830
New York:
$400,400
According to our research of New York and other state lists, there were 6 registered sex offenders living in 14580 zip code as of April 27, 2024. The ratio of all residents to sex offenders in zip code 14580 is 8,779 to 1. The ratio of registered sex offenders to all residents in this zip code is much lower than the state average.
Median resident age:
This zip code:
46.8 years
New York median age:
40.0 years
Average household size:
This zip code:
2.2 people
New York:
2.5 people
Averages for the 2020 tax year for zip code 14580, filed in 2021:
Average Adjusted Gross Income (AGI) in 2020: $84,269 (Individual Income Tax Returns)
Here:
$84,269
State:
$90,930
Salary/wage: $70,832 (reported on 77.1% of returns)
Here:
$70,832
State:
$72,104
(% of AGI for various income ranges: 1005.2% for AGIs below $25k, 3263.5% for AGIs $25k-50k, 5846.9% for AGIs $50k-75k, 8444.4% for AGIs $75k-100k, 16652.8% for AGIs $100k-200k, 72420.3% for AGIs over 200k)
Taxable interest for individuals: $1,236 (reported on 55.0% of returns)
This zip code:
$1,236
New York:
$3,075
(% of AGI for various income ranges: 27.0% for AGIs below $25k, 39.8% for AGIs $25k-50k, 70.3% for AGIs $50k-75k, 97.4% for AGIs $75k-100k, 161.7% for AGIs $100k-200k, 1093.4% for AGIs over 200k)
Ordinary dividends: $5,391 (reported on 32.6% of returns)
Here:
$5,391
State:
$11,095
(% of AGI for various income ranges: 56.7% for AGIs below $25k, 75.2% for AGIs $25k-50k, 144.0% for AGIs $50k-75k, 208.7% for AGIs $75k-100k, 407.4% for AGIs $100k-200k, 3531.0% for AGIs over 200k)
Net capital gain/loss in AGI: +$13,428 (reported on 28.3% of returns)
Here:
+$13,428
State:
+$44,925
(% of AGI for various income ranges: 17.7% for AGIs below $25k, 58.7% for AGIs $25k-50k, 141.4% for AGIs $50k-75k, 256.1% for AGIs $75k-100k, 647.5% for AGIs $100k-200k, 12109.8% for AGIs over 200k)
Profit/loss from business: +$18,421 (reported on 13.2% of returns)
Here:
+$18,421
State:
+$14,940
(% of AGI for various income ranges: 76.4% for AGIs below $25k, 150.4% for AGIs $25k-50k, 203.2% for AGIs $50k-75k, 325.8% for AGIs $75k-100k, 588.5% for AGIs $100k-200k, 4274.1% for AGIs over 200k)
Taxable individual retirement arrangement distribution: $24,434 (reported on 17.7% of returns)
14580:
$24,434
New York:
$19,609
(% of AGI for various income ranges: 134.7% for AGIs below $25k, 289.6% for AGIs $25k-50k, 564.7% for AGIs $50k-75k, 835.1% for AGIs $75k-100k, 1444.1% for AGIs $100k-200k, 3287.4% for AGIs over 200k)
Self-employed (Keogh) retirement plans: $23,773 (reported on 1.0% of returns)
14580:
$23,773
New York:
$32,497
(% of AGI for various income ranges: 5.3% for AGIs $25k-50k, 13.5% for AGIs $75k-100k, 47.9% for AGIs $100k-200k, 805.4% for AGIs over 200k)
Total itemized deductions: $29,984 (reported on 8.8% of returns)
Here:
$29,984
State:
$39,326
(% of AGI for various income ranges: 82.8% for AGIs below $25k, 164.1% for AGIs $25k-50k, 356.3% for AGIs $50k-75k, 477.0% for AGIs $75k-100k, 634.7% for AGIs $100k-200k, 3578.2% for AGIs over 200k)
Charity contributions: $8,713 (reported on 7.2% of returns)
Here:
$8,713
State:
$15,420
(% of AGI for various income ranges: 5.7% for AGIs below $25k, 16.4% for AGIs $25k-50k, 43.6% for AGIs $50k-75k, 76.1% for AGIs $75k-100k, 130.3% for AGIs $100k-200k, 1555.1% for AGIs over 200k)
Taxes paid: $8,695 (reported on 8.8% of returns)
14580:
$8,695
State:
$9,183
(% of AGI for various income ranges: 16.2% for AGIs below $25k, 43.5% for AGIs $25k-50k, 122.3% for AGIs $50k-75k, 174.3% for AGIs $75k-100k, 201.9% for AGIs $100k-200k, 795.9% for AGIs over 200k)
Earned income credit: $1,785 (reported on 7.0% of returns)
Here:
$1,785
State:
$2,138
(% of AGI for various income ranges: 39.2% for AGIs below $25k, 36.7% for AGIs $25k-50k, 0.6% for AGIs $50k-75k)
Percentage of individuals using paid preparers for their 2020 taxes: 95.2%
Here:
95%
State:
95%
(% for various income ranges: 94.2% for AGIs below $25k, 95.4% for AGIs $25k-50k, 95.6% for AGIs $50k-75k, 94.8% for AGIs $75k-100k, 95.9% for AGIs $100k-200k, 96.5% for AGIs over 200k)
Averages for the 2012 tax year for zip code 14580, filed in 2013:
Average Adjusted Gross Income (AGI) in 2012: $71,389 (Individual Income Tax Returns)
Here:
$71,389
State:
$77,088
Salary/wage: $60,278 (reported on 80.7% of returns)
Here:
$60,278
State:
$60,593
(% of AGI for various income ranges: 67.7% for AGIs below $25k, 69.8% for AGIs $25k-50k, 69.2% for AGIs $50k-75k, 71.0% for AGIs $75k-100k, 78.0% for AGIs $100k-200k, 52.3% for AGIs over 200k)
Taxable interest for individuals: $1,031 (reported on 56.6% of returns)
This zip code:
$1,031
New York:
$3,125
(% of AGI for various income ranges: 1.7% for AGIs below $25k, 0.9% for AGIs $25k-50k, 0.9% for AGIs $50k-75k, 0.7% for AGIs $75k-100k, 0.6% for AGIs $100k-200k, 0.9% for AGIs over 200k)
Ordinary dividends: $4,135 (reported on 33.9% of returns)
Here:
$4,135
State:
$10,299
(% of AGI for various income ranges: 2.9% for AGIs below $25k, 1.9% for AGIs $25k-50k, 1.7% for AGIs $50k-75k, 1.5% for AGIs $75k-100k, 1.4% for AGIs $100k-200k, 3.0% for AGIs over 200k)
Net capital gain/loss in AGI: +$9,514 (reported on 25.9% of returns)
Here:
+$9,514
State:
+$42,474
(% of AGI for various income ranges: 0.2% for AGIs $25k-50k, 0.5% for AGIs $50k-75k, 0.8% for AGIs $75k-100k, 1.0% for AGIs $100k-200k, 11.7% for AGIs over 200k)
Profit/loss from business: +$17,889 (reported on 12.9% of returns)
Here:
+$17,889
State:
+$16,168
(% of AGI for various income ranges: 6.4% for AGIs below $25k, 3.0% for AGIs $25k-50k, 2.2% for AGIs $50k-75k, 1.8% for AGIs $75k-100k, 2.8% for AGIs $100k-200k, 4.7% for AGIs over 200k)
Taxable individual retirement arrangement distribution: $17,843 (reported on 17.6% of returns)
14580:
$17,843
New York:
$17,621
(% of AGI for various income ranges: 8.1% for AGIs below $25k, 6.3% for AGIs $25k-50k, 6.1% for AGIs $50k-75k, 5.7% for AGIs $75k-100k, 3.9% for AGIs $100k-200k, 2.1% for AGIs over 200k)
Self-employment retirement plans: $19,376 (reported on 1.1% of returns)
14580:
$19,376
New York:
$27,330
(% of AGI for various income ranges: 0.2% for AGIs $25k-50k, 0.3% for AGIs $100k-200k, 0.7% for AGIs over 200k)
Total itemized deductions: $23,890 (20% of AGI, reported on 45.5% of returns)
Here:
$23,890
State:
$34,985
Here:
19.8% of AGI
State:
21.3% of AGI
(% of AGI for various income ranges: 13.0% for AGIs below $25k, 13.0% for AGIs $25k-50k, 14.6% for AGIs $50k-75k, 16.1% for AGIs $75k-100k, 17.1% for AGIs $100k-200k, 13.9% for AGIs over 200k)
Charity contributions: $3,115 (reported on 40.7% of returns)
Here:
$3,115
State:
$5,572
(% of AGI for various income ranges: 0.8% for AGIs below $25k, 1.2% for AGIs $25k-50k, 1.6% for AGIs $50k-75k, 1.7% for AGIs $75k-100k, 1.9% for AGIs $100k-200k, 2.2% for AGIs over 200k)
Taxes paid: $13,007 (reported on 45.3% of returns)
14580:
$13,007
State:
$18,656
(% of AGI for various income ranges: 4.1% for AGIs below $25k, 5.2% for AGIs $25k-50k, 6.8% for AGIs $50k-75k, 8.3% for AGIs $75k-100k, 9.8% for AGIs $100k-200k, 8.9% for AGIs over 200k)
Earned income credit: $1,852 (reported on 8.1% of returns)
Here:
$1,852
State:
$2,230
(% of AGI for various income ranges: 3.1% for AGIs below $25k, 0.6% for AGIs $25k-50k)
Percentage of individuals using paid preparers for their 2012 taxes: 53.1%
Here:
53%
State:
66%
(% for various income ranges: 45.0% for AGIs below $25k, 52.4% for AGIs $25k-50k, 57.3% for AGIs $50k-75k, 58.7% for AGIs $75k-100k, 56.7% for AGIs $100k-200k, 72.7% for AGIs over 200k)
Averages for the 2004 tax year for zip code 14580, filed in 2005:
Average Adjusted Gross Income (AGI) in 2004: $57,473 (Individual Income Tax Returns)
Here:
$57,473
State:
$59,519
Salary/wage: $53,095 (reported on 82.8% of returns)
Here:
$53,095
State:
$50,673
(% of AGI for various income ranges: 149.4% for AGIs below $10k, 64.9% for AGIs $10k-25k, 72.7% for AGIs $25k-50k, 76.3% for AGIs $50k-75k, 81.6% for AGIs $75k-100k, 75.5% for AGIs over 100k)
Taxable interest for individuals: $1,199 (reported on 70.1% of returns)
This zip code:
$1,199
New York:
$2,377
(% of AGI for various income ranges: 10.4% for AGIs below $10k, 3.4% for AGIs $10k-25k, 1.8% for AGIs $25k-50k, 1.3% for AGIs $50k-75k, 0.9% for AGIs $75k-100k, 1.3% for AGIs over 100k)
Taxable dividends: $2,168 (reported on 43.8% of returns)
Here:
$2,168
State:
$5,394
(% of AGI for various income ranges: 9.9% for AGIs below $10k, 3.1% for AGIs $10k-25k, 1.6% for AGIs $25k-50k, 1.2% for AGIs $50k-75k, 1.1% for AGIs $75k-100k, 1.7% for AGIs over 100k)
Net capital gain/loss: +$3,548 (reported on 32.2% of returns)
Here:
+$3,548
State:
+$23,581
(% of AGI for various income ranges: -1.1% for AGIs below $10k, 0.4% for AGIs $10k-25k, 0.5% for AGIs $25k-50k, 0.8% for AGIs $50k-75k, 0.9% for AGIs $75k-100k, 3.6% for AGIs over 100k)
Profit/loss from business: +$13,951 (reported on 13.7% of returns)
Here:
+$13,951
State:
+$13,809
(% of AGI for various income ranges: 3.2% for AGIs below $10k, 4.1% for AGIs $10k-25k, 2.6% for AGIs $25k-50k, 2.3% for AGIs $50k-75k, 1.8% for AGIs $75k-100k, 4.5% for AGIs over 100k)
IRA payment deduction: $3,020 (reported on 3.0% of returns)
14580:
$3,020
New York:
$3,115
(% of AGI for various income ranges: 0.4% for AGIs below $10k, 0.3% for AGIs $10k-25k, 0.3% for AGIs $25k-50k, 0.2% for AGIs $50k-75k, 0.1% for AGIs $75k-100k, 0.1% for AGIs over 100k)
Self-employed pension: $13,227 (reported on 1.3% of returns)
Here:
$13,227
New York:
$19,016
(% of AGI for various income ranges: 0.1% for AGIs $10k-25k, 0.1% for AGIs $25k-50k, 0.1% for AGIs $50k-75k, 0.1% for AGIs $75k-100k, 0.5% for AGIs over 100k)
Total itemized deductions: $19,617 (21% of AGI, reported on 49.2% of returns)
Here:
$19,617
State:
$25,864
Here:
21.1% of AGI
State:
21.9% of AGI
(% of AGI for various income ranges: 22.9% for AGIs below $10k, 13.6% for AGIs $10k-25k, 14.6% for AGIs $25k-50k, 17.7% for AGIs $50k-75k, 18.5% for AGIs $75k-100k, 16.6% for AGIs over 100k)
Charity contributions deductions: $2,739 (3% of AGI, reported on 46.2% of returns)
Here:
$2,739
State:
$4,439
Here:
2.9% of AGI
State:
3.6% of AGI
(% of AGI for various income ranges: 1.2% for AGIs below $10k, 1.3% for AGIs $10k-25k, 1.6% for AGIs $25k-50k, 2.0% for AGIs $50k-75k, 2.3% for AGIs $75k-100k, 2.5% for AGIs over 100k)
Total tax: $8,818 (reported on 80.5% of returns)
14580:
$8,818
State:
$11,730
(% of AGI for various income ranges: 4.3% for AGIs below $10k, 4.4% for AGIs $10k-25k, 7.3% for AGIs $25k-50k, 8.7% for AGIs $50k-75k, 9.7% for AGIs $75k-100k, 17.4% for AGIs over 100k)
Earned income credit: $1,398 (reported on 6.4% of returns)
Here:
$1,398
State:
$1,757
Percentage of individuals using paid preparers for their 2004 taxes: 56.4%
Here:
56%
State:
67%
(% for various income ranges: 46.9% for AGIs below $10k, 58.0% for AGIs $10k-25k, 59.4% for AGIs $25k-50k, 59.3% for AGIs $50k-75k, 57.7% for AGIs $75k-100k, 58.6% for AGIs over 100k)
Likely homosexual households (counted as self-reported same-sex unmarried-partner households)
Lesbian couples: 0.2% of all households
Gay men: 0.1% of all households
Household received Food Stamps/SNAP in the past 12 months: 1,727 Household did not receive Food Stamps/SNAP in the past 12 months: 22,142
Women who had a birth in the past 12 months: 470 (451 now married, 12 unmarried) Women who did not have a birth in the past 12 months: 10,473 (4,903 now married, 5,517 unmarried)
Housing units in zip code 14580 with a mortgage: 10,662 (1,757 second mortgage, 8 home equity loan, 1,691 both second mortgage and home equity loan) Houses without a mortgage: 708
Median monthly owner costs for units with a mortgage: $1,820 Median monthly owner costs for units without a mortgage: $824
Residents with income below the poverty level in 2022:
This zip code:
5.5%
Whole state:
14.3%
Residents with income below 50% of the poverty level in 2022:
This zip code:
3.4%
Whole state:
6.8%
Median number of rooms in houses and condos:
Here:
6.9
State:
6.3
Median number of rooms in apartments:
Here:
4.0
State:
3.8
Notable locations in this zip code not listed on our city pages
Notable locations in zip code 14580: Bounty Marina (A), Creekedge Farm (B), Webster Woods Business Park (C), Spring Pines Office Park (D), Webster Golf Course (E), Mayer's Marina (F), Webster Village Hall (G), Castle Pointe at Baywinde (H), Hill Haven Nursing Home (I), Maplewood Nursing Home (J), Sage Harbor at Baywinde (K), Webster Community Center (L), Webster Public Library (M), Webster Museum (N), Town of Webster Courthouse (O), Webster Town Hall (P), Webster Village Hall (Q), Webster Fire Department (R). Display/hide their locations on the map
Shopping Centers: Webster Square Shopping Center (1), Webster Plaza Shopping Center (2), Bay Towne Plaza Shopping Center (3), Bay Centre Plaza Shopping Center (4). Display/hide their locations on the map
Churches in zip code 14580 include: Saint Andrews Church (A), Church of the Holy Spirit (B), Saint Pauls Church (C), Holy Trinity Roman Catholic Church (D), First Presbyterian Church (E), First Baptist Church (F), First Methodist Church (G). Display/hide their locations on the map
Cemeteries: Webster Rural Cemetery (1), Union Cemetery (2), Harris Road Cemetery (3), Union Hill Cemetery (4), West Webster Cemetery (5), Holy Trinity Cemetery (6). Display/hide their locations on the map
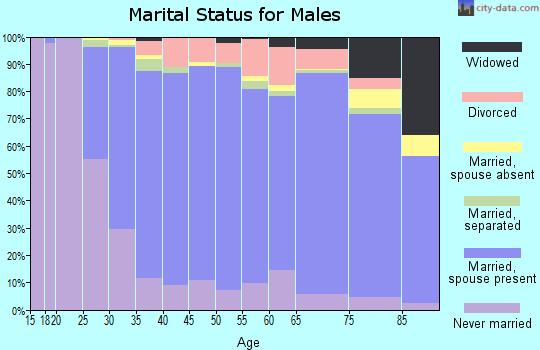
7,735 married couples with children.
2,375 single-parent households (718 men, 1,657 women).
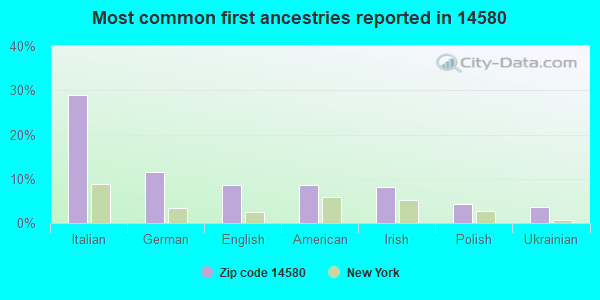
90.8% of residents of 14580 zip code speak English at home.
1.6% of residents speak Spanish at home (63% very well, 23% well, 10% not well, 3% not at all).
5.8% of residents speak other Indo-European language at home (65% very well, 24% well, 9% not well, 2% not at all).
1.5% of residents speak Asian or Pacific Island language at home (54% very well, 29% well, 18% not well).
0.4% of residents speak other language at home (50% very well, 24% well, 14% not well, 12% not at all).
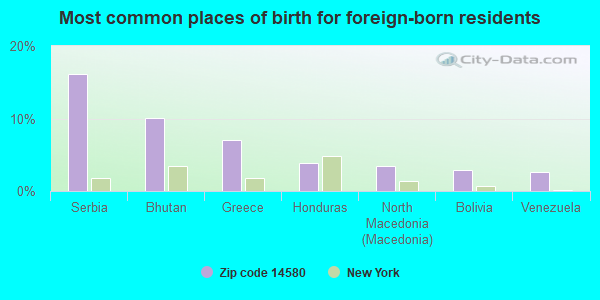
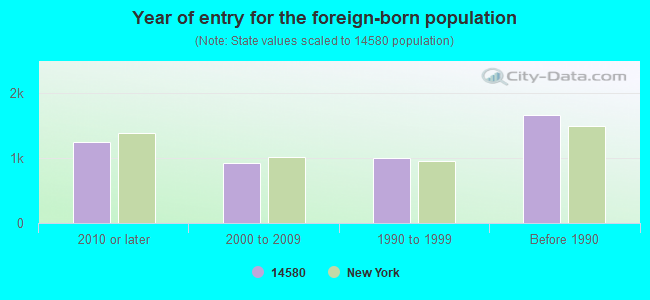
Foreign born population: 4,251 (7.9%) (71.8% of them are naturalized citizens)
Facilities with environmental interests located in this zip code:
GRIFFIN MFG CO (1656 RIDGE RD E in WEBSTER, NY)
STATE MASTER (New York facility tracking) - AIR PROGRAM (Resource Conservation and Recovery Act (tracking hazardous waste)) Business SIC classification: HAND AND EDGE TOOLS, EXCEPT MACHINE TOOLS AND HANDSAWS Business NAICS classification: HAND AND EDGE TOOL MANUFACTURING. Organizations: GRIFFIN MFG CO INC (LEGALLY RESPONSIBLE PARTY)
HERITAGE CHRISTIAN HOME INC ( in WEBSTER, NY)
(National Center for Education Statistics) - STATE ID-261901890111 Organizations: WEBSTER CSD (SCHOOL DISTRICT)
CUMBERLAND FARMS #3211 (58 W MAIN ST in WEBSTER, NY)
(Resource Conservation and Recovery Act (tracking hazardous waste))
CUMBERLAND FARMS 3212 (824 RIDGE RD & 5 MI in WEBSTER, NY)
(Resource Conservation and Recovery Act (tracking hazardous waste))
A B J BODY SHOP INC (941 RIDGE RD in WEBSTER, NY)
Small Quantity Generators, between 100 kg and 1000 kg of hazardous waste/month (Resource Conservation and Recovery Act (tracking hazardous waste)) - notification Organizations: ABJ BODY SHOP INC (CONTACT/OWNER)
GREASE N GO (1956 EMPIRE BLVD in WEBSTER, NY)
Conditionally Exempt Small Quantity Generators, less than 100 kg/month of hazardous waste (Resource Conservation and Recovery Act (tracking hazardous waste)) - notification Organizations: DURAND ENTERPRISES INC (CONTACT/OWNER)
HILL HAVEN VIAHEALTH (1550 EMPIRE BOULEVARD in WEBSTER, NY)
ENFORCEMENT/COMPLIANCE ACTIVITY (Integrated Compliance Information System)
Housing units lacking complete plumbing facilities: 0.3% Housing units lacking complete kitchen facilities: 0.7%
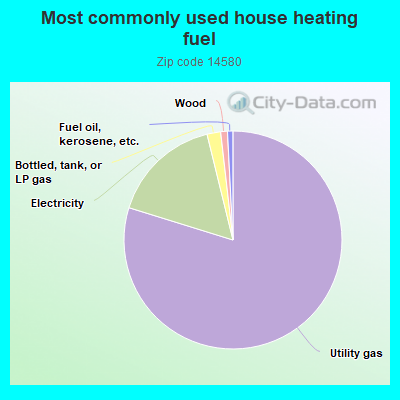
79.4%Utility gas
16.3%Electricity
2.0%Bottled, tank, or LP gas
1.0%Wood
0.8%Fuel oil, kerosene, etc.
Population in 1990: 35,072. Population change in the 1990s: +8,752 (+25.0%).
Place of birth for U.S.-born residents:
This state: 41,739
Northeast: 2,440
Midwest: 1,556
South: 1,708
West: 1,277
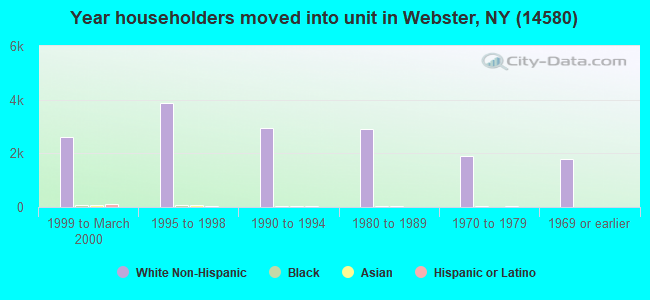
62% of the 14580 zip code residents lived in the same house 5 years ago. Out of people who lived in different houses, 76% lived in this county. Out of people who lived in different counties, 50% lived in New York.
90% of the 14580 zip code residents lived in the same house 1 year ago. Out of people who lived in different houses, 74% moved from this county. Out of people who lived in different houses, 11% moved from different county within same state. Out of people who lived in different houses, 8% moved from different state. Out of people who lived in different houses, 6% moved from abroad.
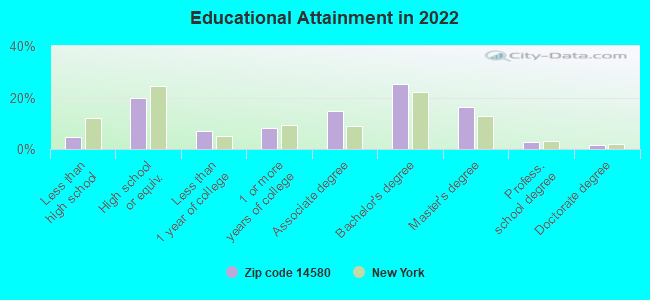
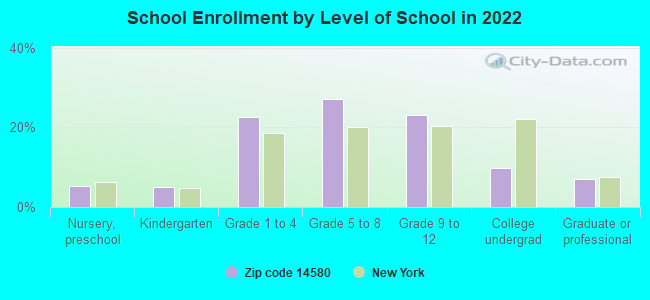
Private vs. public school enrollment:
Students in private schools in grades 1 to 8 (elementary and middle school): 577
Here:
10.8%
New York:
15.6%
Students in private schools in grades 9 to 12 (high school): 364
Here:
14.8%
New York:
15.0%
Students in private undergraduate colleges: 266
Here:
25.5%
New York:
39.2%
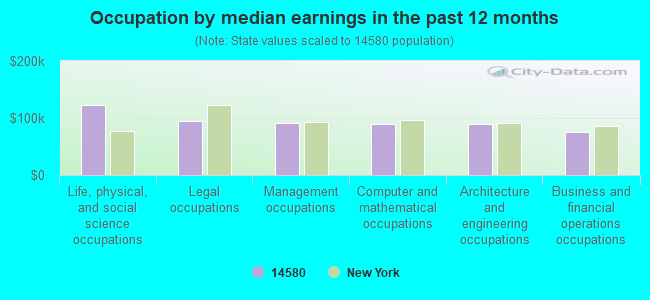
Occupation by median earnings in the past 12 months ($)
123,586Life, physical, and social science occupations
95,418Legal occupations
91,442Management occupations
89,766Computer and mathematical occupations
89,607Architecture and engineering occupations
76,150Business and financial operations occupations
Companies with federal contracts located in this zip code (WEBSTER, NY):
FRANK LILL & SON, INC (656) : $4,193,344 in 39 contractsfrom 1999 to 2005
Contracts for Construction of Structures and Facilities -- Miscellaneous Buildings, Construction of Structures and Facilities -- EPG Facilities - Gas, Maintenance, Repair or Alteration of Real Property -- Heating and Cooling Plants, Maintenance, Repair or Alteration of Real Property -- Government-Owned Government-Operated (GOGO) R&D Facilities, and moreby Army, Navy, NASA Signed by year:2000: $346,858; 2001: $659,412; 2002: $68,262; 2003: $76,188; 2004: $2,745,492; 2005: $254,524; 2006: $0.
Biggest contracts:
$2,745,492 with Army for Construction of Structures and Facilities -- Miscellaneous Buildings. Taking place in MT. Signed on 2004-05-28. Completion date: 2006-06-01.
$284,500 with Navy for Construction of Structures and Facilities -- EPG Facilities - Gas. Taking place in MD. Signed on 2001-03-08. Completion date: 2000-01-01.
$199,190 with Navy for Maintenance, Repair or Alteration of Real Property -- Heating and Cooling Plants. Taking place in NH. Signed on 2001-10-01. Completion date: 2002-10-13.
$98,163 with Army for Construction of Structures and Facilities -- Miscellaneous Buildings. Taking place in MT. Signed on 2005-06-14. Completion date: 2006-06-01.
MICROSYSTEMS & NANOTECHNOLOGIE (70 ANGEL PATH; small business) : $292,713 in 2 contractsfrom 2004 to 2006
$153,980 with Air Force for Other Defense -- Basic Research (R&D). Signed on 2004-12-27. Completion date: 2006-03-27.
$138,733 with Air Force for Other Defense -- Applied Research and Exploratory Development (R&D). Signed on 2006-04-11. Completion date: 2007-01-10.
REBOOT INFORMATION TECHNOLOGY (770 BASKET ROAD; small business)
$22,353 with Navy for ADP Supplies. Signed on 2004-09-01. Completion date: 2004-09-13.
INNOVATIVE PERIPHERAL SYSTEMS, (2112 EMPIRE BLVD STE 6B; small business)
$11,690 with Navy for ADP Components. Taking place in MA. Signed on 2005-03-08. Completion date: 2005-04-08.
WRITE SOURCE, INC, THE (1270 CREEK ST STE10; small business) : $8,121 in 3 contractsin 2005
$6,552 with Army for ADP Components. Signed on 2005-01-12. Completion date: 2005-02-15.
$876, same as above.Signed on 2005-01-31. Completion date: 2005-02-15.
$693, same as above.Signed on 2005-02-17. Completion date: 2005-02-15.
MYLAND USA (1110 BRICK LANDING PLACE; small business) : $0 in 2 contractsin 2005
$8,937 with Air Force for Cabinets, Lockers, Bins, and Shelving. Signed on 2005-04-25. Completion date: 2005-06-13.
-$8,937, same as above.Signed on 2005-08-04. Completion date: 2005-06-13.
PELLITTIERI, P DDS (1630 EMPIRE BLVD STE 3; small business) : -$19,400 in 2 contractsin 2004
$0 with Army for Radiology Services. Signed on 2004-08-27. Completion date: 2003-07-14.
-$19,400, same as above.Signed on 2004-08-27. Completion date: 2003-07-14.
Top industries in this zip code by the number of employees in 2005:
Management of Companies and Enterprises: Corporate, Subsidiary, and Regional Managing Offices (500-999: 2, 250-499: 1, 100-249: 1, 20-49: 1, 10-19: 1, 1-4: 1)
Professional, Scientific, and Technical Services: Research and Development in the Physical, Engineering, and Life Sciences (500-999: 2, 100-249: 1, 5-9: 1, 1-4: 3)
Health Care and Social Assistance: Home Health Care Services (500-999: 1, 100-249: 1, 1-4: 2)
Information: Data Processing, Hosting, and Related Services (250-499: 2, 100-249: 1, 1-4: 3)
2002 - 2018 National Fire Incident Reporting System (NFIRS) incidents
Based on the data from the years 2002 - 2018 the average number of fires per year is 148. The highest number of fires - 246 took place in 2008, and the least - 96 in 2014. The data has a declining trend.
When looking into fire subcategories, the most incidents belonged to: Structure Fires (46.8%), and Outside Fires (36.4%).
Fire incident types reported to NFIRS in Zip Code 14580

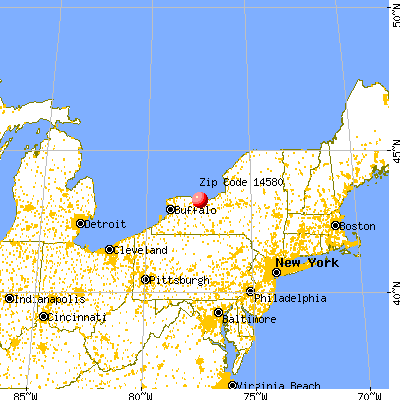


 Nearest zip codes: 14526, 14625, 14622, 14445, 14609, 14610.


 Based on the data from the years 2002 - 2018 the average number of fires per year is 148. The highest number of fires - 246 took place in 2008, and the least - 96 in 2014. The data has a declining trend.
 When looking into fire subcategories, the most incidents belonged to: Structure Fires (46.8%), and Outside Fires (36.4%).