Estimated zip code population in 2022: 3,790 Zip code population in 2010: 4,492 Zip code population in 2000: 4,331
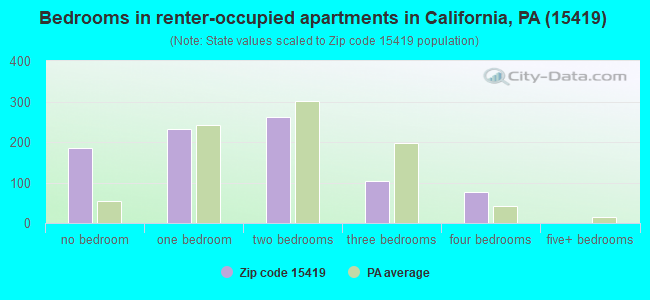
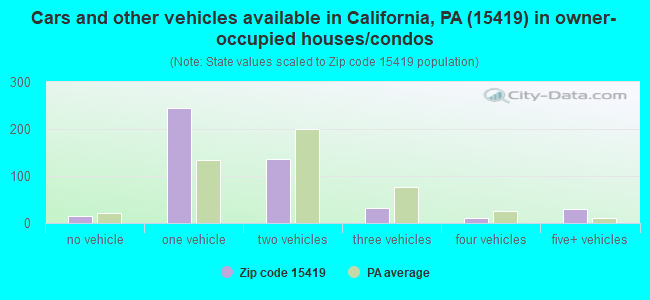
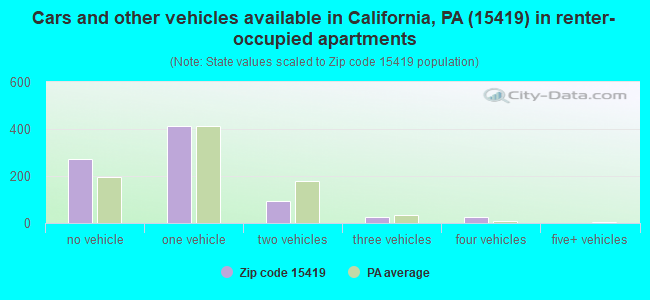
Houses and condos: 1,635 Renter-occupied apartments: 835
% of renters here:
64%
State:
31%
March 2022 cost of living index in zip code 15419: 89.4 (less than average, U.S. average is 100)
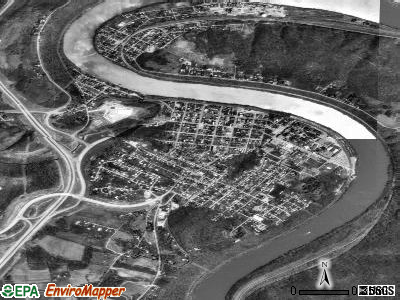
Land area: 1.7 sq. mi. Water area: 0.2 sq. mi.
Population density: 2,186 people per square mile
(low).
OSM Map
General Map
Google Map
MSN Map
OSM Map
General Map
Google Map
MSN Map
OSM Map
General Map
Google Map
MSN Map
OSM Map
General Map
Google Map
MSN Map
Please wait while loading the map...
Real estate property taxes paid for housing units in 2022:
This zip code:
1.2% ($1,445)
Pennsylvania:
1.3% ($3,094)
Median real estate property taxes paid for housing units with mortgages in 2022: $2,222 (1.7%) Median real estate property taxes paid for housing units with no mortgage in 2022: $821 (0.8%)
Business Search- 14 Million verified businesses
Males: 1,717
(45.3%)
Females: 2,074
(54.7%)
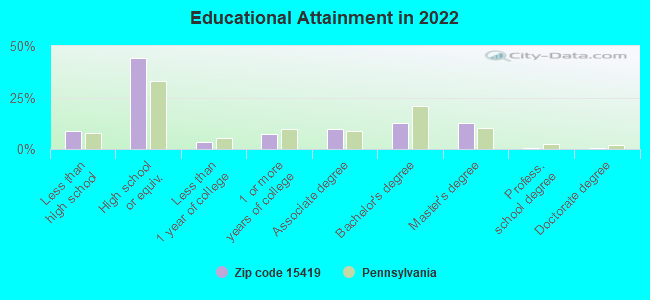
For population 25 years and over in 15419:
High school or higher: 90.4%
Bachelor's degree or higher: 26.5%
Graduate or professional degree: 13.8%
Unemployed: 8.9%
Mean travel time to work (commute): 22.4 minutes
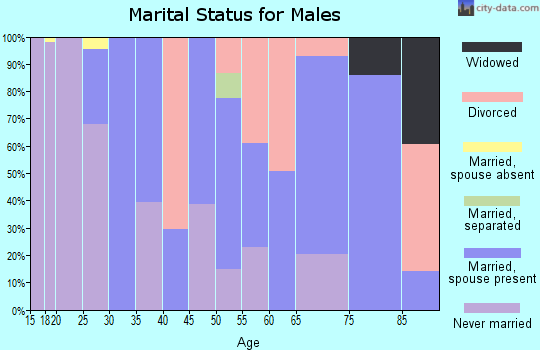
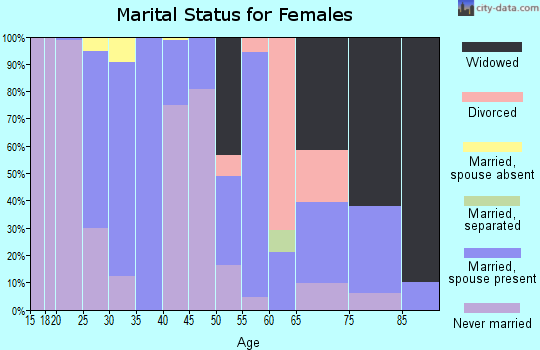
For population 15 years and over in 15419:
Never married: 70.3%
Now married: 18.8%
Separated: 2.1%
Widowed: 4.1%
Divorced: 4.6%
Zip code 15419 compared to state average:
Median household income below state average.
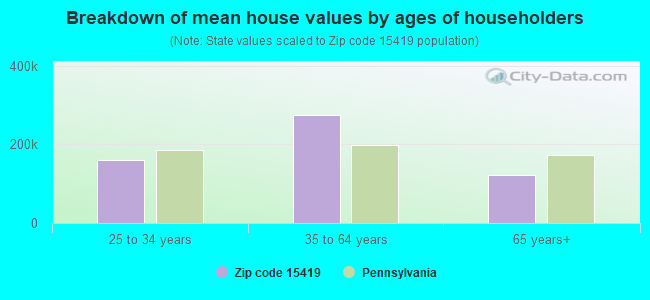
Median house value below state average.
Unemployed percentage above state average.
Hispanic race population percentage below state average.
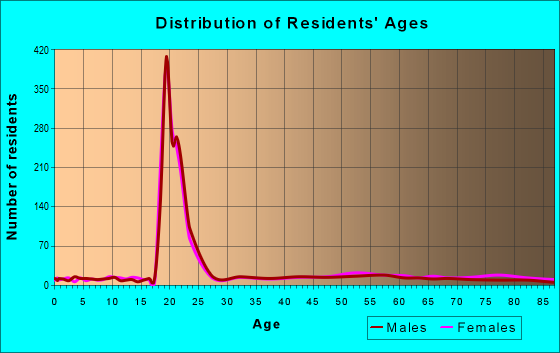
Median age significantly below state average.
Foreign-born population percentage below state average.
Renting percentage above state average.
Length of stay since moving in significantly above state average.
Number of college students significantly above state average.
Percentage of population with a bachelor's degree or higher significantly below state average.
Estimated median house/condo value in 2022: $118,843
15419:
$118,843
Pennsylvania:
$245,500
According to our research of Pennsylvania and other state lists, there were 2 registered sex offenders living in 15419 zip code as of April 27, 2024. The ratio of all residents to sex offenders in zip code 15419 is 2,307 to 1. The ratio of registered sex offenders to all residents in this zip code is much lower than the state average.
Median resident age:
This zip code:
22.0 years
Pennsylvania median age:
40.9 years
Average household size:
This zip code:
1.9 people
Pennsylvania:
2.4 people
Averages for the 2020 tax year for zip code 15419, filed in 2021:
Average Adjusted Gross Income (AGI) in 2020: $46,705 (Individual Income Tax Returns)
Here:
$46,705
State:
$75,707
Salary/wage: $37,724 (reported on 82.3% of returns)
Here:
$37,724
State:
$62,806
(% of AGI for various income ranges: 1020.5% for AGIs below $25k, 3175.0% for AGIs $25k-50k, 5848.3% for AGIs $50k-75k, 8158.6% for AGIs $75k-100k, 15654.3% for AGIs $100k-200k)
Taxable interest for individuals: $552 (reported on 20.4% of returns)
This zip code:
$552
Pennsylvania:
$1,633
(% of AGI for various income ranges: 10.3% for AGIs below $25k, 4.6% for AGIs $25k-50k, 18.3% for AGIs $50k-75k, 30.0% for AGIs $75k-100k, 50.0% for AGIs $100k-200k)
Ordinary dividends: $3,019 (reported on 14.2% of returns)
Here:
$3,019
State:
$7,382
(% of AGI for various income ranges: 11.4% for AGIs below $25k, 9.6% for AGIs $25k-50k, 153.3% for AGIs $50k-75k, 334.3% for AGIs $100k-200k)
Net capital gain/loss in AGI: +$3,692 (reported on 10.6% of returns)
Here:
+$3,692
State:
+$23,522
(% of AGI for various income ranges: 8.4% for AGIs below $25k, 151.7% for AGIs $50k-75k, 328.6% for AGIs $100k-200k)
Profit/loss from business: +$2,188 (reported on 7.1% of returns)
Here:
+$2,188
State:
+$16,274
(% of AGI for various income ranges: 37.0% for AGIs below $25k, 33.3% for AGIs $50k-75k)
Taxable individual retirement arrangement distribution: $13,338 (reported on 7.1% of returns)
15419:
$13,338
Pennsylvania:
$18,583
(% of AGI for various income ranges: 54.6% for AGIs below $25k, 108.3% for AGIs $50k-75k, 1050.0% for AGIs $75k-100k)
Earned income credit: $1,956 (reported on 15.9% of returns)
Here:
$1,956
State:
$2,100
(% of AGI for various income ranges: 57.0% for AGIs below $25k, 58.8% for AGIs $25k-50k)
Percentage of individuals using paid preparers for their 2020 taxes: 92.9%
Here:
93%
State:
92%
(% for various income ranges: 91.5% for AGIs below $25k, 92.9% for AGIs $25k-50k, 93.8% for AGIs $50k-75k, 100.0% for AGIs $75k-100k, 92.3% for AGIs $100k-200k)
Averages for the 2012 tax year for zip code 15419, filed in 2013:
Average Adjusted Gross Income (AGI) in 2012: $43,719 (Individual Income Tax Returns)
Here:
$43,719
State:
$61,346
Salary/wage: $37,553 (reported on 78.6% of returns)
Here:
$37,553
State:
$51,902
(% of AGI for various income ranges: 68.4% for AGIs below $25k, 70.7% for AGIs $25k-50k, 66.7% for AGIs $50k-75k, 72.3% for AGIs $75k-100k, 62.4% for AGIs $100k-200k)
Taxable interest for individuals: $957 (reported on 33.3% of returns)
This zip code:
$957
Pennsylvania:
$1,588
(% of AGI for various income ranges: 2.2% for AGIs below $25k, 0.7% for AGIs $25k-50k, 0.5% for AGIs $50k-75k, 0.9% for AGIs $75k-100k, 0.3% for AGIs $100k-200k)
Ordinary dividends: $2,195 (reported on 25.0% of returns)
Here:
$2,195
State:
$5,827
(% of AGI for various income ranges: 1.2% for AGIs below $25k, 0.8% for AGIs $25k-50k, 1.3% for AGIs $50k-75k, 1.3% for AGIs $75k-100k, 1.5% for AGIs $100k-200k)
Net capital gain/loss in AGI: +$427 (reported on 13.1% of returns)
Here:
+$427
State:
+$14,495
(% of AGI for various income ranges: 0.2% for AGIs below $25k, 0.3% for AGIs $100k-200k)
Profit/loss from business: +$2,138 (reported on 9.5% of returns)
Here:
+$2,138
State:
+$16,268
(% of AGI for various income ranges: 0.6% for AGIs below $25k, 1.3% for AGIs $25k-50k, 0.8% for AGIs $75k-100k)
Taxable individual retirement arrangement distribution: $9,140 (reported on 11.9% of returns)
15419:
$9,140
Pennsylvania:
$14,550
(% of AGI for various income ranges: 4.5% for AGIs below $25k, 2.5% for AGIs $25k-50k, 2.1% for AGIs $50k-75k, 5.3% for AGIs $75k-100k)
Total itemized deductions: $16,236 (19% of AGI, reported on 16.7% of returns)
Here:
$16,236
State:
$23,538
Here:
18.8% of AGI
State:
18.4% of AGI
(% of AGI for various income ranges: 5.7% for AGIs $25k-50k, 6.9% for AGIs $50k-75k, 7.5% for AGIs $75k-100k, 7.3% for AGIs $100k-200k)
Charity contributions: $2,783 (reported on 14.3% of returns)
Here:
$2,783
State:
$4,025
(% of AGI for various income ranges: 0.8% for AGIs below $25k, 1.0% for AGIs $50k-75k, 1.1% for AGIs $75k-100k, 1.3% for AGIs $100k-200k)
Taxes paid: $5,257 (reported on 16.7% of returns)
15419:
$5,257
State:
$9,982
(% of AGI for various income ranges: 1.4% for AGIs $25k-50k, 2.0% for AGIs $50k-75k, 2.2% for AGIs $75k-100k, 3.0% for AGIs $100k-200k)
Earned income credit: $1,790 (reported on 11.9% of returns)
Here:
$1,790
State:
$2,106
(% of AGI for various income ranges: 3.6% for AGIs below $25k, 0.6% for AGIs $25k-50k)
Percentage of individuals using paid preparers for their 2012 taxes: 47.6%
Here:
48%
State:
53%
(% for various income ranges: 36.1% for AGIs below $25k, 50.0% for AGIs $25k-50k, 53.8% for AGIs $50k-75k, 66.7% for AGIs $75k-100k, 62.5% for AGIs $100k-200k)
Averages for the 2004 tax year for zip code 15419, filed in 2005:
Average Adjusted Gross Income (AGI) in 2004: $34,391 (Individual Income Tax Returns)
Here:
$34,391
State:
$48,049
Salary/wage: $31,396 (reported on 77.8% of returns)
Here:
$31,396
State:
$42,646
(% of AGI for various income ranges: 88.3% for AGIs below $10k, 63.7% for AGIs $10k-25k, 77.1% for AGIs $25k-50k, 76.5% for AGIs $50k-75k, 69.6% for AGIs $75k-100k, 58.4% for AGIs over 100k)
Taxable interest for individuals: $1,549 (reported on 50.2% of returns)
This zip code:
$1,549
Pennsylvania:
$1,657
(% of AGI for various income ranges: 3.5% for AGIs below $10k, 2.8% for AGIs $10k-25k, 2.7% for AGIs $25k-50k, 2.7% for AGIs $50k-75k, 1.4% for AGIs $75k-100k, 1.4% for AGIs over 100k)
Taxable dividends: $1,653 (reported on 20.5% of returns)
Here:
$1,653
State:
$3,566
(% of AGI for various income ranges: 0.7% for AGIs below $10k, 0.3% for AGIs $10k-25k, 0.7% for AGIs $25k-50k, 1.9% for AGIs $50k-75k, 0.4% for AGIs $75k-100k, 1.2% for AGIs over 100k)
Profit/loss from business: +$3,481 (reported on 7.9% of returns)
Here:
+$3,481
State:
+$14,267
(% of AGI for various income ranges: -0.4% for AGIs below $10k, 2.0% for AGIs $10k-25k, 0.1% for AGIs $25k-50k, 0.8% for AGIs $50k-75k, 2.0% for AGIs $75k-100k)
IRA payment deduction: $1,818 (reported on 1.1% of returns)
15419:
$1,818
Pennsylvania:
$2,903
Total itemized deductions: $14,237 (20% of AGI, reported on 17.4% of returns)
Here:
$14,237
State:
$18,804
Here:
19.6% of AGI
State:
19.5% of AGI
(% of AGI for various income ranges: 3.9% for AGIs $10k-25k, 5.7% for AGIs $25k-50k, 8.0% for AGIs $50k-75k, 9.9% for AGIs $75k-100k, 9.1% for AGIs over 100k)
Charity contributions deductions: $3,106 (4% of AGI, reported on 14.6% of returns)
Here:
$3,106
State:
$3,337
Here:
4.0% of AGI
State:
3.3% of AGI
(% of AGI for various income ranges: 1.1% for AGIs $25k-50k, 1.5% for AGIs $50k-75k, 1.4% for AGIs $75k-100k, 2.3% for AGIs over 100k)
Total tax: $4,938 (reported on 69.9% of returns)
15419:
$4,938
State:
$8,008
(% of AGI for various income ranges: 0.9% for AGIs below $10k, 4.0% for AGIs $10k-25k, 7.3% for AGIs $25k-50k, 10.3% for AGIs $50k-75k, 11.8% for AGIs $75k-100k, 17.4% for AGIs over 100k)
Earned income credit: $1,370 (reported on 14.2% of returns)
Here:
$1,370
State:
$1,643
Percentage of individuals using paid preparers for their 2004 taxes: 50.6%
Here:
51%
State:
56%
(% for various income ranges: 40.0% for AGIs below $10k, 52.7% for AGIs $10k-25k, 57.6% for AGIs $25k-50k, 51.1% for AGIs $50k-75k, 57.1% for AGIs $75k-100k, 53.7% for AGIs over 100k)
Notable locations in zip code 15419: New Science Hall (A), Natali Student Center (B), Manderino Library (C), Longanecker Hall (D), Keystone Hall (E), Kara Alumni House (F), Herron Hall (G), Hamer Hall (H), Eberly Hall (I), Duda Hall (J), Downey-Garofalo Health Center (K), Dixon Hall (L), Coover Annex (M), Clyde Hall (N), Azorsky Hall (O), Vulcan Hall (P), Steele Hall (Q), Pollock Building (R), Noss Hall (S), Noss Annex (T). Display/hide their locations on the map
166 married couples with children.
150 single-parent households (9 men, 141 women).
95.2% of residents of 15419 zip code speak English at home.
1.5% of residents speak Spanish at home (100% very well).
1.9% of residents speak other Indo-European language at home (85% very well, 15% well).
0.5% of residents speak Asian or Pacific Island language at home (53% very well, 47% not well).
0.1% of residents speak other language at home (100% very well).
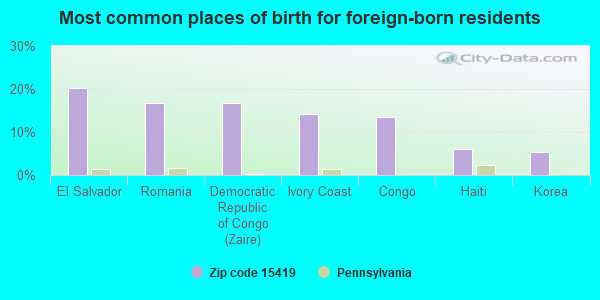
Foreign born population: 148 (3.9%) (37.1% of them are naturalized citizens)
This zip code:
3.9%
Whole state:
7.5%
20%El Salvador
17%Romania
17%Democratic Republic of Congo (Zaire)
14%Ivory Coast
13%Congo
6%Haiti
5%Korea
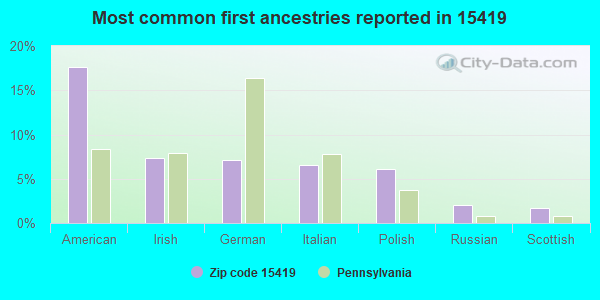
18%American
7%Irish
7%German
7%Italian
6%Polish
2%Russian
2%Scottish
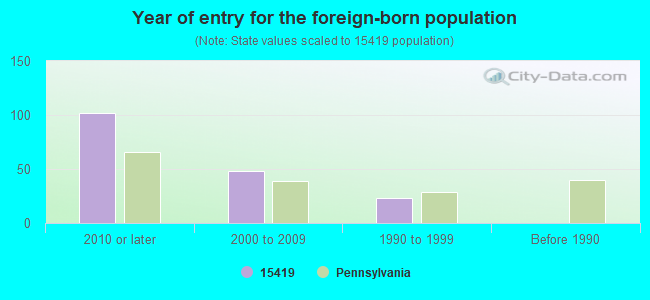
Year of entry for the foreign-born population
1022010 or later
482000 to 2009
231990 to 1999
0Before 1990
Housing units lacking complete plumbing facilities: 2.5% Housing units lacking complete kitchen facilities: 4.3%
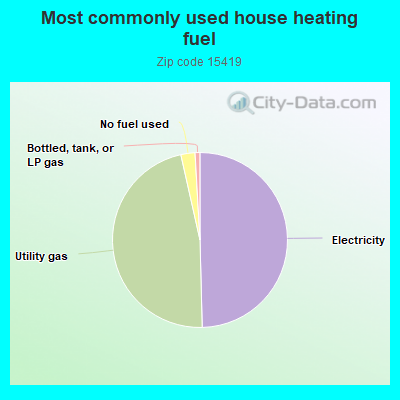
49.6%Electricity
46.9%Utility gas
2.6%No fuel used
0.9%Bottled, tank, or LP gas
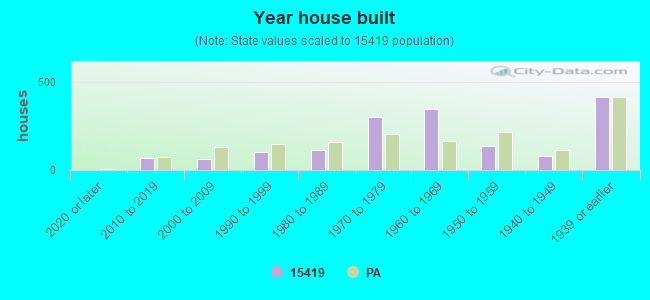
Population in 1990: 5,778.
Place of birth for U.S.-born residents:
This state: 2,810
Northeast: 262
Midwest: 206
South: 259
West: 84
43% of the 15419 zip code residents lived in the same house 5 years ago. Out of people who lived in different houses, 29% lived in this county. Out of people who lived in different counties, 50% lived in Pennsylvania.
76% of the 15419 zip code residents lived in the same house 1 year ago. Out of people who lived in different houses, 73% moved from this county. Out of people who lived in different houses, 13% moved from different county within same state. Out of people who lived in different houses, 8% moved from different state.
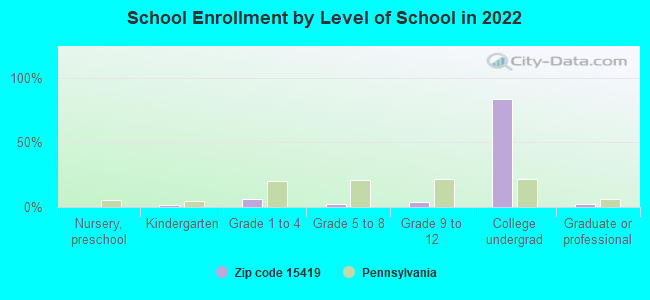
Private vs. public school enrollment:
Students in private schools in grades 1 to 8 (elementary and middle school):
Here:
0.0%
Pennsylvania:
15.7%
Students in private schools in grades 9 to 12 (high school):
Here:
0.0%
Pennsylvania:
13.4%
Students in private undergraduate colleges: 223
Here:
13.3%
Pennsylvania:
39.8%
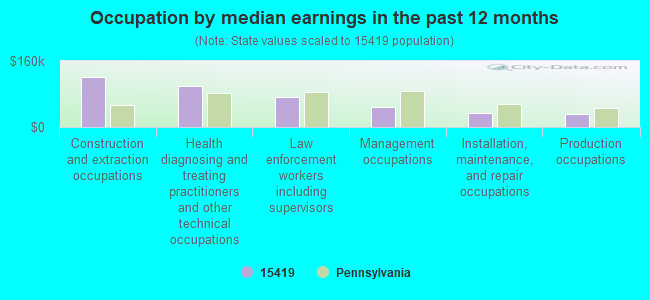
Occupation by median earnings in the past 12 months ($)
122,404Construction and extraction occupations
98,610Health diagnosing and treating practitioners and other technical occupations
73,568Law enforcement workers including supervisors
49,260Management occupations
33,121Installation, maintenance, and repair occupations
31,605Production occupations
Companies with federal contracts located in this zip code:
CALIFORNIA PRECISION MACHINE, (1170 WOOD ST in CALIFORNIA, PA; small business)
$42,688 with Defense Logistics Agency for Guns, through 30 mm. Signed on 2000-01-06. Completion date: 2000-07-04.
Top industries in this zip code by the number of employees in 2005:
Other Services (except Public Administration): Labor Unions and Similar Labor Organizations (100-249 employees: 1 establishment)
Accommodation and Food Services: Limited-Service Restaurants (20-49: 2, 10-19: 2)
Educational Services: Colleges, Universities, and Professional Schools (50-99: 1)
Health Care and Social Assistance: Services for the Elderly and Persons with Disabilities (20-49: 1)
Construction: Plumbing, Heating, and Air-Conditioning Contractors (20-49: 1)
Other Services (except Public Administration): Religious Organizations (5-9: 3, 1-4: 1)
Mining: Support Activities for Coal Mining (10-19: 1, 1-4: 1)
People in group quarters in 2010:
1,466 people in college/university student housing
People in group quarters in 2000:
1,176 people in college dormitories (includes college quarters off campus)
8 people in other group homes
8 people in other noninstitutional group quarters
5 people in nursing homes
3 people in religious group quarters
Fatal accident statistics in 2011:
Fatal accident count: 1
Vehicles involved in fatal accidents: 2
Fatal accidents caused by drunken drivers: 0
Fatalities: 1
Persons involved in fatal accidents: 2
Pedestrians involved in fatal accidents: 0
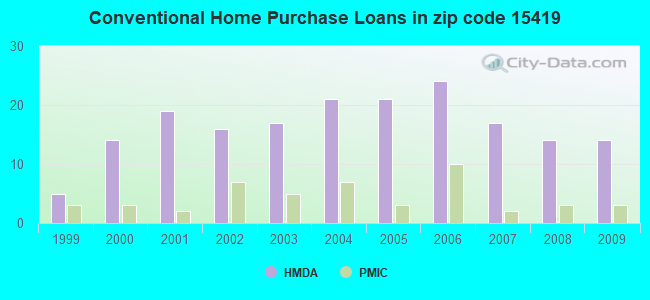
Home Mortgage Disclosure Act Aggregated Statistics For Year 2009 (Based on 2 partial tracts)
A) FHA, FSA/RHS & VA Home Purchase Loans
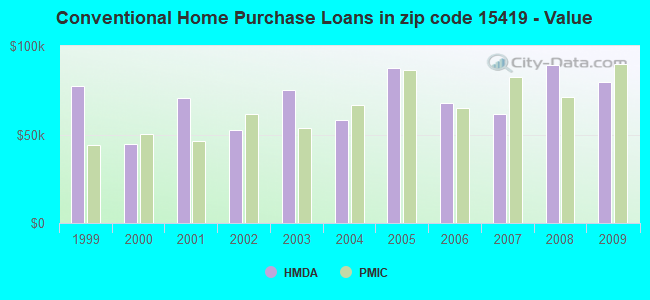
B) Conventional Home Purchase Loans
C) Refinancings
D) Home Improvement Loans
E) Loans on Dwellings For 5+ Families
F) Non-occupant Loans on < 5 Family Dwellings (A B C & D)
Number
Average Value
Number
Average Value
Number
Average Value
Number
Average Value
Number
Average Value
Number
Average Value
LOANS ORIGINATED
3
$103,240
14
$79,667
19
$90,938
2
$21,750
0
$0
10
$76,908
APPLICATIONS APPROVED, NOT ACCEPTED
0
$0
2
$68,730
5
$86,304
2
$13,050
0
$0
2
$68,730
APPLICATIONS DENIED
5
$102,660
2
$61,770
14
$78,797
2
$43,500
0
$0
2
$61,770
APPLICATIONS WITHDRAWN
0
$0
2
$82,650
2
$82,650
2
$47,850
2
$78,300
2
$82,650
FILES CLOSED FOR INCOMPLETENESS
0
$0
0
$0
0
$0
0
$0
0
$0
0
$0
Aggregated Statistics For Year 2008 (Based on 2 partial tracts)
A) FHA, FSA/RHS & VA Home Purchase Loans
B) Conventional Home Purchase Loans
C) Refinancings
D) Home Improvement Loans
E) Loans on Dwellings For 5+ Families
F) Non-occupant Loans on < 5 Family Dwellings (A B C & D)
Number
Average Value
Number
Average Value
Number
Average Value
Number
Average Value
Number
Average Value
Number
Average Value
LOANS ORIGINATED
7
$77,803
14
$89,113
12
$66,410
2
$24,360
2
$310,590
10
$66,294
APPLICATIONS APPROVED, NOT ACCEPTED
3
$86,420
2
$12,180
0
$0
2
$34,800
0
$0
2
$34,800
APPLICATIONS DENIED
0
$0
10
$101,790
17
$157,726
7
$81,283
0
$0
7
$248,820
APPLICATIONS WITHDRAWN
2
$66,120
2
$69,600
2
$34,800
0
$0
0
$0
0
$0
FILES CLOSED FOR INCOMPLETENESS
0
$0
0
$0
0
$0
0
$0
0
$0
0
$0
Aggregated Statistics For Year 2007 (Based on 2 partial tracts)
A) FHA, FSA/RHS & VA Home Purchase Loans
B) Conventional Home Purchase Loans
C) Refinancings
D) Home Improvement Loans
F) Non-occupant Loans on < 5 Family Dwellings (A B C & D)
Number
Average Value
Number
Average Value
Number
Average Value
Number
Average Value
Number
Average Value
LOANS ORIGINATED
3
$75,400
17
$61,309
17
$77,993
3
$52,200
9
$63,413
APPLICATIONS APPROVED, NOT ACCEPTED
0
$0
3
$102,080
3
$106,720
0
$0
0
$0
APPLICATIONS DENIED
2
$68,730
5
$17,748
37
$77,218
3
$52,200
3
$69,600
APPLICATIONS WITHDRAWN
0
$0
0
$0
7
$82,277
2
$43,500
0
$0
FILES CLOSED FOR INCOMPLETENESS
0
$0
0
$0
2
$97,440
2
$76,560
2
$76,560
Aggregated Statistics For Year 2006 (Based on 2 partial tracts)
A) FHA, FSA/RHS & VA Home Purchase Loans
B) Conventional Home Purchase Loans
C) Refinancings
D) Home Improvement Loans
E) Loans on Dwellings For 5+ Families
F) Non-occupant Loans on < 5 Family Dwellings (A B C & D)
G) Loans On Manufactured Home Dwelling (A B C & D)
Number
Average Value
Number
Average Value
Number
Average Value
Number
Average Value
Number
Average Value
Number
Average Value
Number
Average Value
LOANS ORIGINATED
2
$60,030
24
$68,077
44
$62,759
2
$12,180
2
$130,500
19
$61,999
0
$0
APPLICATIONS APPROVED, NOT ACCEPTED
0
$0
2
$33,930
3
$109,620
0
$0
0
$0
0
$0
2
$33,930
APPLICATIONS DENIED
0
$0
10
$75,864
28
$78,362
10
$8,178
0
$0
14
$48,223
3
$91,060
APPLICATIONS WITHDRAWN
0
$0
3
$73,080
14
$60,527
0
$0
0
$0
0
$0
0
$0
FILES CLOSED FOR INCOMPLETENESS
0
$0
2
$6,090
7
$81,034
0
$0
0
$0
2
$56,550
0
$0
Aggregated Statistics For Year 2005 (Based on 2 partial tracts)
A) FHA, FSA/RHS & VA Home Purchase Loans
B) Conventional Home Purchase Loans
C) Refinancings
D) Home Improvement Loans
F) Non-occupant Loans on < 5 Family Dwellings (A B C & D)
G) Loans On Manufactured Home Dwelling (A B C & D)
Number
Average Value
Number
Average Value
Number
Average Value
Number
Average Value
Number
Average Value
Number
Average Value
LOANS ORIGINATED
5
$88,392
21
$87,414
28
$75,752
10
$42,630
14
$94,706
2
$26,970
APPLICATIONS APPROVED, NOT ACCEPTED
2
$105,270
3
$48,720
16
$70,796
3
$8,120
3
$91,640
0
$0
APPLICATIONS DENIED
0
$0
5
$76,908
63
$73,025
10
$24,708
7
$62,889
2
$33,930
APPLICATIONS WITHDRAWN
0
$0
2
$8,700
19
$79,216
0
$0
0
$0
0
$0
FILES CLOSED FOR INCOMPLETENESS
0
$0
0
$0
3
$122,380
0
$0
0
$0
0
$0
Aggregated Statistics For Year 2004 (Based on 2 partial tracts)
A) FHA, FSA/RHS & VA Home Purchase Loans
B) Conventional Home Purchase Loans
C) Refinancings
D) Home Improvement Loans
F) Non-occupant Loans on < 5 Family Dwellings (A B C & D)
G) Loans On Manufactured Home Dwelling (A B C & D)
Number
Average Value
Number
Average Value
Number
Average Value
Number
Average Value
Number
Average Value
Number
Average Value
LOANS ORIGINATED
2
$60,030
21
$57,917
33
$55,575
5
$51,852
12
$46,690
0
$0
APPLICATIONS APPROVED, NOT ACCEPTED
0
$0
2
$104,400
5
$106,488
0
$0
0
$0
2
$104,400
APPLICATIONS DENIED
0
$0
7
$54,686
49
$62,782
10
$61,770
5
$67,860
2
$17,400
APPLICATIONS WITHDRAWN
0
$0
5
$67,164
7
$81,780
0
$0
2
$66,120
0
$0
FILES CLOSED FOR INCOMPLETENESS
0
$0
2
$54,810
3
$87,000
0
$0
3
$79,460
0
$0
Aggregated Statistics For Year 2003 (Based on 2 partial tracts)
A) FHA, FSA/RHS & VA Home Purchase Loans
B) Conventional Home Purchase Loans
C) Refinancings
D) Home Improvement Loans
F) Non-occupant Loans on < 5 Family Dwellings (A B C & D)
Number
Average Value
Number
Average Value
Number
Average Value
Number
Average Value
Number
Average Value
LOANS ORIGINATED
2
$44,370
17
$75,332
52
$62,105
16
$43,065
21
$52,034
APPLICATIONS APPROVED, NOT ACCEPTED
0
$0
3
$85,260
16
$69,926
5
$29,580
5
$79,692
APPLICATIONS DENIED
0
$0
2
$73,950
54
$68,021
5
$15,660
3
$52,200
APPLICATIONS WITHDRAWN
0
$0
2
$106,140
17
$76,458
0
$0
0
$0
FILES CLOSED FOR INCOMPLETENESS
0
$0
0
$0
0
$0
0
$0
0
$0
Aggregated Statistics For Year 2002 (Based on 2 partial tracts)
A) FHA, FSA/RHS & VA Home Purchase Loans
B) Conventional Home Purchase Loans
C) Refinancings
D) Home Improvement Loans
F) Non-occupant Loans on < 5 Family Dwellings (A B C & D)
Number
Average Value
Number
Average Value
Number
Average Value
Number
Average Value
Number
Average Value
LOANS ORIGINATED
3
$100,340
16
$52,635
40
$74,516
7
$36,043
16
$50,786
APPLICATIONS APPROVED, NOT ACCEPTED
0
$0
3
$116,000
26
$61,368
0
$0
0
$0
APPLICATIONS DENIED
0
$0
5
$51,504
56
$66,866
5
$48,372
5
$54,636
APPLICATIONS WITHDRAWN
0
$0
2
$62,640
10
$78,648
2
$41,760
3
$73,080
FILES CLOSED FOR INCOMPLETENESS
0
$0
0
$0
3
$127,600
0
$0
0
$0
Aggregated Statistics For Year 2001 (Based on 2 partial tracts)
A) FHA, FSA/RHS & VA Home Purchase Loans
B) Conventional Home Purchase Loans
C) Refinancings
D) Home Improvement Loans
E) Loans on Dwellings For 5+ Families
F) Non-occupant Loans on < 5 Family Dwellings (A B C & D)
Number
Average Value
Number
Average Value
Number
Average Value
Number
Average Value
Number
Average Value
Number
Average Value
LOANS ORIGINATED
3
$56,840
19
$70,699
52
$59,528
12
$21,170
2
$42,630
2
$47,850
APPLICATIONS APPROVED, NOT ACCEPTED
0
$0
2
$40,020
7
$76,809
12
$31,755
0
$0
2
$65,250
APPLICATIONS DENIED
0
$0
2
$44,370
49
$47,300
7
$20,880
0
$0
0
$0
APPLICATIONS WITHDRAWN
0
$0
0
$0
10
$90,480
0
$0
0
$0
0
$0
FILES CLOSED FOR INCOMPLETENESS
0
$0
0
$0
5
$84,564
0
$0
0
$0
0
$0
Aggregated Statistics For Year 2000 (Based on 2 partial tracts)
A) FHA, FSA/RHS & VA Home Purchase Loans
B) Conventional Home Purchase Loans
C) Refinancings
D) Home Improvement Loans
F) Non-occupant Loans on < 5 Family Dwellings (A B C & D)
Number
Average Value
Number
Average Value
Number
Average Value
Number
Average Value
Number
Average Value
LOANS ORIGINATED
5
$62,292
14
$44,370
23
$49,855
9
$14,113
5
$40,020
APPLICATIONS APPROVED, NOT ACCEPTED
0
$0
2
$59,160
5
$54,636
3
$12,760
2
$59,160
APPLICATIONS DENIED
2
$22,620
5
$43,500
23
$58,479
7
$35,794
3
$41,180
APPLICATIONS WITHDRAWN
0
$0
3
$45,240
9
$48,333
0
$0
0
$0
FILES CLOSED FOR INCOMPLETENESS
0
$0
0
$0
0
$0
0
$0
0
$0
Aggregated Statistics For Year 1999 (Based on 1 partial tract)
A) FHA, FSA/RHS & VA Home Purchase Loans
B) Conventional Home Purchase Loans
C) Refinancings
D) Home Improvement Loans
F) Non-occupant Loans on < 5 Family Dwellings (A B C & D)
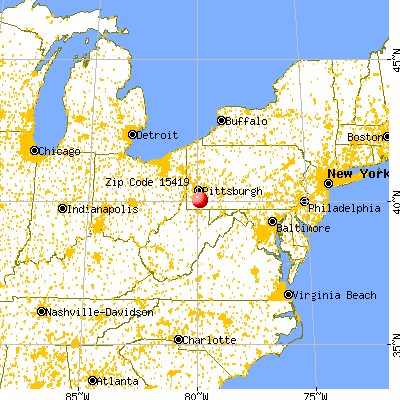


 Nearest zip codes: 15466, 15434, 15444, 15477, 15417, 15438.