Estimated zip code population in 2022: 2,108 Zip code population in 2010: 2,105 Zip code population in 2000: 2,689
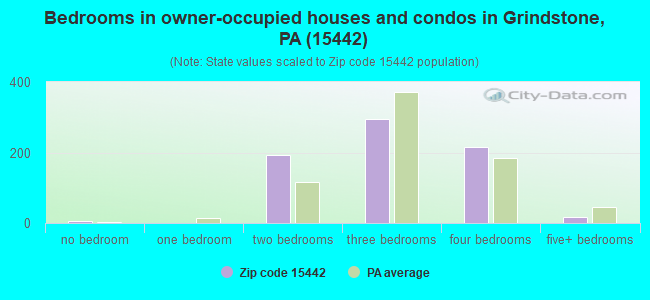
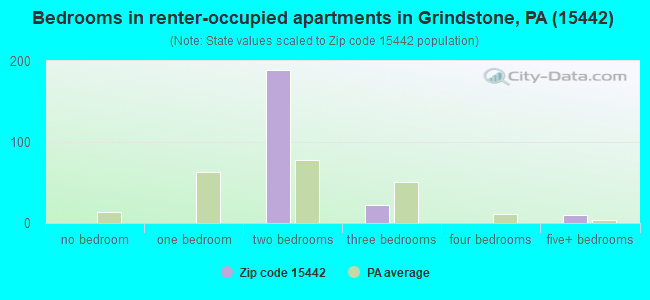
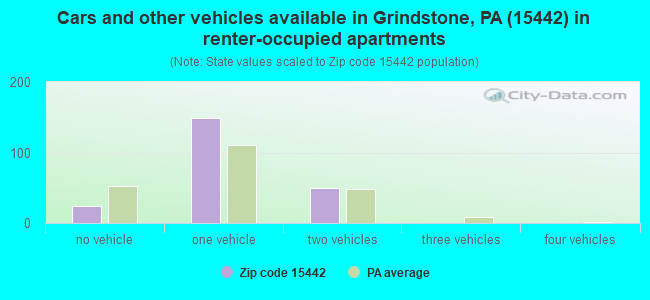
Houses and condos: 1,105 Renter-occupied apartments: 221
% of renters here:
23%
State:
31%
March 2022 cost of living index in zip code 15442: 88.2 (less than average, U.S. average is 100)
Land area: 15.0 sq. mi. Water area: 0.0 sq. mi.
Population density: 141 people per square mile
(very low).
OSM Map
General Map
Google Map
MSN Map
OSM Map
General Map
Google Map
MSN Map
OSM Map
General Map
Google Map
MSN Map
OSM Map
General Map
Google Map
MSN Map
Please wait while loading the map...
Real estate property taxes paid for housing units in 2022:
This zip code:
1.3% ($1,384)
Pennsylvania:
1.3% ($3,094)
Median real estate property taxes paid for housing units with mortgages in 2022: $2,079 (1.1%) Median real estate property taxes paid for housing units with no mortgage in 2022: $1,169 (1.4%)
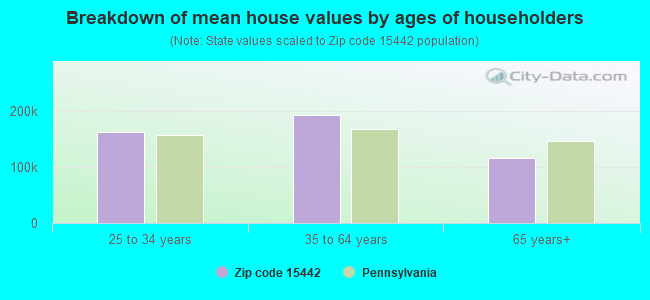
Estimated median house/condo value in 2022: $105,059
15442:
$105,059
Pennsylvania:
$245,500
According to our research of Pennsylvania and other state lists, there were 3 registered sex offenders living in 15442 zip code as of April 27, 2024. The ratio of all residents to sex offenders in zip code 15442 is 592 to 1. The ratio of registered sex offenders to all residents in this zip code is near the state average.
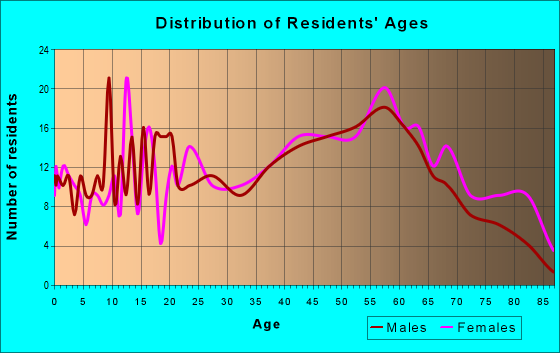
Median resident age:
This zip code:
44.2 years
Pennsylvania median age:
40.9 years
Average household size:
This zip code:
2.2 people
Pennsylvania:
2.4 people
Averages for the 2020 tax year for zip code 15442, filed in 2021:
Average Adjusted Gross Income (AGI) in 2020: $49,997 (Individual Income Tax Returns)
Here:
$49,997
State:
$75,707
Salary/wage: $42,354 (reported on 81.0% of returns)
Here:
$42,354
State:
$62,806
(% of AGI for various income ranges: 970.0% for AGIs below $25k, 3274.8% for AGIs $25k-50k, 5932.3% for AGIs $50k-75k, 8116.2% for AGIs $75k-100k, 17386.7% for AGIs $100k-200k)
Taxable interest for individuals: $677 (reported on 21.0% of returns)
This zip code:
$677
Pennsylvania:
$1,633
(% of AGI for various income ranges: 7.3% for AGIs below $25k, 7.8% for AGIs $25k-50k, 13.1% for AGIs $50k-75k, 25.0% for AGIs $75k-100k, 120.0% for AGIs $100k-200k)
Ordinary dividends: $2,908 (reported on 11.4% of returns)
Here:
$2,908
State:
$7,382
(% of AGI for various income ranges: 9.6% for AGIs below $25k, 27.0% for AGIs $25k-50k, 33.1% for AGIs $50k-75k, 346.7% for AGIs $100k-200k)
Net capital gain/loss in AGI: +$6,756 (reported on 8.6% of returns)
Here:
+$6,756
State:
+$23,522
(% of AGI for various income ranges: 34.4% for AGIs $25k-50k, 86.2% for AGIs $50k-75k, 671.7% for AGIs $100k-200k)
Profit/loss from business: +$6,011 (reported on 8.6% of returns)
Here:
+$6,011
State:
+$16,274
(% of AGI for various income ranges: 56.5% for AGIs below $25k, 60.7% for AGIs $25k-50k, 287.5% for AGIs $75k-100k)
Taxable individual retirement arrangement distribution: $16,486 (reported on 6.7% of returns)
15442:
$16,486
Pennsylvania:
$18,583
(% of AGI for various income ranges: 58.1% for AGIs below $25k, 256.2% for AGIs $50k-75k, 1116.7% for AGIs $100k-200k)
Earned income credit: $2,131 (reported on 15.2% of returns)
Here:
$2,131
State:
$2,100
(% of AGI for various income ranges: 70.4% for AGIs below $25k, 58.5% for AGIs $25k-50k)
Percentage of individuals using paid preparers for their 2020 taxes: 92.4%
Here:
92%
State:
92%
(% for various income ranges: 91.2% for AGIs below $25k, 93.8% for AGIs $25k-50k, 93.8% for AGIs $50k-75k, 90.9% for AGIs $75k-100k, 91.7% for AGIs $100k-200k)
Averages for the 2012 tax year for zip code 15442, filed in 2013:
Average Adjusted Gross Income (AGI) in 2012: $48,646 (Individual Income Tax Returns)
Here:
$48,646
State:
$61,346
Salary/wage: $38,998 (reported on 83.7% of returns)
Here:
$38,998
State:
$51,902
(% of AGI for various income ranges: 71.2% for AGIs below $25k, 78.9% for AGIs $25k-50k, 83.8% for AGIs $50k-75k, 75.6% for AGIs $75k-100k, 46.5% for AGIs $100k-200k)
Taxable interest for individuals: $1,528 (reported on 25.5% of returns)
This zip code:
$1,528
Pennsylvania:
$1,588
(% of AGI for various income ranges: 1.6% for AGIs below $25k, 1.2% for AGIs $25k-50k, 0.7% for AGIs $50k-75k, 0.2% for AGIs $75k-100k, 0.7% for AGIs $100k-200k)
Ordinary dividends: $1,467 (reported on 15.3% of returns)
Here:
$1,467
State:
$5,827
(% of AGI for various income ranges: 0.7% for AGIs below $25k, 0.9% for AGIs $25k-50k, 0.6% for AGIs $50k-75k, 0.3% for AGIs $100k-200k)
Net capital gain/loss in AGI: +$1,233 (reported on 6.1% of returns)
Here:
+$1,233
State:
+$14,495
Profit/loss from business: +$5,933 (reported on 9.2% of returns)
Here:
+$5,933
State:
+$16,268
(% of AGI for various income ranges: 5.9% for AGIs below $25k, 1.7% for AGIs $25k-50k, 0.7% for AGIs $50k-75k)
Taxable individual retirement arrangement distribution: $7,438 (reported on 8.2% of returns)
15442:
$7,438
Pennsylvania:
$14,550
(% of AGI for various income ranges: 1.9% for AGIs below $25k, 2.7% for AGIs $25k-50k, 3.2% for AGIs $75k-100k)
Total itemized deductions: $22,655 (14% of AGI, reported on 11.2% of returns)
Here:
$22,655
State:
$23,538
Here:
14.5% of AGI
State:
18.4% of AGI
(% of AGI for various income ranges: 7.0% for AGIs $25k-50k, 5.0% for AGIs $75k-100k, 8.7% for AGIs $100k-200k)
Charity contributions: $3,686 (reported on 7.1% of returns)
Here:
$3,686
State:
$4,025
Taxes paid: $8,445 (reported on 11.2% of returns)
15442:
$8,445
State:
$9,982
(% of AGI for various income ranges: 1.6% for AGIs $25k-50k, 1.8% for AGIs $75k-100k, 3.8% for AGIs $100k-200k)
Earned income credit: $2,030 (reported on 20.4% of returns)
Here:
$2,030
State:
$2,106
(% of AGI for various income ranges: 6.3% for AGIs below $25k, 0.9% for AGIs $25k-50k)
Percentage of individuals using paid preparers for their 2012 taxes: 50.0%
Here:
50%
State:
53%
(% for various income ranges: 45.2% for AGIs below $25k, 50.0% for AGIs $25k-50k, 50.0% for AGIs $50k-75k, 55.6% for AGIs $75k-100k, 71.4% for AGIs $100k-200k)
Averages for the 2004 tax year for zip code 15442, filed in 2005:
Average Adjusted Gross Income (AGI) in 2004: $32,002 (Individual Income Tax Returns)
Here:
$32,002
State:
$48,049
Salary/wage: $28,424 (reported on 82.8% of returns)
Here:
$28,424
State:
$42,646
(% of AGI for various income ranges: 78.3% for AGIs below $10k, 73.4% for AGIs $10k-25k, 81.7% for AGIs $25k-50k, 82.8% for AGIs $50k-75k, 86.2% for AGIs $75k-100k, 40.9% for AGIs over 100k)
Taxable interest for individuals: $1,293 (reported on 37.7% of returns)
This zip code:
$1,293
Pennsylvania:
$1,657
(% of AGI for various income ranges: 6.7% for AGIs below $10k, 2.2% for AGIs $10k-25k, 1.6% for AGIs $25k-50k, 0.9% for AGIs $50k-75k, 1.0% for AGIs $75k-100k, 0.9% for AGIs over 100k)
Taxable dividends: $1,089 (reported on 15.9% of returns)
Here:
$1,089
State:
$3,566
(% of AGI for various income ranges: 1.8% for AGIs below $10k, 0.2% for AGIs $10k-25k, 0.3% for AGIs $25k-50k, 0.2% for AGIs $50k-75k, 0.2% for AGIs $75k-100k, 1.6% for AGIs over 100k)
Profit/loss from business: +$3,509 (reported on 11.5% of returns)
Here:
+$3,509
State:
+$14,267
(% of AGI for various income ranges: 4.0% for AGIs below $10k, 3.3% for AGIs $10k-25k, 1.7% for AGIs $25k-50k, 0.9% for AGIs $50k-75k, -1.3% for AGIs $75k-100k)
IRA payment deduction: $2,240 (reported on 2.5% of returns)
15442:
$2,240
Pennsylvania:
$2,903
Total itemized deductions: $14,651 (19% of AGI, reported on 10.7% of returns)
Here:
$14,651
State:
$18,804
Here:
19.4% of AGI
State:
19.5% of AGI
(% of AGI for various income ranges: 3.5% for AGIs $10k-25k, 3.9% for AGIs $25k-50k, 5.0% for AGIs $50k-75k, 8.8% for AGIs $75k-100k, 6.1% for AGIs over 100k)
Charity contributions deductions: $2,536 (3% of AGI, reported on 8.4% of returns)
Here:
$2,536
State:
$3,337
Here:
3.1% of AGI
State:
3.3% of AGI
(% of AGI for various income ranges: 0.2% for AGIs $10k-25k, 0.4% for AGIs $25k-50k, 0.4% for AGIs $50k-75k, 1.5% for AGIs $75k-100k, 1.4% for AGIs over 100k)
Total tax: $4,442 (reported on 68.9% of returns)
15442:
$4,442
State:
$8,008
(% of AGI for various income ranges: 1.3% for AGIs below $10k, 3.6% for AGIs $10k-25k, 6.9% for AGIs $25k-50k, 8.8% for AGIs $50k-75k, 11.2% for AGIs $75k-100k, 21.2% for AGIs over 100k)
Earned income credit: $1,726 (reported on 20.2% of returns)
Here:
$1,726
State:
$1,643
Percentage of individuals using paid preparers for their 2004 taxes: 53.8%
Here:
54%
State:
56%
(% for various income ranges: 46.5% for AGIs below $10k, 51.8% for AGIs $10k-25k, 58.0% for AGIs $25k-50k, 60.2% for AGIs $50k-75k, 57.1% for AGIs $75k-100k, 67.9% for AGIs over 100k)
Household received Food Stamps/SNAP in the past 12 months: 181 Household did not receive Food Stamps/SNAP in the past 12 months: 771
Women who had a birth in the past 12 months: 18 (19 now married, 0 unmarried) Women who did not have a birth in the past 12 months: 338 (205 now married, 130 unmarried)
Housing units in zip code 15442 with a mortgage: 281 (6 second mortgage) Median monthly owner costs for units with a mortgage: $1,077 Median monthly owner costs for units without a mortgage: $474
Residents with income below the poverty level in 2022:
This zip code:
9.4%
Whole state:
11.8%
Residents with income below 50% of the poverty level in 2022:
This zip code:
6.5%
Whole state:
6.1%
Median number of rooms in houses and condos:
Here:
6.9
State:
6.8
Median number of rooms in apartments:
Here:
6.5
State:
4.3
Notable locations in this zip code not listed on our city pages
Churches in zip code 15442 include: Dunlap Creek Church (A), Mount Hebron Church (B), Little Redstone Presbyterian Church (C). Display/hide their locations on the map
Size of family households: 284 2-persons, 148 3-persons, 136 4-persons, 38 5-persons, 5 7-or-more-persons
Size of nonfamily households: 280 1-person, 55 2-persons
285 married couples with children.
73 single-parent households (27 men, 46 women).
98.8% of residents of 15442 zip code speak English at home.
1.1% of residents speak other Indo-European language at home (100% very well).
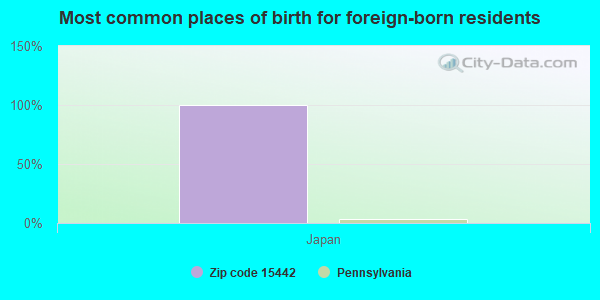
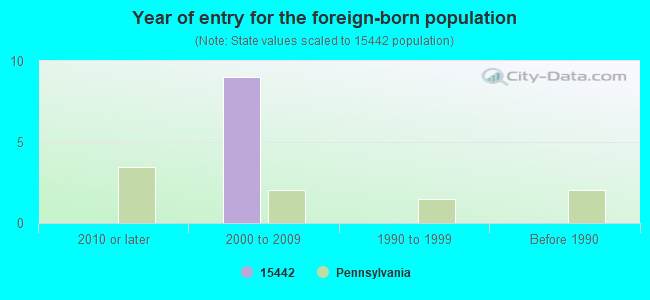
Foreign born population: 10 (0.5%) (100.0% of them are naturalized citizens)
This zip code:
0.5%
Whole state:
7.5%
100%Japan
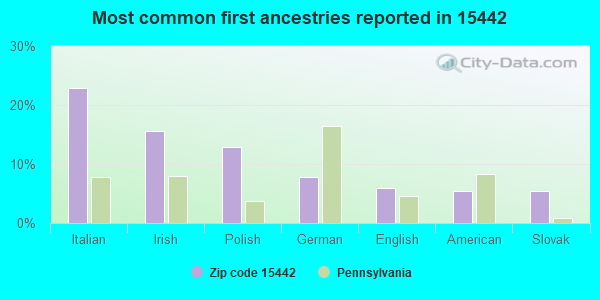
23%Italian
16%Irish
13%Polish
8%German
6%English
5%American
5%Slovak
Year of entry for the foreign-born population
02010 or later
92000 to 2009
01990 to 1999
0Before 1990
Facilities with environmental interests located in this zip code:
BROWNSVILLE AREA SCHOOL DISTRI (RD # 1 RTE 40 EAST in GRINDSTONE, PA)
(Integrated Compliance Information System) - ICIS-03-1986-0762, FORMAL ENFORCEMENT ACTION COMPLIANCE ACTIVITY (Tracking inspections of insecticide, fungicide, and rodenticide, and toxic substances) Business SIC classification: ELEMENTARY AND SECONDARY SCHOOLS Alternative names: BROWNSVILLE AREA SCHOOL DISTRICT
BROWNSVILLE AREA SCHOOL DIST (CENTRAL ELEMENTARY SCHOOL in GRINDSTONE, PA)
National Pollutant Discharge Elimination System NON-MAJOR (Tracking pollutant discharge elimination systems) - permit Business SIC classification: ELEMENTARY AND SECONDARY SCHOOLS Alternative names: CTL ELEM SCH
BROWNSVILLE AREA SCHOOL DIST (REDSTONE JUNIOR HIGH SCHOOL in GRINDSTONE, PA)
National Pollutant Discharge Elimination System NON-MAJOR (Tracking pollutant discharge elimination systems) - permit Business SIC classification: ELEMENTARY AND SECONDARY SCHOOLS
Housing units lacking complete plumbing facilities: 8.0% Housing units lacking complete kitchen facilities: 10.9%
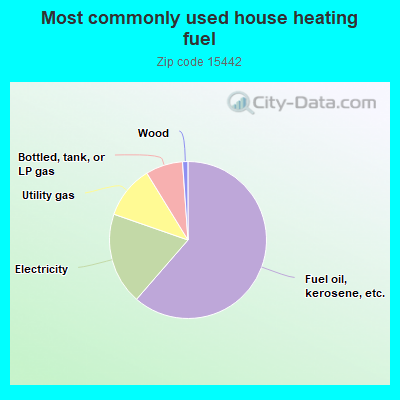
61.5%Fuel oil, kerosene, etc.
19.0%Electricity
10.9%Utility gas
7.7%Bottled, tank, or LP gas
1.1%Wood
Population in 1990: 6,843.
Place of birth for U.S.-born residents:
This state: 1,760
Northeast: 36
Midwest: 167
South: 74
West: 48
76% of the 15442 zip code residents lived in the same house 5 years ago. Out of people who lived in different houses, 82% lived in this county. Out of people who lived in different counties, 50% lived in Pennsylvania.
98% of the 15442 zip code residents lived in the same house 1 year ago. Out of people who lived in different houses, 73% moved from this county. Out of people who lived in different houses, 9% moved from different county within same state. Out of people who lived in different houses, 30% moved from different state.
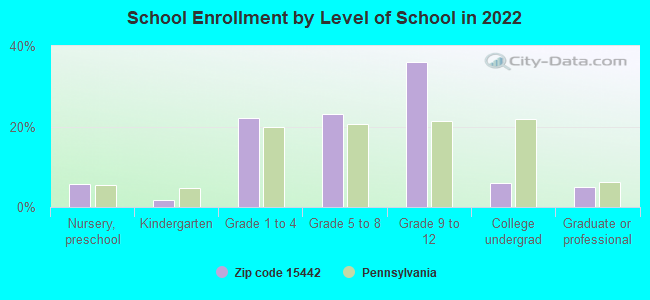
Private vs. public school enrollment:
Students in private schools in grades 1 to 8 (elementary and middle school): 28
Here:
22.1%
Pennsylvania:
15.7%
Students in private schools in grades 9 to 12 (high school):
Here:
0.0%
Pennsylvania:
13.4%
Students in private undergraduate colleges: 3
Here:
16.6%
Pennsylvania:
39.8%
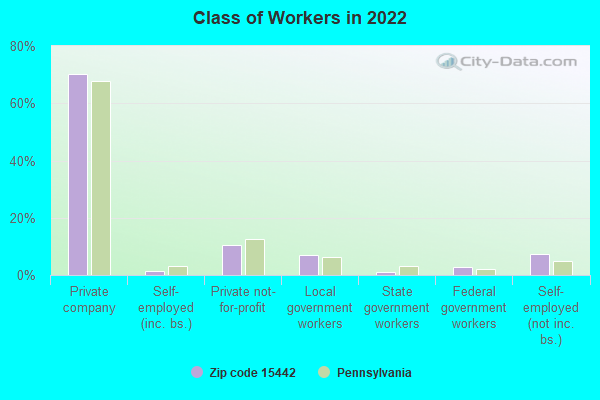
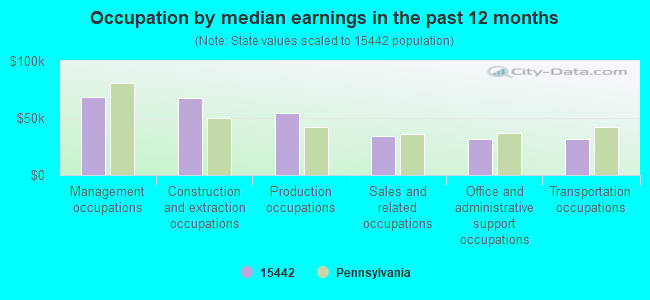
Occupation by median earnings in the past 12 months ($)
68,445Management occupations
67,480Construction and extraction occupations
54,093Production occupations
33,971Sales and related occupations
31,775Office and administrative support occupations
31,754Transportation occupations
Companies with federal contracts located in this zip code:
SHUMAR'S WELDING & MACHINE SER (414 STONE CHURCH RD in GRINDSTONE, PA; small business) : $467,856 in 3 contractsfrom 2005 to 2006
$401,460 with Navy for Trailers. Signed on 2006-02-22. Completion date: 2006-04-22.
$54,728, same as above.Signed on 2005-08-16. Completion date: 2005-11-15.
$11,668 with Navy for Miscellaneous Vehicular Components. Signed on 2005-08-12. Completion date: 2005-10-07.
Top industries in this zip code by the number of employees in 2005:
Administrative and Support and Waste Management and Remediation Services: Telephone Answering Services (250-499 employees: 1 establishment)
Other Services (except Public Administration): Commercial and Industrial Machinery and Equipment (except Automotive and Electronic) Repair and Maintenance (50-99: 1)
Health Care and Social Assistance: Nursing Care Facilities (50-99: 1)
Accommodation and Food Services: Limited-Service Restaurants (20-49: 1, 5-9: 1)
Accommodation and Food Services: Full-Service Restaurants (20-49: 1)
Finance and Insurance: Commercial Banking (5-9: 1)
Fatal accident statistics in 2014:
Fatal accident count: 1
Vehicles involved in fatal accidents: 2
Fatal accidents caused by drunken drivers: 1
Fatalities: 1
Persons involved in fatal accidents: 1
Pedestrians involved in fatal accidents: 0
Fatal accident statistics in 2013:
Fatal accident count: 1
Vehicles involved in fatal accidents: 2
Fatal accidents caused by drunken drivers: 0
Fatalities: 1
Persons involved in fatal accidents: 2
Pedestrians involved in fatal accidents: 0
Home Mortgage Disclosure Act Aggregated Statistics For Year 2009 (Based on 4 partial tracts)
A) FHA, FSA/RHS & VA Home Purchase Loans
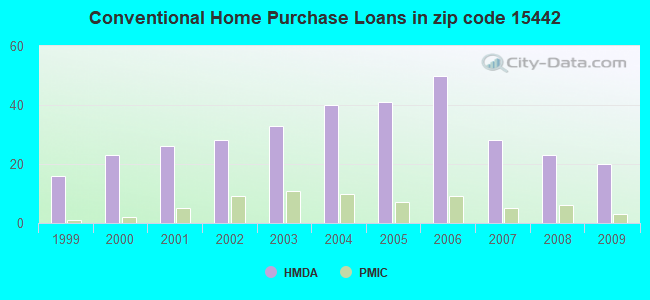
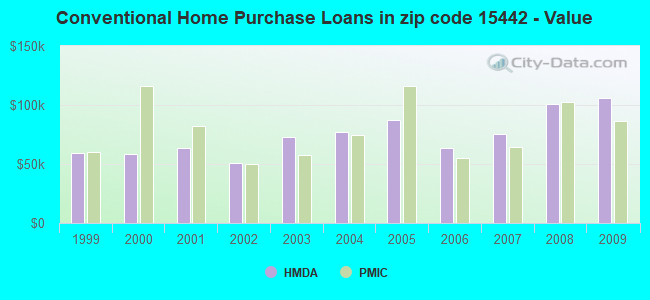
B) Conventional Home Purchase Loans
C) Refinancings
D) Home Improvement Loans
F) Non-occupant Loans on < 5 Family Dwellings (A B C & D)
G) Loans On Manufactured Home Dwelling (A B C & D)
Number
Average Value
Number
Average Value
Number
Average Value
Number
Average Value
Number
Average Value
Number
Average Value
LOANS ORIGINATED
13
$61,030
20
$105,796
51
$109,359
20
$21,409
6
$37,333
5
$95,906
APPLICATIONS APPROVED, NOT ACCEPTED
1
$40,980
1
$56,550
6
$81,618
1
$8,200
0
$0
0
$0
APPLICATIONS DENIED
4
$55,322
10
$62,349
37
$87,792
14
$21,856
4
$19,480
2
$78,680
APPLICATIONS WITHDRAWN
1
$46,500
6
$137,972
12
$69,366
2
$32,745
1
$42,620
1
$120,000
FILES CLOSED FOR INCOMPLETENESS
0
$0
2
$45,080
6
$102,583
2
$38,975
2
$87,375
0
$0
Aggregated Statistics For Year 2008 (Based on 4 partial tracts)
A) FHA, FSA/RHS & VA Home Purchase Loans
B) Conventional Home Purchase Loans
C) Refinancings
D) Home Improvement Loans
E) Loans on Dwellings For 5+ Families
F) Non-occupant Loans on < 5 Family Dwellings (A B C & D)
G) Loans On Manufactured Home Dwelling (A B C & D)
Number
Average Value
Number
Average Value
Number
Average Value
Number
Average Value
Number
Average Value
Number
Average Value
Number
Average Value
LOANS ORIGINATED
11
$73,275
23
$100,587
39
$98,852
21
$35,048
0
$0
5
$55,656
4
$96,538
APPLICATIONS APPROVED, NOT ACCEPTED
1
$41,800
5
$86,482
10
$81,874
4
$21,730
0
$0
1
$18,750
4
$89,048
APPLICATIONS DENIED
3
$97,923
15
$50,988
56
$79,570
22
$56,905
1
$40,980
3
$32,723
9
$75,961
APPLICATIONS WITHDRAWN
2
$119,660
2
$45,490
11
$111,501
2
$37,065
0
$0
0
$0
0
$0
FILES CLOSED FOR INCOMPLETENESS
1
$84,420
0
$0
6
$78,833
1
$61,470
0
$0
0
$0
0
$0
Aggregated Statistics For Year 2007 (Based on 4 partial tracts)
A) FHA, FSA/RHS & VA Home Purchase Loans
B) Conventional Home Purchase Loans
C) Refinancings
D) Home Improvement Loans
F) Non-occupant Loans on < 5 Family Dwellings (A B C & D)
G) Loans On Manufactured Home Dwelling (A B C & D)
Number
Average Value
Number
Average Value
Number
Average Value
Number
Average Value
Number
Average Value
Number
Average Value
LOANS ORIGINATED
6
$72,227
28
$75,563
71
$74,171
32
$35,709
6
$41,660
6
$55,208
APPLICATIONS APPROVED, NOT ACCEPTED
0
$0
6
$109,445
22
$70,004
5
$25,408
2
$89,745
2
$68,435
APPLICATIONS DENIED
2
$43,665
18
$56,702
106
$78,880
44
$33,308
5
$32,620
11
$46,270
APPLICATIONS WITHDRAWN
0
$0
6
$130,978
19
$70,108
4
$30,075
0
$0
1
$42,620
FILES CLOSED FOR INCOMPLETENESS
0
$0
1
$27,050
7
$96,656
0
$0
1
$44,260
0
$0
Aggregated Statistics For Year 2006 (Based on 4 partial tracts)
A) FHA, FSA/RHS & VA Home Purchase Loans
B) Conventional Home Purchase Loans
C) Refinancings
D) Home Improvement Loans
F) Non-occupant Loans on < 5 Family Dwellings (A B C & D)
G) Loans On Manufactured Home Dwelling (A B C & D)
Number
Average Value
Number
Average Value
Number
Average Value
Number
Average Value
Number
Average Value
Number
Average Value
LOANS ORIGINATED
3
$73,057
50
$63,572
76
$57,877
31
$29,168
6
$30,578
5
$81,884
APPLICATIONS APPROVED, NOT ACCEPTED
1
$32,250
8
$85,480
21
$78,267
6
$44,283
1
$40,980
2
$19,670
APPLICATIONS DENIED
0
$0
19
$59,603
103
$68,458
26
$23,686
6
$44,962
9
$58,888
APPLICATIONS WITHDRAWN
1
$20,490
7
$100,491
43
$74,521
5
$21,222
1
$45,080
1
$45,080
FILES CLOSED FOR INCOMPLETENESS
0
$0
0
$0
7
$97,336
0
$0
0
$0
0
$0
Aggregated Statistics For Year 2005 (Based on 4 partial tracts)
A) FHA, FSA/RHS & VA Home Purchase Loans
B) Conventional Home Purchase Loans
C) Refinancings
D) Home Improvement Loans
F) Non-occupant Loans on < 5 Family Dwellings (A B C & D)
G) Loans On Manufactured Home Dwelling (A B C & D)
Number
Average Value
Number
Average Value
Number
Average Value
Number
Average Value
Number
Average Value
Number
Average Value
LOANS ORIGINATED
3
$43,940
41
$87,498
90
$70,994
36
$36,012
8
$47,458
10
$47,685
APPLICATIONS APPROVED, NOT ACCEPTED
2
$45,405
5
$54,798
25
$67,254
6
$68,210
1
$25,410
2
$45,080
APPLICATIONS DENIED
1
$20,250
27
$132,818
140
$69,694
50
$22,619
6
$43,192
14
$54,123
APPLICATIONS WITHDRAWN
1
$141,790
7
$171,324
49
$83,254
10
$83,832
3
$51,327
3
$70,750
FILES CLOSED FOR INCOMPLETENESS
0
$0
2
$77,375
4
$76,632
1
$35,240
1
$4,920
0
$0
Aggregated Statistics For Year 2004 (Based on 4 partial tracts)
A) FHA, FSA/RHS & VA Home Purchase Loans
B) Conventional Home Purchase Loans
C) Refinancings
D) Home Improvement Loans
F) Non-occupant Loans on < 5 Family Dwellings (A B C & D)
G) Loans On Manufactured Home Dwelling (A B C & D)
Number
Average Value
Number
Average Value
Number
Average Value
Number
Average Value
Number
Average Value
Number
Average Value
LOANS ORIGINATED
7
$62,521
40
$76,720
94
$67,894
31
$26,415
13
$29,158
5
$47,124
APPLICATIONS APPROVED, NOT ACCEPTED
2
$80,850
11
$64,526
34
$73,299
9
$40,184
2
$73,420
6
$43,137
APPLICATIONS DENIED
0
$0
25
$55,757
173
$67,257
43
$24,388
13
$38,998
21
$60,661
APPLICATIONS WITHDRAWN
0
$0
6
$123,263
69
$69,861
9
$32,921
2
$51,225
3
$61,910
FILES CLOSED FOR INCOMPLETENESS
0
$0
1
$33,600
12
$89,643
1
$26,250
0
$0
0
$0
Aggregated Statistics For Year 2003 (Based on 4 partial tracts)
A) FHA, FSA/RHS & VA Home Purchase Loans
B) Conventional Home Purchase Loans
C) Refinancings
D) Home Improvement Loans
F) Non-occupant Loans on < 5 Family Dwellings (A B C & D)
Number
Average Value
Number
Average Value
Number
Average Value
Number
Average Value
Number
Average Value
LOANS ORIGINATED
5
$39,026
33
$72,674
115
$68,965
37
$25,317
6
$29,295
APPLICATIONS APPROVED, NOT ACCEPTED
0
$0
5
$53,262
38
$65,342
14
$28,766
3
$31,667
APPLICATIONS DENIED
1
$51,630
19
$43,530
136
$62,562
31
$20,227
6
$34,130
APPLICATIONS WITHDRAWN
1
$17,210
3
$82,493
45
$65,170
4
$11,475
1
$30,000
FILES CLOSED FOR INCOMPLETENESS
0
$0
2
$20,080
6
$45,435
2
$20,080
1
$33,600
Aggregated Statistics For Year 2002 (Based on 4 partial tracts)
A) FHA, FSA/RHS & VA Home Purchase Loans
B) Conventional Home Purchase Loans
C) Refinancings
D) Home Improvement Loans
F) Non-occupant Loans on < 5 Family Dwellings (A B C & D)
Number
Average Value
Number
Average Value
Number
Average Value
Number
Average Value
Number
Average Value
LOANS ORIGINATED
4
$34,575
28
$50,806
93
$56,562
20
$18,110
4
$24,910
APPLICATIONS APPROVED, NOT ACCEPTED
1
$12,750
7
$67,267
33
$66,496
2
$42,210
1
$25,410
APPLICATIONS DENIED
2
$43,100
13
$71,628
97
$75,286
33
$16,126
1
$48,000
APPLICATIONS WITHDRAWN
0
$0
4
$90,770
60
$60,267
6
$17,605
1
$20,490
FILES CLOSED FOR INCOMPLETENESS
0
$0
3
$49,250
13
$71,624
1
$20,490
4
$52,125
Aggregated Statistics For Year 2001 (Based on 4 partial tracts)
A) FHA, FSA/RHS & VA Home Purchase Loans
B) Conventional Home Purchase Loans
C) Refinancings
D) Home Improvement Loans
E) Loans on Dwellings For 5+ Families
F) Non-occupant Loans on < 5 Family Dwellings (A B C & D)
Number
Average Value
Number
Average Value
Number
Average Value
Number
Average Value
Number
Average Value
Number
Average Value
LOANS ORIGINATED
7
$45,807
26
$63,444
85
$61,800
34
$26,200
1
$28,690
6
$45,083
APPLICATIONS APPROVED, NOT ACCEPTED
0
$0
10
$39,651
40
$51,158
9
$20,709
0
$0
2
$21,265
APPLICATIONS DENIED
2
$56,550
17
$38,134
88
$47,880
29
$16,009
0
$0
4
$38,600
APPLICATIONS WITHDRAWN
0
$0
6
$51,573
35
$56,010
5
$18,012
0
$0
0
$0
FILES CLOSED FOR INCOMPLETENESS
0
$0
0
$0
4
$68,248
1
$820
0
$0
0
$0
Aggregated Statistics For Year 2000 (Based on 4 partial tracts)
A) FHA, FSA/RHS & VA Home Purchase Loans
B) Conventional Home Purchase Loans
C) Refinancings
D) Home Improvement Loans
F) Non-occupant Loans on < 5 Family Dwellings (A B C & D)
Number
Average Value
Number
Average Value
Number
Average Value
Number
Average Value
Number
Average Value
LOANS ORIGINATED
5
$52,638
23
$58,683
51
$52,003
27
$17,452
4
$58,925
APPLICATIONS APPROVED, NOT ACCEPTED
0
$0
8
$40,309
15
$51,596
5
$20,928
0
$0
APPLICATIONS DENIED
1
$40,160
24
$37,673
62
$43,680
36
$16,990
2
$16,390
APPLICATIONS WITHDRAWN
0
$0
2
$41,800
24
$63,207
2
$12,705
0
$0
FILES CLOSED FOR INCOMPLETENESS
0
$0
1
$18,000
4
$50,250
0
$0
0
$0
Aggregated Statistics For Year 1999 (Based on 2 partial tracts)
A) FHA, FSA/RHS & VA Home Purchase Loans
B) Conventional Home Purchase Loans
C) Refinancings
D) Home Improvement Loans
F) Non-occupant Loans on < 5 Family Dwellings (A B C & D)
Detailed PMIC statistics for the following Tracts:2611.00
, 2614.00
2004 - 2018 National Fire Incident Reporting System (NFIRS) incidents
Based on the data from the years 2004 - 2018 the average number of fire incidents per year is 8. The highest number of fires - 20 took place in 2005, and the least - 1 in 2008. The data has a rising trend.
When looking into fire subcategories, the most reports belonged to: Structure Fires (74.8%), and Outside Fires (12.6%).
Fire incident types reported to NFIRS in Zip Code 15442


 Nearest zip codes: 15413, 15422, 15473, 15438, 15419, 15477.


 Based on the data from the years 2004 - 2018 the average number of fire incidents per year is 8. The highest number of fires - 20 took place in 2005, and the least - 1 in 2008. The data has a rising trend.
 When looking into fire subcategories, the most reports belonged to: Structure Fires (74.8%), and Outside Fires (12.6%).