Estimated zip code population in 2022: 17,140 Zip code population in 2010: 16,778 Zip code population in 2000: 14,026
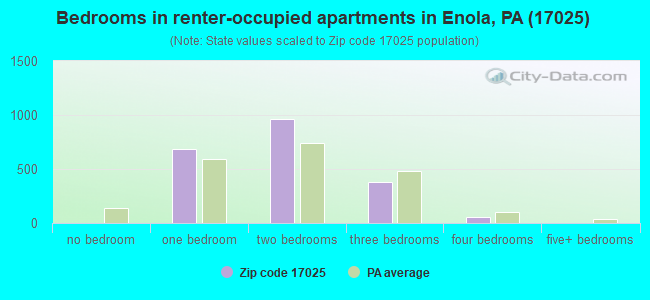
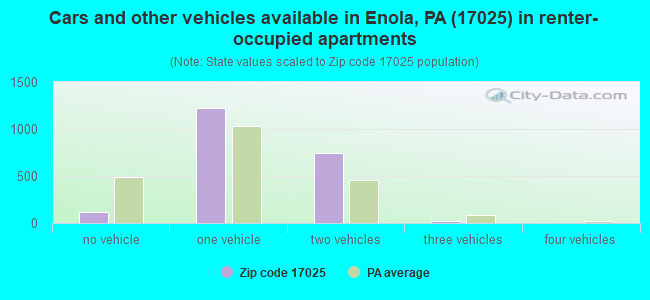
Houses and condos: 7,654 Renter-occupied apartments: 2,091
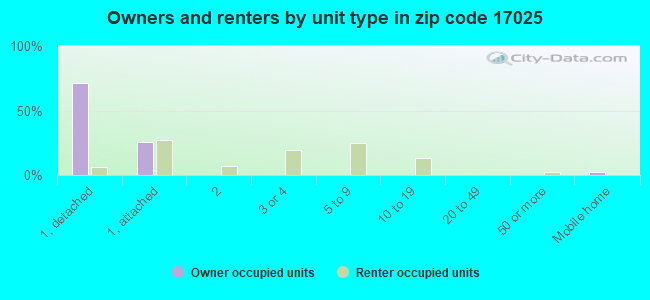
% of renters here:
28%
State:
31%
March 2022 cost of living index in zip code 17025: 95.7 (near average, U.S. average is 100)
Land area: 15.1 sq. mi. Water area: 0.1 sq. mi.
Population density: 1,136 people per square mile
(low).
OSM Map
General Map
Google Map
MSN Map
OSM Map
General Map
Google Map
MSN Map
OSM Map
General Map
Google Map
MSN Map
OSM Map
General Map
Google Map
MSN Map
Please wait while loading the map...
Real estate property taxes paid for housing units in 2022:
This zip code:
1.1% ($2,706)
Pennsylvania:
1.3% ($3,094)
Median real estate property taxes paid for housing units with mortgages in 2022: $2,727 (1.1%) Median real estate property taxes paid for housing units with no mortgage in 2022: $2,664 (1.1%)
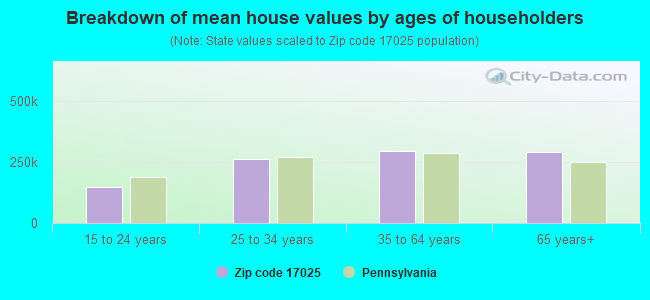
Estimated median house/condo value in 2022: $251,686
17025:
$251,686
Pennsylvania:
$245,500
According to our research of Pennsylvania and other state lists, there were 24 registered sex offenders living in 17025 zip code as of April 27, 2024. The ratio of all residents to sex offenders in zip code 17025 is 720 to 1. The ratio of registered sex offenders to all residents in this zip code is lower than the state average.
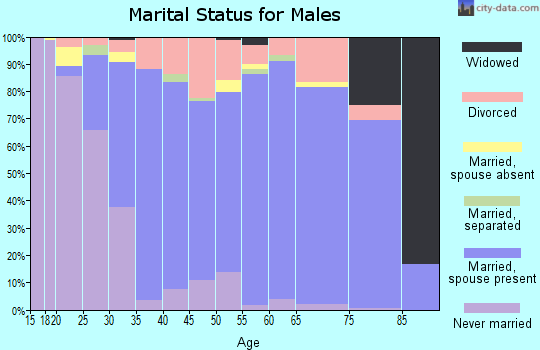
Median resident age:
This zip code:
40.6 years
Pennsylvania median age:
40.9 years
Average household size:
This zip code:
2.2 people
Pennsylvania:
2.4 people
Averages for the 2020 tax year for zip code 17025, filed in 2021:
Average Adjusted Gross Income (AGI) in 2020: $74,561 (Individual Income Tax Returns)
Here:
$74,561
State:
$75,707
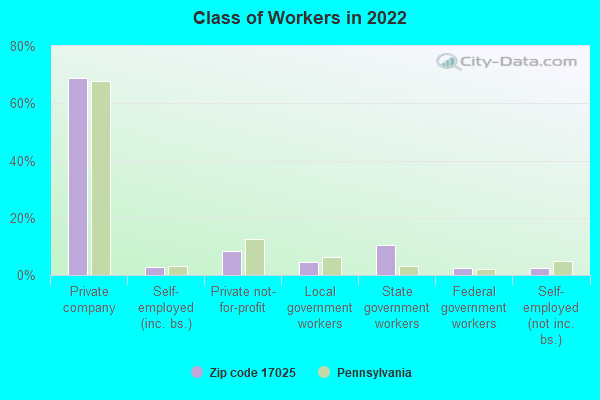
Salary/wage: $64,904 (reported on 81.6% of returns)
Here:
$64,904
State:
$62,806
(% of AGI for various income ranges: 1026.6% for AGIs below $25k, 3405.3% for AGIs $25k-50k, 5929.3% for AGIs $50k-75k, 8996.9% for AGIs $75k-100k, 16440.5% for AGIs $100k-200k, 78170.0% for AGIs over 200k)
Taxable interest for individuals: $1,362 (reported on 32.5% of returns)
This zip code:
$1,362
Pennsylvania:
$1,633
(% of AGI for various income ranges: 13.9% for AGIs below $25k, 18.8% for AGIs $25k-50k, 35.2% for AGIs $50k-75k, 80.4% for AGIs $75k-100k, 93.5% for AGIs $100k-200k, 1065.9% for AGIs over 200k)
Ordinary dividends: $4,028 (reported on 20.3% of returns)
Here:
$4,028
State:
$7,382
(% of AGI for various income ranges: 18.9% for AGIs below $25k, 21.0% for AGIs $25k-50k, 47.7% for AGIs $50k-75k, 72.9% for AGIs $75k-100k, 218.2% for AGIs $100k-200k, 2420.6% for AGIs over 200k)
Net capital gain/loss in AGI: +$12,966 (reported on 17.2% of returns)
Here:
+$12,966
State:
+$23,522
(% of AGI for various income ranges: 12.1% for AGIs below $25k, 33.5% for AGIs $25k-50k, 34.2% for AGIs $50k-75k, 95.7% for AGIs $75k-100k, 392.3% for AGIs $100k-200k, 9748.8% for AGIs over 200k)
Profit/loss from business: +$12,893 (reported on 11.2% of returns)
Here:
+$12,893
State:
+$16,274
(% of AGI for various income ranges: 82.0% for AGIs below $25k, 110.3% for AGIs $25k-50k, 152.0% for AGIs $50k-75k, 195.7% for AGIs $75k-100k, 329.8% for AGIs $100k-200k, 2298.2% for AGIs over 200k)
Taxable individual retirement arrangement distribution: $15,680 (reported on 11.0% of returns)
17025:
$15,680
Pennsylvania:
$18,583
(% of AGI for various income ranges: 92.9% for AGIs below $25k, 101.0% for AGIs $25k-50k, 187.3% for AGIs $50k-75k, 319.7% for AGIs $75k-100k, 537.7% for AGIs $100k-200k, 1925.3% for AGIs over 200k)
Self-employed (Keogh) retirement plans: $26,725 (reported on 0.4% of returns)
17025:
$26,725
Pennsylvania:
$25,407
(% of AGI for various income ranges: 628.8% for AGIs over 200k)
Total itemized deductions: $30,234 (reported on 6.4% of returns)
Here:
$30,234
State:
$34,850
(% of AGI for various income ranges: 32.7% for AGIs below $25k, 72.9% for AGIs $25k-50k, 141.3% for AGIs $50k-75k, 352.3% for AGIs $75k-100k, 551.7% for AGIs $100k-200k, 4378.8% for AGIs over 200k)
Charity contributions: $9,244 (reported on 4.7% of returns)
Here:
$9,244
State:
$12,392
(% of AGI for various income ranges: 8.4% for AGIs $25k-50k, 14.2% for AGIs $50k-75k, 59.2% for AGIs $75k-100k, 130.9% for AGIs $100k-200k, 1366.5% for AGIs over 200k)
Taxes paid: $8,148 (reported on 6.4% of returns)
17025:
$8,148
State:
$8,200
(% of AGI for various income ranges: 16.7% for AGIs $25k-50k, 38.0% for AGIs $50k-75k, 111.9% for AGIs $75k-100k, 176.5% for AGIs $100k-200k, 1073.5% for AGIs over 200k)
Earned income credit: $2,054 (reported on 10.1% of returns)
Here:
$2,054
State:
$2,100
(% of AGI for various income ranges: 59.3% for AGIs below $25k, 47.4% for AGIs $25k-50k, 1.0% for AGIs $50k-75k)
Percentage of individuals using paid preparers for their 2020 taxes: 93.4%
Here:
93%
State:
92%
(% for various income ranges: 91.9% for AGIs below $25k, 93.9% for AGIs $25k-50k, 93.8% for AGIs $50k-75k, 93.5% for AGIs $75k-100k, 94.2% for AGIs $100k-200k, 94.0% for AGIs over 200k)
Averages for the 2012 tax year for zip code 17025, filed in 2013:
Average Adjusted Gross Income (AGI) in 2012: $59,814 (Individual Income Tax Returns)
Here:
$59,814
State:
$61,346
Salary/wage: $54,672 (reported on 84.2% of returns)
Here:
$54,672
State:
$51,902
(% of AGI for various income ranges: 69.6% for AGIs below $25k, 80.0% for AGIs $25k-50k, 77.9% for AGIs $50k-75k, 77.8% for AGIs $75k-100k, 83.6% for AGIs $100k-200k, 67.4% for AGIs over 200k)
Taxable interest for individuals: $852 (reported on 40.7% of returns)
This zip code:
$852
Pennsylvania:
$1,588
(% of AGI for various income ranges: 1.1% for AGIs below $25k, 0.6% for AGIs $25k-50k, 0.6% for AGIs $50k-75k, 0.4% for AGIs $75k-100k, 0.4% for AGIs $100k-200k, 0.7% for AGIs over 200k)
Ordinary dividends: $2,959 (reported on 21.7% of returns)
Here:
$2,959
State:
$5,827
(% of AGI for various income ranges: 1.3% for AGIs below $25k, 0.7% for AGIs $25k-50k, 0.7% for AGIs $50k-75k, 0.8% for AGIs $75k-100k, 0.8% for AGIs $100k-200k, 2.1% for AGIs over 200k)
Net capital gain/loss in AGI: +$8,196 (reported on 14.0% of returns)
Here:
+$8,196
State:
+$14,495
(% of AGI for various income ranges: 0.3% for AGIs $75k-100k, 1.2% for AGIs $100k-200k, 7.6% for AGIs over 200k)
Profit/loss from business: +$11,654 (reported on 10.7% of returns)
Here:
+$11,654
State:
+$16,268
(% of AGI for various income ranges: 4.4% for AGIs below $25k, 1.7% for AGIs $25k-50k, 2.0% for AGIs $50k-75k, 1.6% for AGIs $75k-100k, 1.8% for AGIs $100k-200k, 2.5% for AGIs over 200k)
Taxable individual retirement arrangement distribution: $11,322 (reported on 11.0% of returns)
17025:
$11,322
Pennsylvania:
$14,550
(% of AGI for various income ranges: 4.1% for AGIs below $25k, 2.2% for AGIs $25k-50k, 2.4% for AGIs $50k-75k, 2.7% for AGIs $75k-100k, 2.0% for AGIs $100k-200k, 0.7% for AGIs over 200k)
Self-employment retirement plans: $23,750 (reported on 0.4% of returns)
17025:
$23,750
Pennsylvania:
$20,922
(% of AGI for various income ranges: 0.7% for AGIs $100k-200k)
Total itemized deductions: $19,888 (18% of AGI, reported on 34.0% of returns)
Here:
$19,888
State:
$23,538
Here:
17.8% of AGI
State:
18.4% of AGI
(% of AGI for various income ranges: 6.5% for AGIs below $25k, 8.4% for AGIs $25k-50k, 10.7% for AGIs $50k-75k, 12.8% for AGIs $75k-100k, 14.2% for AGIs $100k-200k, 10.9% for AGIs over 200k)
Charity contributions: $2,920 (reported on 26.7% of returns)
Here:
$2,920
State:
$4,025
(% of AGI for various income ranges: 0.6% for AGIs below $25k, 0.8% for AGIs $25k-50k, 1.1% for AGIs $50k-75k, 1.3% for AGIs $75k-100k, 1.8% for AGIs $100k-200k, 1.5% for AGIs over 200k)
Taxes paid: $8,125 (reported on 33.9% of returns)
17025:
$8,125
State:
$9,982
(% of AGI for various income ranges: 1.2% for AGIs below $25k, 2.4% for AGIs $25k-50k, 3.8% for AGIs $50k-75k, 4.9% for AGIs $75k-100k, 6.2% for AGIs $100k-200k, 5.9% for AGIs over 200k)
Earned income credit: $1,793 (reported on 12.1% of returns)
Here:
$1,793
State:
$2,106
(% of AGI for various income ranges: 3.9% for AGIs below $25k, 0.7% for AGIs $25k-50k)
Percentage of individuals using paid preparers for their 2012 taxes: 42.6%
Here:
43%
State:
53%
(% for various income ranges: 37.1% for AGIs below $25k, 40.8% for AGIs $25k-50k, 45.8% for AGIs $50k-75k, 44.9% for AGIs $75k-100k, 48.1% for AGIs $100k-200k, 78.3% for AGIs over 200k)
Averages for the 2004 tax year for zip code 17025, filed in 2005:
Average Adjusted Gross Income (AGI) in 2004: $45,903 (Individual Income Tax Returns)
Here:
$45,903
State:
$48,049
Salary/wage: $43,713 (reported on 87.2% of returns)
Here:
$43,713
State:
$42,646
(% of AGI for various income ranges: 101.1% for AGIs below $10k, 73.1% for AGIs $10k-25k, 84.0% for AGIs $25k-50k, 85.8% for AGIs $50k-75k, 89.2% for AGIs $75k-100k, 77.4% for AGIs over 100k)
Taxable interest for individuals: $938 (reported on 52.5% of returns)
This zip code:
$938
Pennsylvania:
$1,657
(% of AGI for various income ranges: 5.2% for AGIs below $10k, 2.0% for AGIs $10k-25k, 1.0% for AGIs $25k-50k, 0.8% for AGIs $50k-75k, 0.6% for AGIs $75k-100k, 1.2% for AGIs over 100k)
Taxable dividends: $1,428 (reported on 24.8% of returns)
Here:
$1,428
State:
$3,566
(% of AGI for various income ranges: 2.2% for AGIs below $10k, 0.9% for AGIs $10k-25k, 0.6% for AGIs $25k-50k, 0.6% for AGIs $50k-75k, 0.6% for AGIs $75k-100k, 1.1% for AGIs over 100k)
Net capital gain/loss: +$3,956 (reported on 16.9% of returns)
Here:
+$3,956
State:
+$9,716
(% of AGI for various income ranges: -0.3% for AGIs below $10k, -0.2% for AGIs $10k-25k, 0.3% for AGIs $25k-50k, 0.7% for AGIs $50k-75k, 0.6% for AGIs $75k-100k, 4.2% for AGIs over 100k)
Profit/loss from business: +$7,894 (reported on 10.1% of returns)
Here:
+$7,894
State:
+$14,267
(% of AGI for various income ranges: 3.0% for AGIs below $10k, 2.7% for AGIs $10k-25k, 1.7% for AGIs $25k-50k, 1.2% for AGIs $50k-75k, 1.3% for AGIs $75k-100k, 2.2% for AGIs over 100k)
IRA payment deduction: $2,713 (reported on 2.0% of returns)
17025:
$2,713
Pennsylvania:
$2,903
(% of AGI for various income ranges: 0.2% for AGIs $10k-25k, 0.2% for AGIs $25k-50k, 0.1% for AGIs $50k-75k, 0.1% for AGIs $75k-100k, 0.1% for AGIs over 100k)
Self-employed pension: $12,519 (reported on 0.3% of returns)
Here:
$12,519
Pennsylvania:
$14,674
Total itemized deductions: $15,479 (20% of AGI, reported on 36.7% of returns)
Here:
$15,479
State:
$18,804
Here:
19.8% of AGI
State:
19.5% of AGI
(% of AGI for various income ranges: 11.4% for AGIs below $10k, 6.6% for AGIs $10k-25k, 9.7% for AGIs $25k-50k, 13.3% for AGIs $50k-75k, 15.4% for AGIs $75k-100k, 13.3% for AGIs over 100k)
Charity contributions deductions: $2,214 (3% of AGI, reported on 31.3% of returns)
Here:
$2,214
State:
$3,337
Here:
2.7% of AGI
State:
3.3% of AGI
(% of AGI for various income ranges: 0.5% for AGIs below $10k, 0.8% for AGIs $10k-25k, 1.1% for AGIs $25k-50k, 1.4% for AGIs $50k-75k, 1.8% for AGIs $75k-100k, 2.0% for AGIs over 100k)
Total tax: $6,176 (reported on 79.9% of returns)
17025:
$6,176
State:
$8,008
(% of AGI for various income ranges: 2.0% for AGIs below $10k, 4.4% for AGIs $10k-25k, 7.6% for AGIs $25k-50k, 9.2% for AGIs $50k-75k, 10.3% for AGIs $75k-100k, 17.2% for AGIs over 100k)
Earned income credit: $1,482 (reported on 9.6% of returns)
Here:
$1,482
State:
$1,643
Percentage of individuals using paid preparers for their 2004 taxes: 47.1%
Here:
47%
State:
56%
(% for various income ranges: 41.7% for AGIs below $10k, 48.8% for AGIs $10k-25k, 48.0% for AGIs $25k-50k, 49.2% for AGIs $50k-75k, 44.3% for AGIs $75k-100k, 50.7% for AGIs over 100k)
Likely homosexual households (counted as self-reported same-sex unmarried-partner households)
Lesbian couples: 0.2% of all households
Gay men: 0.0% of all households
Household received Food Stamps/SNAP in the past 12 months: 483 Household did not receive Food Stamps/SNAP in the past 12 months: 7,001
Women who had a birth in the past 12 months: 184 (189 now married, 6 unmarried) Women who did not have a birth in the past 12 months: 3,638 (1,688 now married, 1,942 unmarried)
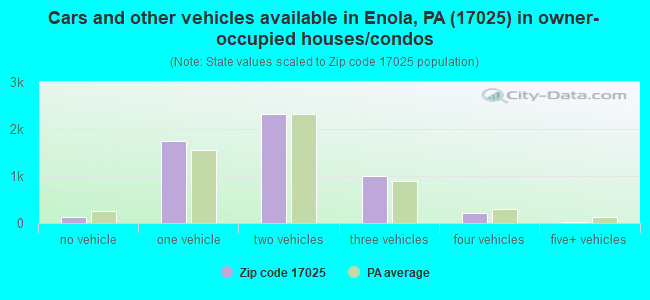
Housing units in zip code 17025 with a mortgage: 3,795 (687 second mortgage, 49 home equity loan, 511 both second mortgage and home equity loan) Houses without a mortgage: 201
Median monthly owner costs for units with a mortgage: $1,411 Median monthly owner costs for units without a mortgage: $572
Residents with income below the poverty level in 2022:
This zip code:
5.9%
Whole state:
11.8%
Residents with income below 50% of the poverty level in 2022:
This zip code:
3.6%
Whole state:
6.1%
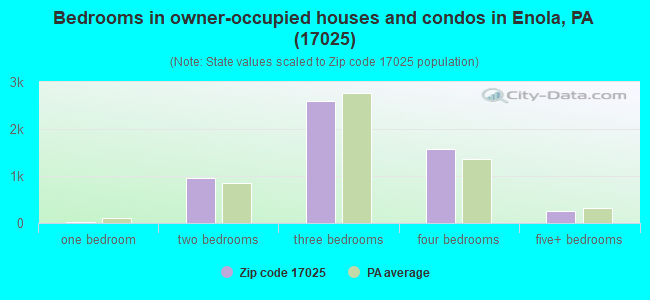
Median number of rooms in houses and condos:
Here:
6.7
State:
6.8
Median number of rooms in apartments:
Here:
4.3
State:
4.3
Notable locations in this zip code not listed on our city pages
Notable locations in zip code 17025: Enola Yards (A), Summerdale Plaza (B), Midway Fire Company 2 Station 17 (C), West Enola Fire Company Station 19 (D), Summerdale Fire Company Station 20 (E), West Wing (F), Valley Road Building (G), Todd Hall Apartments (H), Teri Hall Apartments (I), Kids on Campus Child Development Center (J), Kathl Hall Apartments (K), Gale Hall Apartments (L), Fred Hall Apartments (M), Charles T Jones Library (N), Boyer and Farmhouse and Barn (O), Bollinger Hall (P), Bart A Milano Hall (Q), Anne Hall Apartments (R), Advanced Technology Education Center (S), Goodwill Fire Company 1 Station 16 (T). Display/hide their locations on the map
Churches in zip code 17025 include: Alliance Church (A), Mount Zion United Methodist Church (B), Saint Pauls Church (C). Display/hide their locations on the map
In group quarters: 299 (-1 institutionalized population)
Size of family households: 2,044 2-persons, 1,163 3-persons, 813 4-persons, 339 5-persons, 48 6-persons, 17 7-or-more-persons
Size of nonfamily households: 2,458 1-person, 588 2-persons, 55 3-persons
2,384 married couples with children.
680 single-parent households (115 men, 565 women).
87.3% of residents of 17025 zip code speak English at home.
4.3% of residents speak Spanish at home (50% very well, 27% well, 23% not well).
5.4% of residents speak other Indo-European language at home (90% very well, 7% well, 3% not well).
1.4% of residents speak Asian or Pacific Island language at home (73% very well, 27% well).
1.2% of residents speak other language at home (93% very well, 7% not well).
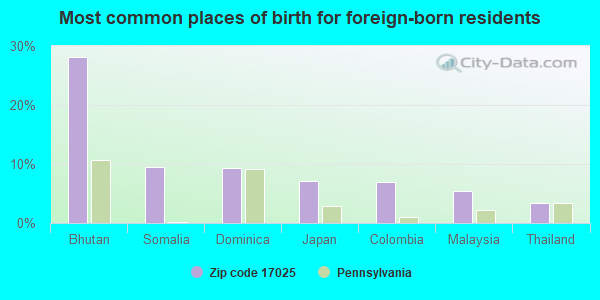
Foreign born population: 1,419 (8.3%) (58.1% of them are naturalized citizens)
This zip code:
8.3%
Whole state:
7.5%
28%Bhutan
9%Somalia
9%Dominica
7%Japan
7%Colombia
6%Malaysia
3%Thailand
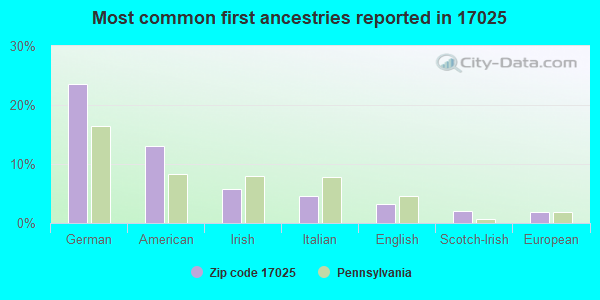
24%German
13%American
6%Irish
5%Italian
3%English
2%Scotch-Irish
2%European
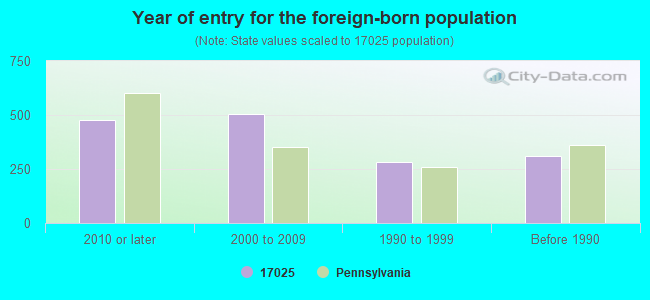
Year of entry for the foreign-born population
4752010 or later
5052000 to 2009
2841990 to 1999
308Before 1990
Facilities with environmental interests located in this zip code:
BROWN LL MFG (348 SAMPLE BRIDGE RD in ENOLA, PA)
STATE MASTER (Pennsylvania database) - RCRIS-PAD094222254, HAZARDOUS WASTE PROGRAM Small Quantity Generators, between 100 kg and 1000 kg of hazardous waste/month (Resource Conservation and Recovery Act (tracking hazardous waste)) - notification Business SIC classification: INDUSTRIAL AND COMMERCIAL MACHINERY AND EQUIPMENT Organizations: OPERNAME (CONTACT/OPERATOR)
, BROWN, LL (CONTACT/OWNER)
Alternative names: BROWN L L CORP
BRUNER'S SUNOCO (611 N. ENOLA RD. in ENOLA, PA)
AIR MINOR (AIRS/AFS) (Resource Conservation and Recovery Act (tracking hazardous waste)) Business SIC classification: AUTOMOTIVE REPAIR SHOPS Organizations: OPERNAME (CONTACT/OPERATOR)
, SUN OIL COMPANY OF PA (CONTACT/OWNER)
Alternative names: SUNOCO SERVICE STATION-ENOLA
Housing units lacking complete plumbing facilities: 0.3% Housing units lacking complete kitchen facilities: 0.7%
41.8%Utility gas
40.1%Electricity
11.2%Fuel oil, kerosene, etc.
2.1%Bottled, tank, or LP gas
1.5%Wood
1.0%Solar energy
0.9%No fuel used
0.7%Other fuel
0.7%Coal or coke
Population in 1990: 13,103. Population change in the 1990s: +923 (+7.0%).
Place of birth for U.S.-born residents:
This state: 12,668
Northeast: 1,294
Midwest: 466
South: 842
West: 247
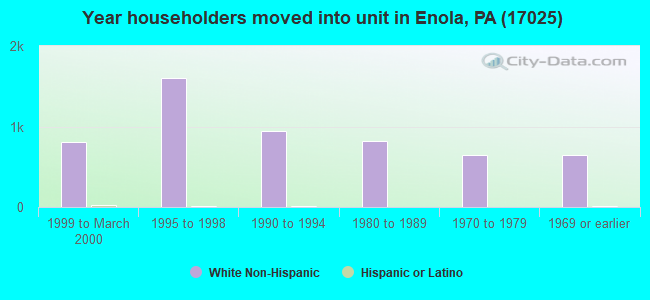
59% of the 17025 zip code residents lived in the same house 5 years ago. Out of people who lived in different houses, 52% lived in this county. Out of people who lived in different counties, 50% lived in Pennsylvania.
95% of the 17025 zip code residents lived in the same house 1 year ago. Out of people who lived in different houses, 50% moved from this county. Out of people who lived in different houses, 31% moved from different county within same state. Out of people who lived in different houses, 17% moved from different state. Out of people who lived in different houses, 6% moved from abroad.
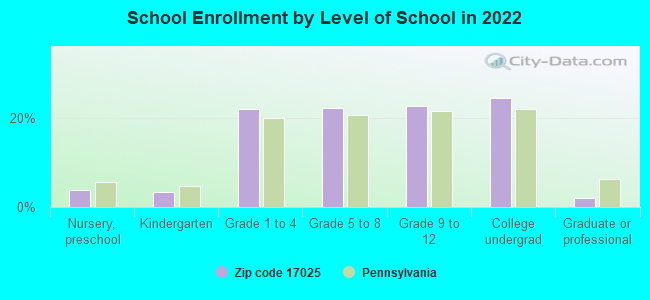
Private vs. public school enrollment:
Students in private schools in grades 1 to 8 (elementary and middle school): 145
Here:
9.1%
Pennsylvania:
15.7%
Students in private schools in grades 9 to 12 (high school): 52
Here:
6.4%
Pennsylvania:
13.4%
Students in private undergraduate colleges: 362
Here:
40.4%
Pennsylvania:
39.8%
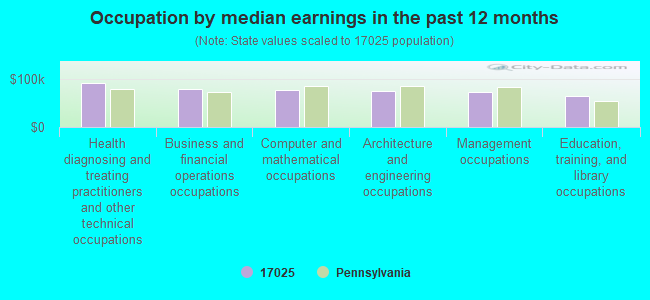
Occupation by median earnings in the past 12 months ($)
91,328Health diagnosing and treating practitioners and other technical occupations
78,423Business and financial operations occupations
77,724Computer and mathematical occupations
74,522Architecture and engineering occupations
72,349Management occupations
64,652Education, training, and library occupations
Companies with federal contracts located in this zip code:
HERRE BROS , INC (4417 VALLEY ROAD in ENOLA, PA) : $3,308,128 in 12 contractsfrom 2000 to 2006
Contracts for Maintenance, Repair or Alteration of Real Property -- Other Hospital Buildings, Maintenance, Repair or Alteration of Real Property -- Other Warehouse Buildings, Maintenance, Repair or Alteration of Real Property -- Office Buildings, Maintenance, Repair or Alteration of Real Property -- Miscellaneous Buildings by Department of Veterans Affairs, Army, Defense Logistics Agency Signed by year:2000: $148,727; 2001: $349,170; 2002: $54,853; 2003: $0; 2004: $2,489,245; 2005: $103,485; 2006: $162,648.
Biggest contracts:
$1,900,900 with Department of Veterans Affairs for Maintenance, Repair or Alteration of Real Property -- Other Hospital Buildings. Signed on 2004-09-10. Completion date: 2005-10-10.
$588,345 with Army for Maintenance, Repair or Alteration of Real Property -- Other Warehouse Buildings. Signed on 2004-09-22. Completion date: 2005-07-11.
$349,170 with Army for Maintenance, Repair or Alteration of Real Property -- Office Buildings. Signed on 2001-09-25. Completion date: 2002-04-23.
$148,727 with Army for Maintenance, Repair or Alteration of Real Property -- Other Warehouse Buildings. Signed on 2000-09-18. Completion date: 2001-02-15.
LANGENDIJK APPRAISLES (34 RIVERVIEW DR in ENOLA, PA; small business) : $118,580 in 6 contractsfrom 2004 to 2006
Contracts for Real Property Appraisals Services (SIC 6531) by Army, U.S. Army Corps of Engineers - civil program financing only Signed by year:2000: $0; 2001: $0; 2002: $0; 2003: $0; 2004: $8,100; 2005: $67,480; 2006: $43,000.
Biggest contracts:
$30,300 with Army for Real Property Appraisals Services (SIC 6531). Signed on 2006-03-17. Completion date: 2006-05-08.
$27,480 with U.S. Army Corps of Engineers - civil program financing only for Real Property Appraisals Services (SIC 6531). Signed on 2005-01-21. Completion date: 2004-04-30.
$20,000 with Army for Real Property Appraisals Services (SIC 6531). Taking place in MD. Signed on 2005-07-08. Completion date: 2005-09-09.
$20,000 with U.S. Army Corps of Engineers - civil program financing only for Real Property Appraisals Services (SIC 6531). Taking place in MD. Signed on 2005-07-08. Completion date: 2005-09-09.
JEFFREY J COGAN (2020 GOOD HOPE ROAD in ENOLA, PA; small business) : $61,485 in 10 contractsfrom 2002 to 2005
Contracts for Chaplain Services, Other Social Services by Army Signed by year:2000: $0; 2001: $0; 2002: $27,135; 2003: $27,135; 2004: $11,670; 2005: -$4,455; 2006: $0.
Biggest contracts:
$11,670 with Army for Chaplain Services. Signed on 2004-11-22. Completion date: 2005-11-21.
$10,530 with Army for Other Social Services. Signed on 2003-11-05. Completion date: 2005-11-07.
$10,530, same as above.Signed on 2002-11-07. Completion date: 2003-09-30.
$9,575, same as above.Signed on 2003-10-07. Completion date: 2004-09-30.
JACKSON MECHANICALS INC (29 RADAM ST in ENOLA, PA; small business) : $34,440 in 3 contractsfrom 2004 to 2005
$11,500 with Defense Logistics Agency for Hazardous Substance Removal, Cleanup, and Disposal Services and Operational Support. Signed on 2005-11-14. Completion date: 2006-01-25.
$11,500 with Defense Logistics Agency for Facilities Operations Support Services. Signed on 2005-11-18. Completion date: 2006-01-25.
$11,440 with Navy for Construction of Structures and Facilities -- Miscellaneous Buildings. Signed on 2004-05-11. Completion date: 2004-06-10.
THOMAS ENCK (524 S ENOLA RD in ENOLA, PA; small business) : $11,977 in 2 contractsfrom 2005 to 2006
$11,977 with Army for Tableware. Signed on 2005-03-31. Completion date: 2006-03-31.
$0 with Army for Time Measuring Instruments. Signed on 2006-03-09. Effective on 2006-03-07. Completion date: 2006-03-31.
MARY ANN CEBULESKY (447 HIGH ST in WEST FAIRVIEW, PA; small business) : $4,200 in 2 contractsin 2005
$3,000 with Department of Defense for Intelligence Studies. Taking place in DC. Signed on 2005-05-05. Completion date: 2006-07-07.
$1,200, same as above.Signed on 2005-03-03. Completion date: 2005-05-05.
G T WATTS INC (108 ALTOONA AVE in ENOLA, PA; small business)
$3,313 with Navy for Installation of Equipment -- Construction, Mining, Excavating, and Highway Maintenance Equipment. Signed on 2005-09-28. Completion date: 2005-11-05.
Top industries in this zip code by the number of employees in 2005:
Health Care and Social Assistance: Services for the Elderly and Persons with Disabilities (50-99 employees: 3 establishments, 5-9 employees: 1 establishment)
2004 - 2018 National Fire Incident Reporting System (NFIRS) incidents
According to the data from the years 2004 - 2018 the average number of fires per year is 95. The highest number of reported fire incidents - 162 took place in 2007, and the least - 27 in 2005. The data has a growing trend.
When looking into fire subcategories, the most incidents belonged to: Structure Fires (55.4%), and Other (23.6%).
Fire incident types reported to NFIRS in Zip Code 17025

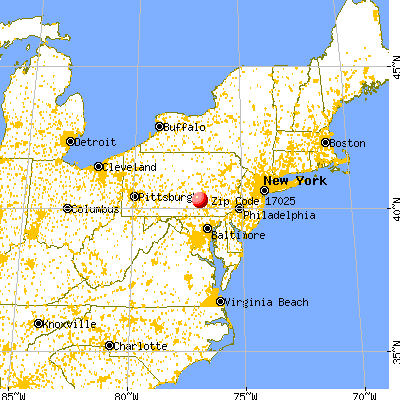


 Nearest zip codes: 17093, 17053, 17050, 17102, 17011, 17101.


 According to the data from the years 2004 - 2018 the average number of fires per year is 95. The highest number of reported fire incidents - 162 took place in 2007, and the least - 27 in 2005. The data has a growing trend.
 When looking into fire subcategories, the most incidents belonged to: Structure Fires (55.4%), and Other (23.6%).