Estimated zip code population in 2022: 20,255 Zip code population in 2010: 19,997 Zip code population in 2000: 27,365
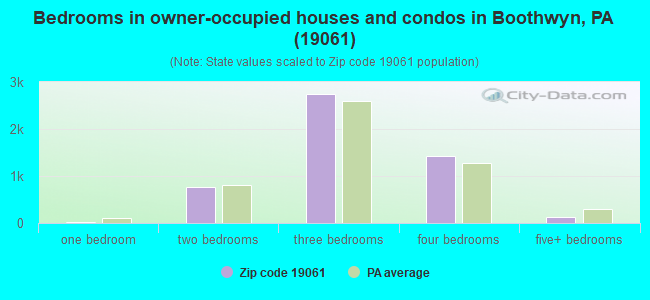
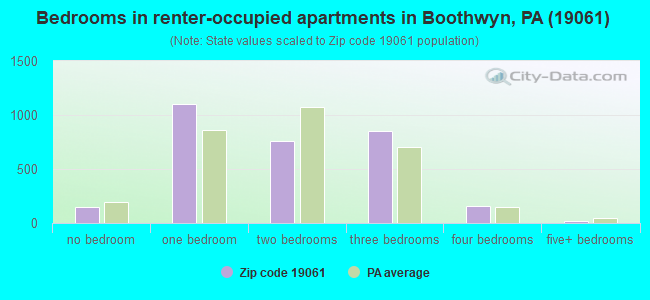
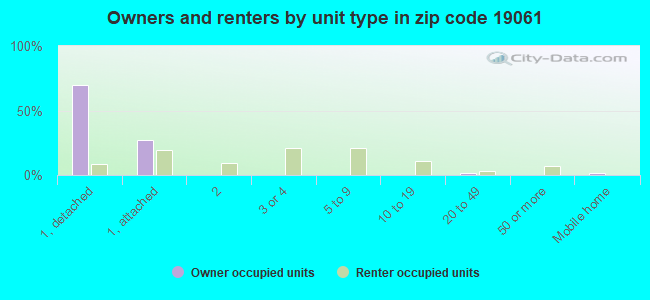
Houses and condos: 8,403 Renter-occupied apartments: 3,041
% of renters here:
37%
State:
31%
March 2022 cost of living index in zip code 19061: 103.0 (near average, U.S. average is 100)
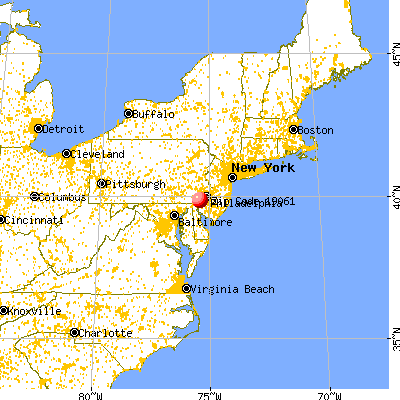
Land area: 7.0 sq. mi. Water area: 0.0 sq. mi.
Population density: 2,887 people per square mile
(average).
OSM Map
General Map
Google Map
MSN Map
OSM Map
General Map
Google Map
MSN Map
OSM Map
General Map
Google Map
MSN Map
OSM Map
General Map
Google Map
MSN Map
Please wait while loading the map...
Real estate property taxes paid for housing units in 2022:
This zip code:
2.0% ($4,865)
Pennsylvania:
1.3% ($3,094)
Median real estate property taxes paid for housing units with mortgages in 2022: $5,124 (2.0%) Median real estate property taxes paid for housing units with no mortgage in 2022: $4,264 (1.8%)
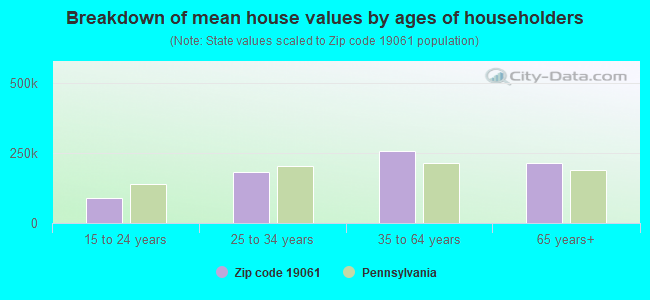
Estimated median house/condo value in 2022: $245,826
19061:
$245,826
Pennsylvania:
$245,500
According to our research of Pennsylvania and other state lists, there were 37 registered sex offenders living in 19061 zip code as of April 27, 2024. The ratio of all residents to sex offenders in zip code 19061 is 554 to 1. The ratio of registered sex offenders to all residents in this zip code is near the state average.
Median resident age:
This zip code:
39.1 years
Pennsylvania median age:
40.9 years
Average household size:
This zip code:
2.5 people
Pennsylvania:
2.4 people
Averages for the 2020 tax year for zip code 19061, filed in 2021:
Average Adjusted Gross Income (AGI) in 2020: $57,234 (Individual Income Tax Returns)
Here:
$57,234
State:
$75,707
Salary/wage: $51,181 (reported on 81.9% of returns)
Here:
$51,181
State:
$62,806
(% of AGI for various income ranges: 993.9% for AGIs below $25k, 3331.3% for AGIs $25k-50k, 6035.9% for AGIs $50k-75k, 9020.4% for AGIs $75k-100k, 15996.9% for AGIs $100k-200k, 52456.7% for AGIs over 200k)
Taxable interest for individuals: $865 (reported on 23.8% of returns)
This zip code:
$865
Pennsylvania:
$1,633
(% of AGI for various income ranges: 11.4% for AGIs below $25k, 12.0% for AGIs $25k-50k, 21.0% for AGIs $50k-75k, 46.6% for AGIs $75k-100k, 73.4% for AGIs $100k-200k, 340.0% for AGIs over 200k)
Ordinary dividends: $2,654 (reported on 13.4% of returns)
Here:
$2,654
State:
$7,382
(% of AGI for various income ranges: 11.6% for AGIs below $25k, 19.8% for AGIs $25k-50k, 39.7% for AGIs $50k-75k, 59.5% for AGIs $75k-100k, 155.1% for AGIs $100k-200k, 693.3% for AGIs over 200k)
Net capital gain/loss in AGI: +$8,635 (reported on 10.5% of returns)
Here:
+$8,635
State:
+$23,522
(% of AGI for various income ranges: 0.2% for AGIs below $25k, 8.0% for AGIs $25k-50k, 37.8% for AGIs $50k-75k, 58.2% for AGIs $75k-100k, 206.7% for AGIs $100k-200k, 7148.9% for AGIs over 200k)
Profit/loss from business: +$10,327 (reported on 9.9% of returns)
Here:
+$10,327
State:
+$16,274
(% of AGI for various income ranges: 58.0% for AGIs below $25k, 71.7% for AGIs $25k-50k, 72.6% for AGIs $50k-75k, 127.8% for AGIs $75k-100k, 350.7% for AGIs $100k-200k, 2806.7% for AGIs over 200k)
Taxable individual retirement arrangement distribution: $16,399 (reported on 9.2% of returns)
19061:
$16,399
Pennsylvania:
$18,583
(% of AGI for various income ranges: 60.2% for AGIs below $25k, 91.0% for AGIs $25k-50k, 169.3% for AGIs $50k-75k, 326.7% for AGIs $75k-100k, 635.5% for AGIs $100k-200k, 2081.1% for AGIs over 200k)
Total itemized deductions: $26,357 (reported on 7.2% of returns)
Here:
$26,357
State:
$34,850
(% of AGI for various income ranges: 38.1% for AGIs below $25k, 111.2% for AGIs $25k-50k, 241.8% for AGIs $50k-75k, 458.0% for AGIs $75k-100k, 746.6% for AGIs $100k-200k, 3334.4% for AGIs over 200k)
Charity contributions: $6,438 (reported on 5.4% of returns)
Here:
$6,438
State:
$12,392
(% of AGI for various income ranges: 3.7% for AGIs below $25k, 15.2% for AGIs $25k-50k, 41.0% for AGIs $50k-75k, 80.1% for AGIs $75k-100k, 149.3% for AGIs $100k-200k, 830.0% for AGIs over 200k)
Taxes paid: $8,314 (reported on 7.2% of returns)
19061:
$8,314
State:
$8,200
(% of AGI for various income ranges: 9.5% for AGIs below $25k, 27.4% for AGIs $25k-50k, 81.8% for AGIs $50k-75k, 181.6% for AGIs $75k-100k, 263.6% for AGIs $100k-200k, 656.7% for AGIs over 200k)
Earned income credit: $2,268 (reported on 16.2% of returns)
Here:
$2,268
State:
$2,100
(% of AGI for various income ranges: 89.4% for AGIs below $25k, 68.0% for AGIs $25k-50k)
Percentage of individuals using paid preparers for their 2020 taxes: 93.4%
Here:
93%
State:
92%
(% for various income ranges: 92.7% for AGIs below $25k, 94.6% for AGIs $25k-50k, 93.2% for AGIs $50k-75k, 93.3% for AGIs $75k-100k, 93.3% for AGIs $100k-200k, 91.3% for AGIs over 200k)
Averages for the 2012 tax year for zip code 19061, filed in 2013:
Average Adjusted Gross Income (AGI) in 2012: $48,718 (Individual Income Tax Returns)
Here:
$48,718
State:
$61,346
Salary/wage: $45,875 (reported on 84.1% of returns)
Here:
$45,875
State:
$51,902
(% of AGI for various income ranges: 70.5% for AGIs below $25k, 80.6% for AGIs $25k-50k, 79.4% for AGIs $50k-75k, 80.3% for AGIs $75k-100k, 81.9% for AGIs $100k-200k, 72.9% for AGIs over 200k)
Taxable interest for individuals: $818 (reported on 30.4% of returns)
This zip code:
$818
Pennsylvania:
$1,588
(% of AGI for various income ranges: 1.1% for AGIs below $25k, 0.5% for AGIs $25k-50k, 0.4% for AGIs $50k-75k, 0.4% for AGIs $75k-100k, 0.4% for AGIs $100k-200k, 0.3% for AGIs over 200k)
Ordinary dividends: $2,181 (reported on 16.7% of returns)
Here:
$2,181
State:
$5,827
(% of AGI for various income ranges: 1.1% for AGIs below $25k, 0.7% for AGIs $25k-50k, 0.8% for AGIs $50k-75k, 0.7% for AGIs $75k-100k, 0.6% for AGIs $100k-200k, 1.3% for AGIs over 200k)
Net capital gain/loss in AGI: +$2,052 (reported on 9.2% of returns)
Here:
+$2,052
State:
+$14,495
(% of AGI for various income ranges: 0.3% for AGIs $50k-75k, 0.4% for AGIs $75k-100k, 0.5% for AGIs $100k-200k, 1.5% for AGIs over 200k)
Profit/loss from business: +$11,684 (reported on 8.9% of returns)
Here:
+$11,684
State:
+$16,268
(% of AGI for various income ranges: 5.1% for AGIs below $25k, 1.8% for AGIs $25k-50k, 1.6% for AGIs $50k-75k, 1.4% for AGIs $75k-100k, 2.1% for AGIs $100k-200k, 2.2% for AGIs over 200k)
Taxable individual retirement arrangement distribution: $13,081 (reported on 9.8% of returns)
19061:
$13,081
Pennsylvania:
$14,550
(% of AGI for various income ranges: 3.1% for AGIs below $25k, 2.5% for AGIs $25k-50k, 2.6% for AGIs $50k-75k, 2.8% for AGIs $75k-100k, 2.3% for AGIs $100k-200k, 3.2% for AGIs over 200k)
Self-employment retirement plans: $13,433 (reported on 0.3% of returns)
19061:
$13,433
Pennsylvania:
$20,922
Total itemized deductions: $19,719 (23% of AGI, reported on 34.9% of returns)
Here:
$19,719
State:
$23,538
Here:
23.0% of AGI
State:
18.4% of AGI
(% of AGI for various income ranges: 10.2% for AGIs below $25k, 10.5% for AGIs $25k-50k, 13.8% for AGIs $50k-75k, 16.4% for AGIs $75k-100k, 16.3% for AGIs $100k-200k, 15.0% for AGIs over 200k)
Charity contributions: $2,373 (reported on 29.2% of returns)
Here:
$2,373
State:
$4,025
(% of AGI for various income ranges: 0.6% for AGIs below $25k, 1.0% for AGIs $25k-50k, 1.2% for AGIs $50k-75k, 2.1% for AGIs $75k-100k, 1.6% for AGIs $100k-200k, 1.8% for AGIs over 200k)
Taxes paid: $9,133 (reported on 34.8% of returns)
19061:
$9,133
State:
$9,982
(% of AGI for various income ranges: 4.0% for AGIs below $25k, 4.0% for AGIs $25k-50k, 6.0% for AGIs $50k-75k, 7.4% for AGIs $75k-100k, 8.4% for AGIs $100k-200k, 7.7% for AGIs over 200k)
Earned income credit: $2,165 (reported on 17.0% of returns)
Here:
$2,165
State:
$2,106
(% of AGI for various income ranges: 6.2% for AGIs below $25k, 0.9% for AGIs $25k-50k)
Percentage of individuals using paid preparers for their 2012 taxes: 50.5%
Here:
51%
State:
53%
(% for various income ranges: 46.5% for AGIs below $25k, 48.8% for AGIs $25k-50k, 53.1% for AGIs $50k-75k, 58.7% for AGIs $75k-100k, 58.2% for AGIs $100k-200k, 57.1% for AGIs over 200k)
Averages for the 2004 tax year for zip code 19061, filed in 2005:
Average Adjusted Gross Income (AGI) in 2004: $55,809 (Individual Income Tax Returns)
Here:
$55,809
State:
$48,049
Salary/wage: $53,679 (reported on 87.2% of returns)
Here:
$53,679
State:
$42,646
(% of AGI for various income ranges: 99.9% for AGIs below $10k, 73.5% for AGIs $10k-25k, 82.2% for AGIs $25k-50k, 83.8% for AGIs $50k-75k, 88.0% for AGIs $75k-100k, 83.8% for AGIs over 100k)
Taxable interest for individuals: $1,165 (reported on 50.6% of returns)
This zip code:
$1,165
Pennsylvania:
$1,657
(% of AGI for various income ranges: 4.8% for AGIs below $10k, 2.2% for AGIs $10k-25k, 1.1% for AGIs $25k-50k, 1.1% for AGIs $50k-75k, 0.7% for AGIs $75k-100k, 0.9% for AGIs over 100k)
Taxable dividends: $1,725 (reported on 28.9% of returns)
Here:
$1,725
State:
$3,566
(% of AGI for various income ranges: 3.6% for AGIs below $10k, 1.4% for AGIs $10k-25k, 1.1% for AGIs $25k-50k, 0.9% for AGIs $50k-75k, 0.6% for AGIs $75k-100k, 0.8% for AGIs over 100k)
Net capital gain/loss: +$5,016 (reported on 20.5% of returns)
Here:
+$5,016
State:
+$9,716
(% of AGI for various income ranges: -2.3% for AGIs below $10k, 0.3% for AGIs $10k-25k, 0.4% for AGIs $25k-50k, 0.9% for AGIs $50k-75k, 0.7% for AGIs $75k-100k, 3.3% for AGIs over 100k)
Profit/loss from business: +$15,863 (reported on 10.5% of returns)
Here:
+$15,863
State:
+$14,267
(% of AGI for various income ranges: 7.1% for AGIs below $10k, 3.9% for AGIs $10k-25k, 3.3% for AGIs $25k-50k, 2.4% for AGIs $50k-75k, 2.0% for AGIs $75k-100k, 3.2% for AGIs over 100k)
IRA payment deduction: $2,976 (reported on 2.5% of returns)
19061:
$2,976
Pennsylvania:
$2,903
(% of AGI for various income ranges: 0.3% for AGIs below $10k, 0.1% for AGIs $10k-25k, 0.2% for AGIs $25k-50k, 0.2% for AGIs $50k-75k, 0.1% for AGIs $75k-100k, 0.1% for AGIs over 100k)
Self-employed pension: $15,067 (reported on 0.8% of returns)
Here:
$15,067
Pennsylvania:
$14,674
(% of AGI for various income ranges: 0.1% for AGIs $25k-50k, 0.1% for AGIs $50k-75k, 0.1% for AGIs $75k-100k, 0.4% for AGIs over 100k)
Total itemized deductions: $21,271 (22% of AGI, reported on 44.0% of returns)
Here:
$21,271
State:
$18,804
Here:
22.3% of AGI
State:
19.5% of AGI
(% of AGI for various income ranges: 13.4% for AGIs below $10k, 10.1% for AGIs $10k-25k, 16.4% for AGIs $25k-50k, 17.4% for AGIs $50k-75k, 19.4% for AGIs $75k-100k, 16.7% for AGIs over 100k)
Charity contributions deductions: $2,565 (3% of AGI, reported on 40.7% of returns)
Here:
$2,565
State:
$3,337
Here:
2.6% of AGI
State:
3.3% of AGI
(% of AGI for various income ranges: 0.6% for AGIs below $10k, 0.8% for AGIs $10k-25k, 1.3% for AGIs $25k-50k, 2.1% for AGIs $50k-75k, 2.1% for AGIs $75k-100k, 2.0% for AGIs over 100k)
Total tax: $8,559 (reported on 78.9% of returns)
19061:
$8,559
State:
$8,008
(% of AGI for various income ranges: 2.5% for AGIs below $10k, 4.2% for AGIs $10k-25k, 7.5% for AGIs $25k-50k, 8.9% for AGIs $50k-75k, 9.9% for AGIs $75k-100k, 16.6% for AGIs over 100k)
Earned income credit: $1,664 (reported on 9.8% of returns)
Here:
$1,664
State:
$1,643
Percentage of individuals using paid preparers for their 2004 taxes: 54.6%
Here:
55%
State:
56%
(% for various income ranges: 45.1% for AGIs below $10k, 56.3% for AGIs $10k-25k, 54.9% for AGIs $25k-50k, 59.8% for AGIs $50k-75k, 57.4% for AGIs $75k-100k, 57.0% for AGIs over 100k)
Likely homosexual households (counted as self-reported same-sex unmarried-partner households)
Lesbian couples: 0.0% of all households
Gay men: 0.1% of all households
Household received Food Stamps/SNAP in the past 12 months: 1,367 Household did not receive Food Stamps/SNAP in the past 12 months: 6,797
Women who had a birth in the past 12 months: 104 (26 now married, 68 unmarried) Women who did not have a birth in the past 12 months: 4,462 (1,634 now married, 2,832 unmarried)
Housing units in zip code 19061 with a mortgage: 3,467 (357 second mortgage, 8 home equity loan, 334 both second mortgage and home equity loan) Houses without a mortgage: 219
Median monthly owner costs for units with a mortgage: $1,634 Median monthly owner costs for units without a mortgage: $725
Residents with income below the poverty level in 2022:
This zip code:
9.1%
Whole state:
11.8%
Residents with income below 50% of the poverty level in 2022:
This zip code:
5.7%
Whole state:
6.1%
Median number of rooms in houses and condos:
Here:
6.8
State:
6.8
Median number of rooms in apartments:
Here:
4.2
State:
4.3
Notable locations in this zip code not listed on our city pages
Notable locations in zip code 19061: Hickmans Mill (A), Lower Chichester Township Building (B), Marcus Hook Borough Hall (C), Naamans Creek Center (D), Trainer Station (E), Boothwyn Fire Company Station 40 (F), Lennox Park Company 1 Fire Station (G), Lower Chichester Volunteer Fire Company Station 39 (H), Lower Chichester Township Police Department (I), Marcus Hook Trainer Fire Department Station 68 (J), Marcus Hook Police Department (K), Mary Campbell Library (L), Sunoco Oil - Marcus Hook Refinery Fire Department (M), Ogden Fire Company (N), Reliance Hook and Ladder Volunteer Fire Company (O), Trainer Borough Hall (P), Stoney Creek Technologies Emergency Response (Q), Trainer Police Department (R), Viscose Company 2 Fire Station (S). Display/hide their locations on the map
2,192 married couples with children.
1,341 single-parent households (215 men, 1,126 women).
89.1% of residents of 19061 zip code speak English at home.
3.1% of residents speak Spanish at home (49% very well, 30% well, 21% not well).
2.4% of residents speak other Indo-European language at home (86% very well, 11% well, 1% not well, 2% not at all).
4.9% of residents speak Asian or Pacific Island language at home (68% very well, 15% well, 17% not well).
0.2% of residents speak other language at home (100% very well).
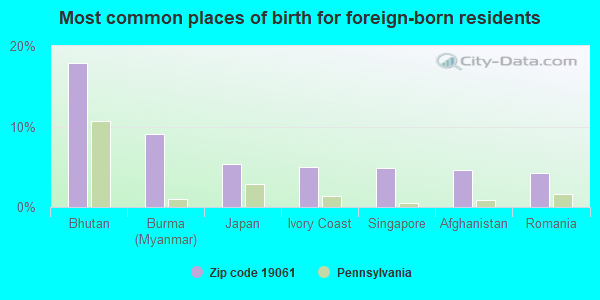
Foreign born population: 1,473 (7.3%) (65.4% of them are naturalized citizens)
This zip code:
7.3%
Whole state:
7.5%
18%Bhutan
9%Burma (Myanmar)
5%Japan
5%Ivory Coast
5%Singapore
5%Afghanistan
4%Romania
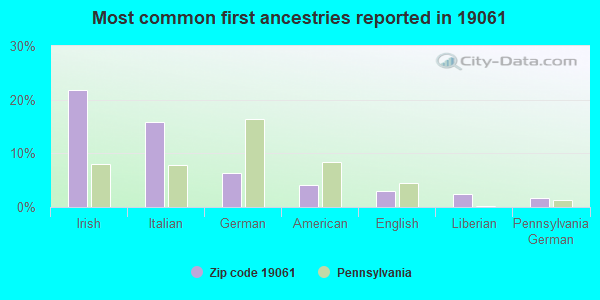
22%Irish
16%Italian
6%German
4%American
3%English
2%Liberian
2%Pennsylvania German
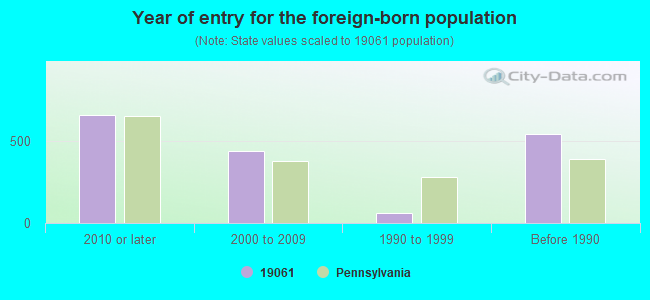
Year of entry for the foreign-born population
6562010 or later
4382000 to 2009
631990 to 1999
543Before 1990
Major facilities with environmental interests located in this zip code:
AIR PROD & CHEM (FIFTH & GREEN STS in MARCUS HOOK, PA)
STATE MASTER (Pennsylvania database) - RCRIS-PAD000650374, HAZARDOUS WASTE PROGRAM (Resource Conservation and Recovery Act (tracking hazardous waste)) Organizations: AIR PRODUCTS AND CHEMICALS, INC. (CONTACT/GENERAL)
, OPERNAME (CONTACT/OPERATOR)
, AIR PRODUCTS & CHEMICALS INC (CONTACT/OWNER)
, AIR PRODUCTS AND CHEMICALS, INC. (CONTACT/OWNER)
STATE MASTER (Pennsylvania database) - RCRIS-PAR000512319, HAZARDOUS WASTE PROGRAM, AFS-51-0083097-2, AIR PROGRAM, PCS-PAR200044, National Pollutant Discharge Elimination System Permit Large Quantity Generators, more that 1000 kg of hazardous waste/month (Resource Conservation and Recovery Act (tracking hazardous waste)) Business SIC classification: MISCELLANEOUS STRUCTURAL METALWORK; ORDNANCE AND ACCESSORIES Business NAICS classification: CUSTOM ROLL FORMING.; METAL COATING, ENGRAVING (EXCEPT JEWELRY AND SILVERWARE), AND ALLIED SERVICES TO MANUFACTURERS.; METAL COATING, ENGRAVING (EXCEPT JEWELRY AND SILVERWARE), AND ALLIED SERVICES TO MANUFACTURERS. Organizations: ALLOY SURFACES CO (CONTACT/OPERATOR)
, 1515 LIMITED PARTNERS INC (CONTACT/OWNER)
, ALLOY SURFACES COMPANY, INC. (CONTACT/OWNER)
Alternative names: ALLOY SURFACES CO, ALLOY SURFACES BOOTHWYN MFG PLT
ALAN MCILVAIN MFG PLT (5TH & MARKET ST in MARCUS HOOK, PA)
AIR MINOR (AIRS/AFS) STATE MASTER (Pennsylvania database) - AFS-23-1716213-1, AIR PROGRAM Business SIC classification: SAWMILLS AND PLANING MILLS, GENERAL; HARDWOOD DIMENSION AND FLOORING MILLS; MILLWORK Organizations: ALAN MCILVAIN COMPANY (CONTACT/OWNER)
Alternative names: ALAN MCILVAIN/MARCUS HOOK
BARON BLAKESLEE (6300 PHILADELPHIA PIKE in MARCUS HOOK, PA)
STATE MASTER (Pennsylvania database) - RCRIS-PAD981038961, HAZARDOUS WASTE PROGRAM (Resource Conservation and Recovery Act (tracking hazardous waste)) Organizations: OPERNAME (CONTACT/OPERATOR)
, BARON BLAKESLEE INC (CONTACT/OWNER)
AIR PROD & CHEM HOUDRY LABS (SUN & HEWES AVE in LINWOOD, PA)
STATE MASTER (Pennsylvania database) - RCRIS-PAD002346732, HAZARDOUS WASTE PROGRAM (Resource Conservation and Recovery Act (tracking hazardous waste)) Organizations: AIR PRODUCTS AND CHEMICALS, INC. (CONTACT/GENERAL)
, AIR PRODUCTS AND CHEMICALS INC (CONTACT/OPERATOR)
AMOCO STA 269 (2049 CHICHESTER AVE in BOOTHWYN, PA)
STATE MASTER (Pennsylvania database) - RCRIS-PAD987359338, HAZARDOUS WASTE PROGRAM Conditionally Exempt Small Quantity Generators, less than 100 kg/month of hazardous waste (Resource Conservation and Recovery Act (tracking hazardous waste)) - notification Small Quantity Generators, between 100 kg and 1000 kg of hazardous waste/month (Resource Conservation and Recovery Act (tracking hazardous waste)) - notification Organizations: AMOCO OIL COMPANY (CONTACT/OWNER)
Alternative names: AMOCO 269 TANKS, WHEATLEY AMOCO
BETHEL SPRINGS EL SCH ( in BOOTHWYN, PA)
(National Center for Education Statistics) - STATE ID-7714 Organizations: GARNET VALLEY SD (SCHOOL DISTRICT)
ADAMANTECH INC (1501 BLUEBALL AVE in LINWOOD, PA)
COMPLIANCE ACTIVITY (Tracking inspections of insecticide, fungicide, and rodenticide, and toxic substances) Small Quantity Generators, between 100 kg and 1000 kg of hazardous waste/month (Resource Conservation and Recovery Act (tracking hazardous waste)) - notification Organizations: OPERNAME (CONTACT/OPERATOR)
, SUN CO (CONTACT/OWNER)
AMSA 84 MARCUS HOOK (7 W DELAWARE AVE in MARCUS HOOK, PA) . Federal Facility. U.S. ARMY
(Resource Conservation and Recovery Act (tracking hazardous waste)) Organizations: COMMANDER FT INDIANTOWN GAP (CONTACT/OWNER)
AIR PRODUCTS & CHEMICALS INC (ROUTE 13 in TRAINER, PA)
Conditionally Exempt Small Quantity Generators, less than 100 kg/month of hazardous waste (Resource Conservation and Recovery Act (tracking hazardous waste)) - notification Organizations: OPERNAME (CONTACT/OPERATOR)
ALLOY SURFACES CO INC (BOOTHWYN PLANT in BOOTHWYN, PA)
National Pollutant Discharge Elimination System NON-MAJOR (Tracking pollutant discharge elimination systems) - permit Business SIC classification: ORDNANCE AND ACCESSORIES
ATLANTIC RICHFIELD CO (CONOCOPHILLIPS TRAINER REFIN in TRAINER, PA)
National Pollutant Discharge Elimination System NON-MAJOR (Tracking pollutant discharge elimination systems) - permit Business SIC classification: WATER, SEWER, PIPELINE, AND COMMUNICATIONS AND POWER LINE CONSTRUCTION
ATLANTIC SERVICE STATION (MARKET & BETHEL in BOOTHWYN, PA)
Conditionally Exempt Small Quantity Generators, less than 100 kg/month of hazardous waste (Resource Conservation and Recovery Act (tracking hazardous waste)) - notification Organizations: OPERNAME (CONTACT/OPERATOR)
Housing units lacking complete plumbing facilities: 1.1% Housing units lacking complete kitchen facilities: 2.2%
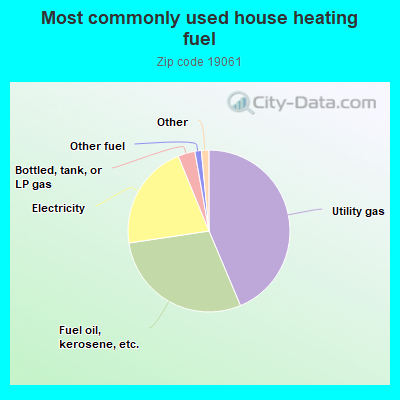
43.7%Utility gas
29.0%Fuel oil, kerosene, etc.
21.2%Electricity
3.4%Bottled, tank, or LP gas
1.3%Other fuel
0.7%No fuel used
0.6%Wood
Population in 1990: 21,328. Population change in the 1990s: +6,037 (+28.3%).
Place of birth for U.S.-born residents:
This state: 15,303
Northeast: 1,133
Midwest: 240
South: 1,647
West: 173
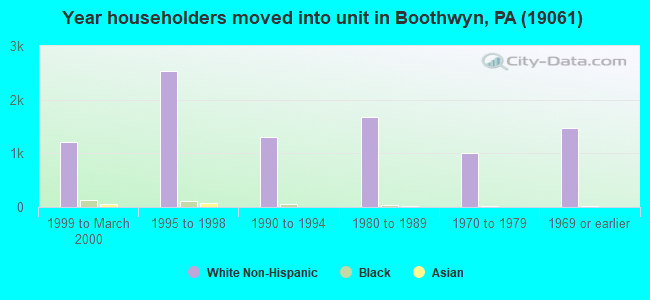
60% of the 19061 zip code residents lived in the same house 5 years ago. Out of people who lived in different houses, 66% lived in this county. Out of people who lived in different counties, 50% lived in Pennsylvania.
91% of the 19061 zip code residents lived in the same house 1 year ago. Out of people who lived in different houses, 58% moved from this county. Out of people who lived in different houses, 22% moved from different county within same state. Out of people who lived in different houses, 17% moved from different state. Out of people who lived in different houses, 3% moved from abroad.
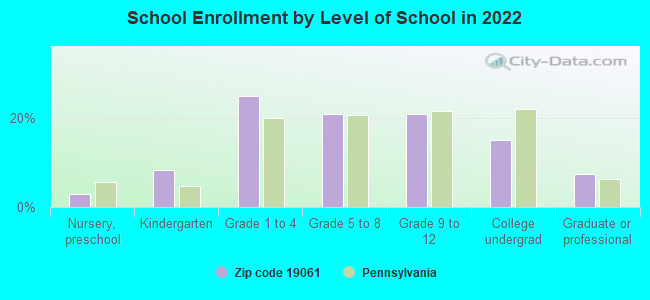
Private vs. public school enrollment:
Students in private schools in grades 1 to 8 (elementary and middle school): 291
Here:
13.0%
Pennsylvania:
15.7%
Students in private schools in grades 9 to 12 (high school): 205
Here:
20.2%
Pennsylvania:
13.4%
Students in private undergraduate colleges: 88
Here:
11.9%
Pennsylvania:
39.8%
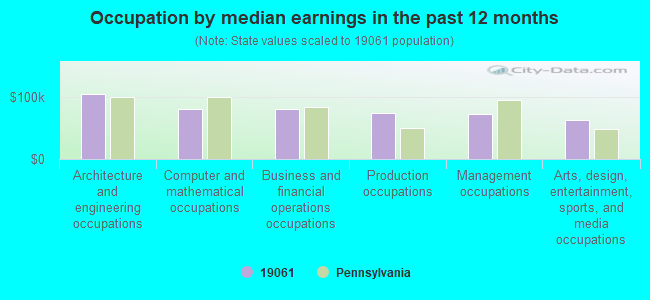
Occupation by median earnings in the past 12 months ($)
104,585Architecture and engineering occupations
80,688Computer and mathematical occupations
80,549Business and financial operations occupations
73,542Production occupations
72,066Management occupations
62,307Arts, design, entertainment, sports, and media occupations
Companies with biggest federal contracts located in this zip code:
HIGH PERFORMANCE MATERIALS GRO (1515 GARNET MINE RD A in BOOTHWYN, PA; small business) : $5,471,279 in 7 contractsfrom 2004 to 2006
Contracts for Armor, Personal, Other Defense -- Basic Research (R&D), Other Defense -- Operational Systems Development (R&D), Maintenance, Repair and Rebuilding of Equipment -- Instruments and Laboratory Equipment by Defense Logistics Agency, Navy, Army Signed by year:2000: $0; 2001: $0; 2002: $0; 2003: $0; 2004: $5,263,550; 2005: $222,729; 2006: -$15,000.
Biggest contracts:
$4,960,000 with Defense Logistics Agency for Armor, Personal. Signed on 2004-02-06. Completion date: 2004-07-06.
$224,161 with Navy for Other Defense -- Basic Research (R&D). Signed on 2004-04-09. Completion date: 2006-04-15.
$222,729 with Navy for Other Defense -- Operational Systems Development (R&D). Signed on 2005-09-08. Completion date: 2006-04-08.
$64,389 with Army for Maintenance, Repair and Rebuilding of Equipment -- Instruments and Laboratory Equipment. Signed on 2004-01-09. Completion date: 2004-09-30.
MARTIN-BAKER AMERICA, INC (23 CREEK PKWY in BOOTHWYN, PA; small business) : $3,992,470 in 722 contractsfrom 2004 to 2006
Contracts for Miscellaneous Aircraft Accessories and Components, Aircraft Hydraulic, Vacuum, and De-icing System Components, Parachutes; Aerial Pick Up, Delivery, Recovery Systems; and Cargo Tie Down Equipment, Hardware, Commercial, and moreby Defense Logistics Agency Signed by year:2000: $0; 2001: $0; 2002: $0; 2003: $0; 2004: $475,788; 2005: $2,145,600; 2006: $1,371,082.
Biggest contracts:
$135,494 with Defense Logistics Agency for Miscellaneous Aircraft Accessories and Components. Signed on 2005-05-23. Completion date: 2005-11-19.
$123,178, same as above.Signed on 2004-03-10. Completion date: 2004-09-06.
$73,600, same as above.Signed on 2005-02-06. Completion date: 2005-08-05.
$37,604 with Defense Logistics Agency for Aircraft Hydraulic, Vacuum, and De-icing System Components. Signed on 2006-05-12. Completion date: 2006-11-08.
CREATIVE PRECISION INC (1501 BLUEBALL AVE in LINWOOD, PA; small business) : $3,869,456 in 167 contractsfrom 1999 to 2006
Contracts for Flight Instruments, Aircraft Hydraulic, Vacuum, and De-icing System Components, Bolts, Airframe Structural Components, and moreby Defense Logistics Agency Signed by year:2000: $271,966; 2001: $528,346; 2002: $280,423; 2003: $354,642; 2004: $1,107,744; 2005: $861,089; 2006: $437,584.
Biggest contracts:
$237,817 with Defense Logistics Agency for Flight Instruments. Signed on 2004-07-16. Completion date: 2005-01-12.
$126,963 with Defense Logistics Agency for Aircraft Hydraulic, Vacuum, and De-icing System Components. Signed on 2000-08-15. Completion date: 2001-10-24.
$103,146, same as above.Signed on 2001-12-07. Completion date: 2003-01-31.
$98,600 with Defense Logistics Agency for Bolts. Signed on 2003-11-15. Completion date: 2004-05-15.
BEAR TUBULAR STEEL INC (4TH & PENN STS in MARCUS HOOK, PA; small business) : $2,106,977 in 7 contractsfrom 2001 to 2005
Contracts for Pipe, Tube and Rigid Tubing, Hose, Pipe, Tube, Lubrication, and Railing Fittings by Army, U.S. Army Corps of Engineers - civil program financing only, Defense Logistics Agency, Navy, and others Signed by year:2000: $0; 2001: $30,935; 2002: -$1,375; 2003: $189,120; 2004: $0; 2005: $1,888,297; 2006: $0.
Biggest contracts:
$942,391 with Army for Pipe, Tube and Rigid Tubing. Signed on 2005-02-14. Completion date: 2005-04-01.
$942,391 with U.S. Army Corps of Engineers - civil program financing only for Pipe, Tube and Rigid Tubing. Signed on 2005-02-14. Completion date: 2005-04-01.
$189,120, same as above.Signed on 2003-07-24. Completion date: 2003-10-29.
$30,935 with U.S. Army Corps of Engineers - civil program financing only for Hose, Pipe, Tube, Lubrication, and Railing Fittings. Signed on 2001-06-21. Completion date: 2001-06-29.
CIDER MILL SERVICE (998 SHAVERTOWN RD in BOOTHWYN, PA; small business)
$257,000 with Navy for Demolition of Buildings. Signed on 2002-04-19. Completion date: 2002-05-30.
CHEMICAL EQUIPMENT LABS OF VIR (WALNUT & PINE ST in MARCUS HOOK, PA; small business) 30 employees, $3000000 revenue. : $140,000 in 5 contractsfrom 1999 to 2001
Contracts for Chemicals by United States Mint Signed by year:2000: $47,000; 2001: $17,000; 2002: $0; 2003: $0; 2004: $0; 2005: $0; 2006: $0.
Biggest contracts:
$76,000 with United States Mint for Chemicals. Signed on 1999-10-15. Completion date: 2000-01-15.
$47,000, same as above.Signed on 2000-10-15. Completion date: 2001-09-15.
$11,000, same as above.Signed on 2001-08-15. Completion date: 2001-08-15.
$3,000, same as above.Signed on 2001-01-15. Completion date: 2001-09-15.
ENVIRONMENTAL EQP & SVC CO (7 W 9THST in MARCUS HOOK, PA; small business) : $130,386 in 8 contractsfrom 2001 to 2006
Contracts for Commercial and Industrial Gas Cylinders, Water Purification Equipment, Miscellaneous Construction Materials, Inspection Gages and Precision Layout Tools, and moreby U.S. Army Corps of Engineers - civil program financing only, Army Signed by year:2000: $0; 2001: $29,900; 2002: $0; 2003: $35,720; 2004: $51,086; 2005: $0; 2006: $13,680.
Biggest contracts:
$29,900 with U.S. Army Corps of Engineers - civil program financing only for Commercial and Industrial Gas Cylinders. Signed on 2001-01-23. Completion date: 2000-10-12.
$25,543 with Army for Water Purification Equipment. Taking place in DC. Signed on 2004-04-14. Completion date: 2004-05-13.
$25,543 with U.S. Army Corps of Engineers - civil program financing only for Water Purification Equipment. Taking place in DC. Signed on 2004-04-14. Completion date: 2004-05-13.
$13,680 with Army for Miscellaneous Construction Materials. Taking place in DC. Signed on 2006-01-12. Completion date: 2006-03-31.
FOAMEX L P (1000 COLUMBIA AVENUE in LINWOOD, PA) : $72,536 in 6 contractsfrom 2004 to 2006
Contracts for Guns, through 30 mm, Miscellaneous Fabricated Nonmetallic Materials, Padding and Stuffing Materials, Laboratory Equipment and Supplies by Army, Consumer Product Safety Commission Signed by year:2000: $0; 2001: $0; 2002: $0; 2003: $0; 2004: $284,746; 2005: -$219,301; 2006: $7,091.
Biggest contracts:
$284,746 with Army for Guns, through 30 mm. Signed on 2004-09-29. Completion date: 2004-03-31.
$11,996 with Consumer Product Safety Commission for Miscellaneous Fabricated Nonmetallic Materials. Taking place in MD. Signed on 2005-05-06. Completion date: 2005-05-27.
$4,821 with Consumer Product Safety Commission for Padding and Stuffing Materials. Taking place in MD. Signed on 2005-06-08. Completion date: 2005-09-30.
$3,695 with Consumer Product Safety Commission for Miscellaneous Fabricated Nonmetallic Materials. Signed on 2006-03-28. Completion date: 2006-05-30.
S A I HYDRAULICS INC (3905 W 9TH ST in MARCUS HOOK, PA; small business) : $69,721 in 3 contractsfrom 2002 to 2005
$49,600 with Navy for Power and Hand Pumps. Signed on 2002-09-12. Completion date: 2003-03-20.
$16,930, same as above.Signed on 2005-04-05. Completion date: 2005-08-18.
$3,191 with Navy for Vehicular Furniture and Accessories. Signed on 2005-03-16. Completion date: 2005-04-15.
FLOTRAN PNEU-DRAULICS INC (3527 W 9TH ST in MARCUS HOOK, PA; small business) : $26,695 in 2 contractsfrom 2005 to 2006
$22,366 with Navy for Industrial Assembly Machines. Signed on 2006-04-03. Completion date: 2006-04-03.
$4,329 with Navy for Packing and Gasket Materials. Signed on 2005-02-04. Completion date: 2005-02-28.
Top industries in this zip code by the number of employees in 2005:
Management of Companies and Enterprises: Corporate, Subsidiary, and Regional Managing Offices (250-499 employees: 1 establishment, 1-4 employees: 1 establishment)
2003 - 2018 National Fire Incident Reporting System (NFIRS) incidents
According to the data from the years 2003 - 2018 the average number of fire incidents per year is 70. The highest number of reported fires - 178 took place in 2016, and the least - 4 in 2007. The data has a growing trend.
When looking into fire subcategories, the most reports belonged to: Structure Fires (69.1%), and Outside Fires (16.1%).
Fire incident types reported to NFIRS in Zip Code 19061


 Nearest zip codes: 19703, 19014, 19015, 19013, 19060, 19017.


 According to the data from the years 2003 - 2018 the average number of fire incidents per year is 70. The highest number of reported fires - 178 took place in 2016, and the least - 4 in 2007. The data has a growing trend.
 When looking into fire subcategories, the most reports belonged to: Structure Fires (69.1%), and Outside Fires (16.1%).