Estimated zip code population in 2022: 23,943 Zip code population in 2010: 22,544 Zip code population in 2000: 20,687
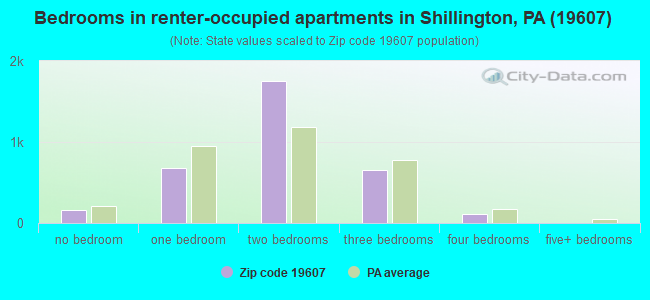
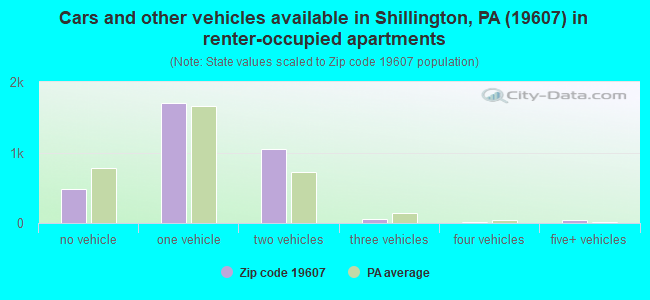
Houses and condos: 10,181 Renter-occupied apartments: 3,348
% of renters here:
35%
State:
31%
March 2022 cost of living index in zip code 19607: 95.5 (near average, U.S. average is 100)
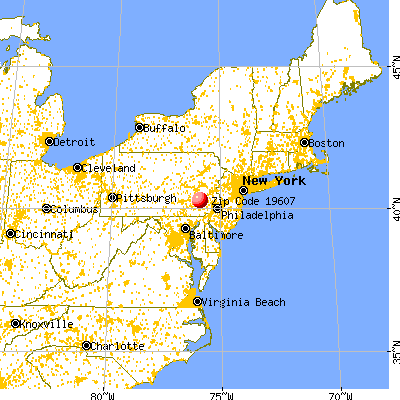
Land area: 11.2 sq. mi. Water area: 0.1 sq. mi.
Population density: 2,140 people per square mile
(low).
OSM Map
General Map
Google Map
MSN Map
OSM Map
General Map
Google Map
MSN Map
OSM Map
General Map
Google Map
MSN Map
OSM Map
General Map
Google Map
MSN Map
Please wait while loading the map...
Real estate property taxes paid for housing units in 2022:
This zip code:
1.8% ($3,835)
Pennsylvania:
1.3% ($3,094)
Median real estate property taxes paid for housing units with mortgages in 2022: $3,870 (1.8%) Median real estate property taxes paid for housing units with no mortgage in 2022: $3,777 (1.6%)
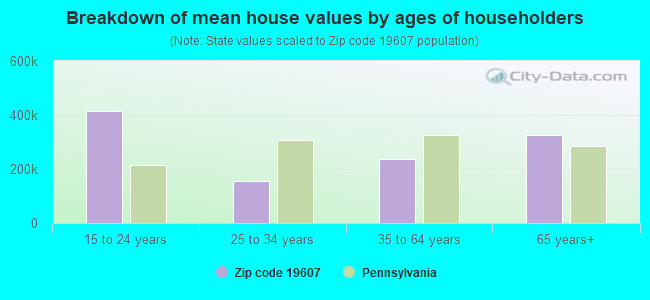
Estimated median house/condo value in 2022: $211,638
19607:
$211,638
Pennsylvania:
$245,500
According to our research of Pennsylvania and other state lists, there were 31 registered sex offenders living in 19607 zip code as of April 27, 2024. The ratio of all residents to sex offenders in zip code 19607 is 745 to 1. The ratio of registered sex offenders to all residents in this zip code is lower than the state average.
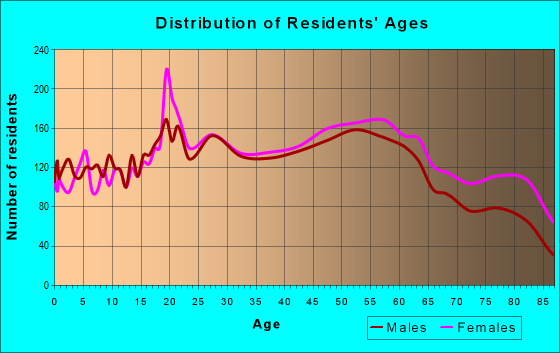
Median resident age:
This zip code:
39.5 years
Pennsylvania median age:
40.9 years
Average household size:
This zip code:
2.4 people
Pennsylvania:
2.4 people
Averages for the 2020 tax year for zip code 19607, filed in 2021:
Average Adjusted Gross Income (AGI) in 2020: $66,176 (Individual Income Tax Returns)
Here:
$66,176
State:
$75,707
Salary/wage: $56,524 (reported on 80.0% of returns)
Here:
$56,524
State:
$62,806
(% of AGI for various income ranges: 983.9% for AGIs below $25k, 3367.7% for AGIs $25k-50k, 6049.6% for AGIs $50k-75k, 8500.6% for AGIs $75k-100k, 16369.3% for AGIs $100k-200k, 98764.0% for AGIs over 200k)
Taxable interest for individuals: $1,675 (reported on 29.5% of returns)
This zip code:
$1,675
Pennsylvania:
$1,633
(% of AGI for various income ranges: 22.8% for AGIs below $25k, 20.9% for AGIs $25k-50k, 26.8% for AGIs $50k-75k, 54.0% for AGIs $75k-100k, 146.6% for AGIs $100k-200k, 2579.0% for AGIs over 200k)
Ordinary dividends: $6,017 (reported on 20.3% of returns)
Here:
$6,017
State:
$7,382
(% of AGI for various income ranges: 40.9% for AGIs below $25k, 42.4% for AGIs $25k-50k, 74.2% for AGIs $50k-75k, 140.2% for AGIs $75k-100k, 373.3% for AGIs $100k-200k, 6692.0% for AGIs over 200k)
Net capital gain/loss in AGI: +$9,180 (reported on 17.0% of returns)
Here:
+$9,180
State:
+$23,522
(% of AGI for various income ranges: 11.5% for AGIs below $25k, 28.2% for AGIs $25k-50k, 67.8% for AGIs $50k-75k, 136.3% for AGIs $75k-100k, 511.1% for AGIs $100k-200k, 10667.0% for AGIs over 200k)
Profit/loss from business: +$12,868 (reported on 10.6% of returns)
Here:
+$12,868
State:
+$16,274
(% of AGI for various income ranges: 75.5% for AGIs below $25k, 93.7% for AGIs $25k-50k, 108.2% for AGIs $50k-75k, 178.2% for AGIs $75k-100k, 493.4% for AGIs $100k-200k, 4228.0% for AGIs over 200k)
Taxable individual retirement arrangement distribution: $16,352 (reported on 12.9% of returns)
19607:
$16,352
Pennsylvania:
$18,583
(% of AGI for various income ranges: 110.2% for AGIs below $25k, 122.0% for AGIs $25k-50k, 218.4% for AGIs $50k-75k, 414.9% for AGIs $75k-100k, 882.2% for AGIs $100k-200k, 3796.0% for AGIs over 200k)
Self-employed (Keogh) retirement plans: $16,300 (reported on 0.4% of returns)
19607:
$16,300
Pennsylvania:
$25,407
(% of AGI for various income ranges: 36.9% for AGIs $75k-100k, 464.0% for AGIs over 200k)
Total itemized deductions: $30,499 (reported on 5.7% of returns)
Here:
$30,499
State:
$34,850
(% of AGI for various income ranges: 43.2% for AGIs below $25k, 83.0% for AGIs $25k-50k, 187.8% for AGIs $50k-75k, 274.3% for AGIs $75k-100k, 526.8% for AGIs $100k-200k, 6989.0% for AGIs over 200k)
Charity contributions: $12,769 (reported on 4.3% of returns)
Here:
$12,769
State:
$12,392
(% of AGI for various income ranges: 2.0% for AGIs below $25k, 10.9% for AGIs $25k-50k, 30.4% for AGIs $50k-75k, 52.7% for AGIs $75k-100k, 103.2% for AGIs $100k-200k, 4301.0% for AGIs over 200k)
Taxes paid: $7,648 (reported on 5.7% of returns)
19607:
$7,648
State:
$8,200
(% of AGI for various income ranges: 9.8% for AGIs below $25k, 20.2% for AGIs $25k-50k, 59.6% for AGIs $50k-75k, 102.8% for AGIs $75k-100k, 163.6% for AGIs $100k-200k, 957.0% for AGIs over 200k)
Earned income credit: $1,951 (reported on 11.5% of returns)
Here:
$1,951
State:
$2,100
(% of AGI for various income ranges: 58.2% for AGIs below $25k, 51.4% for AGIs $25k-50k)
Percentage of individuals using paid preparers for their 2020 taxes: 93.0%
Here:
93%
State:
92%
(% for various income ranges: 89.7% for AGIs below $25k, 94.0% for AGIs $25k-50k, 94.6% for AGIs $50k-75k, 93.8% for AGIs $75k-100k, 94.3% for AGIs $100k-200k, 97.1% for AGIs over 200k)
Averages for the 2012 tax year for zip code 19607, filed in 2013:
Average Adjusted Gross Income (AGI) in 2012: $58,255 (Individual Income Tax Returns)
Here:
$58,255
State:
$61,346
Salary/wage: $51,033 (reported on 79.5% of returns)
Here:
$51,033
State:
$51,902
(% of AGI for various income ranges: 62.2% for AGIs below $25k, 78.3% for AGIs $25k-50k, 77.2% for AGIs $50k-75k, 77.5% for AGIs $75k-100k, 76.6% for AGIs $100k-200k, 49.2% for AGIs over 200k)
Taxable interest for individuals: $1,890 (reported on 38.8% of returns)
This zip code:
$1,890
Pennsylvania:
$1,588
(% of AGI for various income ranges: 2.3% for AGIs below $25k, 0.8% for AGIs $25k-50k, 0.8% for AGIs $50k-75k, 0.5% for AGIs $75k-100k, 0.8% for AGIs $100k-200k, 2.4% for AGIs over 200k)
Ordinary dividends: $6,488 (reported on 24.8% of returns)
Here:
$6,488
State:
$5,827
(% of AGI for various income ranges: 2.9% for AGIs below $25k, 1.2% for AGIs $25k-50k, 1.3% for AGIs $50k-75k, 1.4% for AGIs $75k-100k, 1.8% for AGIs $100k-200k, 6.6% for AGIs over 200k)
Net capital gain/loss in AGI: +$7,896 (reported on 17.7% of returns)
Here:
+$7,896
State:
+$14,495
(% of AGI for various income ranges: 0.1% for AGIs $25k-50k, 0.2% for AGIs $50k-75k, 0.7% for AGIs $75k-100k, 0.9% for AGIs $100k-200k, 8.9% for AGIs over 200k)
Profit/loss from business: +$13,328 (reported on 10.8% of returns)
Here:
+$13,328
State:
+$16,268
(% of AGI for various income ranges: 4.9% for AGIs below $25k, 2.0% for AGIs $25k-50k, 2.2% for AGIs $50k-75k, 1.8% for AGIs $75k-100k, 3.0% for AGIs $100k-200k, 2.2% for AGIs over 200k)
Taxable individual retirement arrangement distribution: $12,807 (reported on 15.8% of returns)
19607:
$12,807
Pennsylvania:
$14,550
(% of AGI for various income ranges: 6.2% for AGIs below $25k, 3.3% for AGIs $25k-50k, 2.9% for AGIs $50k-75k, 3.6% for AGIs $75k-100k, 3.7% for AGIs $100k-200k, 3.0% for AGIs over 200k)
Self-employment retirement plans: $16,440 (reported on 0.4% of returns)
19607:
$16,440
Pennsylvania:
$20,922
Total itemized deductions: $20,285 (18% of AGI, reported on 33.1% of returns)
Here:
$20,285
State:
$23,538
Here:
18.4% of AGI
State:
18.4% of AGI
(% of AGI for various income ranges: 10.5% for AGIs below $25k, 9.4% for AGIs $25k-50k, 11.8% for AGIs $50k-75k, 12.7% for AGIs $75k-100k, 14.0% for AGIs $100k-200k, 10.3% for AGIs over 200k)
Charity contributions: $3,057 (reported on 25.7% of returns)
Here:
$3,057
State:
$4,025
(% of AGI for various income ranges: 0.7% for AGIs below $25k, 0.8% for AGIs $25k-50k, 1.2% for AGIs $50k-75k, 1.3% for AGIs $75k-100k, 1.6% for AGIs $100k-200k, 1.9% for AGIs over 200k)
Taxes paid: $8,792 (reported on 33.0% of returns)
19607:
$8,792
State:
$9,982
(% of AGI for various income ranges: 2.7% for AGIs below $25k, 3.2% for AGIs $25k-50k, 4.5% for AGIs $50k-75k, 5.2% for AGIs $75k-100k, 6.8% for AGIs $100k-200k, 5.5% for AGIs over 200k)
Earned income credit: $1,919 (reported on 12.0% of returns)
Here:
$1,919
State:
$2,106
(% of AGI for various income ranges: 3.9% for AGIs below $25k, 0.7% for AGIs $25k-50k)
Percentage of individuals using paid preparers for their 2012 taxes: 53.9%
Here:
54%
State:
53%
(% for various income ranges: 50.2% for AGIs below $25k, 53.4% for AGIs $25k-50k, 54.9% for AGIs $50k-75k, 57.7% for AGIs $75k-100k, 58.2% for AGIs $100k-200k, 76.0% for AGIs over 200k)
Averages for the 2004 tax year for zip code 19607, filed in 2005:
Average Adjusted Gross Income (AGI) in 2004: $49,669 (Individual Income Tax Returns)
Here:
$49,669
State:
$48,049
Salary/wage: $44,920 (reported on 80.9% of returns)
Here:
$44,920
State:
$42,646
(% of AGI for various income ranges: 75.2% for AGIs below $10k, 64.1% for AGIs $10k-25k, 80.8% for AGIs $25k-50k, 81.6% for AGIs $50k-75k, 81.4% for AGIs $75k-100k, 63.4% for AGIs over 100k)
Taxable interest for individuals: $1,792 (reported on 53.5% of returns)
This zip code:
$1,792
Pennsylvania:
$1,657
(% of AGI for various income ranges: 8.3% for AGIs below $10k, 3.7% for AGIs $10k-25k, 1.8% for AGIs $25k-50k, 1.3% for AGIs $50k-75k, 1.5% for AGIs $75k-100k, 1.9% for AGIs over 100k)
Taxable dividends: $3,603 (reported on 32.2% of returns)
Here:
$3,603
State:
$3,566
(% of AGI for various income ranges: 6.6% for AGIs below $10k, 2.7% for AGIs $10k-25k, 1.4% for AGIs $25k-50k, 1.1% for AGIs $50k-75k, 1.4% for AGIs $75k-100k, 3.6% for AGIs over 100k)
Net capital gain/loss: +$6,645 (reported on 24.4% of returns)
Here:
+$6,645
State:
+$9,716
(% of AGI for various income ranges: -4.4% for AGIs below $10k, 0.6% for AGIs $10k-25k, 0.5% for AGIs $25k-50k, 0.7% for AGIs $50k-75k, 1.4% for AGIs $75k-100k, 7.6% for AGIs over 100k)
Profit/loss from business: +$15,059 (reported on 11.6% of returns)
Here:
+$15,059
State:
+$14,267
(% of AGI for various income ranges: 4.7% for AGIs below $10k, 4.9% for AGIs $10k-25k, 2.2% for AGIs $25k-50k, 1.6% for AGIs $50k-75k, 3.5% for AGIs $75k-100k, 4.9% for AGIs over 100k)
IRA payment deduction: $2,882 (reported on 2.8% of returns)
19607:
$2,882
Pennsylvania:
$2,903
(% of AGI for various income ranges: 0.2% for AGIs $10k-25k, 0.3% for AGIs $25k-50k, 0.2% for AGIs $50k-75k, 0.2% for AGIs $75k-100k, 0.1% for AGIs over 100k)
Self-employed pension: $11,467 (reported on 0.8% of returns)
Here:
$11,467
Pennsylvania:
$14,674
Total itemized deductions: $16,124 (17% of AGI, reported on 33.6% of returns)
Here:
$16,124
State:
$18,804
Here:
17.3% of AGI
State:
19.5% of AGI
(% of AGI for various income ranges: 11.1% for AGIs below $10k, 8.1% for AGIs $10k-25k, 10.7% for AGIs $25k-50k, 12.0% for AGIs $50k-75k, 13.8% for AGIs $75k-100k, 10.0% for AGIs over 100k)
Charity contributions deductions: $2,639 (3% of AGI, reported on 29.3% of returns)
Here:
$2,639
State:
$3,337
Here:
2.6% of AGI
State:
3.3% of AGI
(% of AGI for various income ranges: 0.4% for AGIs below $10k, 0.7% for AGIs $10k-25k, 1.1% for AGIs $25k-50k, 1.4% for AGIs $50k-75k, 1.7% for AGIs $75k-100k, 2.1% for AGIs over 100k)
Total tax: $8,552 (reported on 78.3% of returns)
19607:
$8,552
State:
$8,008
(% of AGI for various income ranges: 2.1% for AGIs below $10k, 4.5% for AGIs $10k-25k, 7.7% for AGIs $25k-50k, 9.4% for AGIs $50k-75k, 11.1% for AGIs $75k-100k, 21.9% for AGIs over 100k)
Earned income credit: $1,391 (reported on 8.6% of returns)
Here:
$1,391
State:
$1,643
Percentage of individuals using paid preparers for their 2004 taxes: 55.4%
Here:
55%
State:
56%
(% for various income ranges: 49.3% for AGIs below $10k, 58.1% for AGIs $10k-25k, 54.7% for AGIs $25k-50k, 56.3% for AGIs $50k-75k, 55.9% for AGIs $75k-100k, 63.8% for AGIs over 100k)
Household received Food Stamps/SNAP in the past 12 months: 1,149 Household did not receive Food Stamps/SNAP in the past 12 months: 8,518
Women who had a birth in the past 12 months: 388 (231 now married, 147 unmarried) Women who did not have a birth in the past 12 months: 5,271 (1,990 now married, 3,284 unmarried)
Housing units in zip code 19607 with a mortgage: 4,067 (613 second mortgage, 7 home equity loan, 520 both second mortgage and home equity loan) Houses without a mortgage: 337
Median monthly owner costs for units with a mortgage: $1,612 Median monthly owner costs for units without a mortgage: $663
Residents with income below the poverty level in 2022:
This zip code:
11.7%
Whole state:
11.8%
Residents with income below 50% of the poverty level in 2022:
This zip code:
6.6%
Whole state:
6.1%
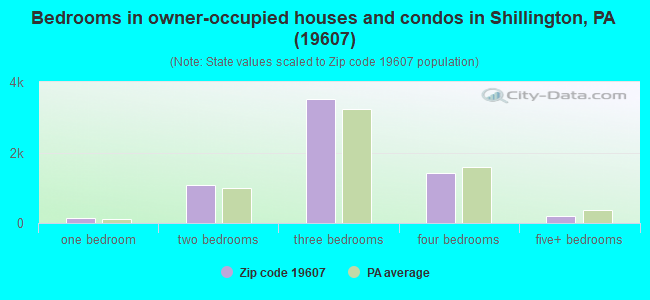
Median number of rooms in houses and condos:
Here:
6.7
State:
6.8
Median number of rooms in apartments:
Here:
4.6
State:
4.3
Notable locations in this zip code not listed on our city pages
Notable locations in zip code 19607: Flying Hills Golf Course (A), Saint Joseph's Villa (B), Flying Hills Corporate Center (C), Fritz Island Wastewater Treatment Plant (D), Berks County Fire Training Center (E), Saint Mary's Picnic Grove (F), Green Hills Corporate Center (G), K Mart Shopping Plaza (H), Kenhorst Plaza (I), Sheerlund Forests (J), Veronica Hall (K), Nursing Resource Center (L), Judge Hall (M), Graduate Center (N), Franco Library (O), Francis Hall Residence (P), Clare Hall (Q), Business and Education Building (R), Bernardine Hall with New Science Building (S), Assist Hall (T). Display/hide their locations on the map
Churches in zip code 19607 include: Sacret Heart Convent (A), Incarnation Lutheran Church (B), Immanuel United Church of Christ (C), Grace Evangelical Lutheran Church (D), New Life Assembly of God (E), Saint Stephen's Polish Roman Catholic Church (F), Saint Luke's Evangelical Congregational Church (G), Saint John Baptist de la Salle Roman Catholic Church (H), Shillington Church of Christ (I). Display/hide their locations on the map
Cemeteries: Mount Sinai Cemetery (1), Shomre Habrith Cemetery (2), Fairview Cemetery (3), Saint Marys Cemetery (4), Saint Mary's Cemetery (5), Saint Stephens Memorial Cemetery (6), Nativity of the Blessed Virgin Mary Cemetery (7). Display/hide their locations on the map
Parks in zip code 19607 include: Angelica Park (1), Brookline Playground (2), Kenhorst Playground (3), Pennwyn Playground (4), Shillington Park (5), Montrose Manor Playground (6). Display/hide their locations on the map
2,768 married couples with children.
1,848 single-parent households (602 men, 1,246 women).
82.7% of residents of 19607 zip code speak English at home.
14.4% of residents speak Spanish at home (63% very well, 22% well, 13% not well, 2% not at all).
1.9% of residents speak other Indo-European language at home (89% very well, 5% well, 6% not well).
0.3% of residents speak Asian or Pacific Island language at home (46% very well, 27% well, 27% not well).
1.1% of residents speak other language at home (69% very well, 31% well).
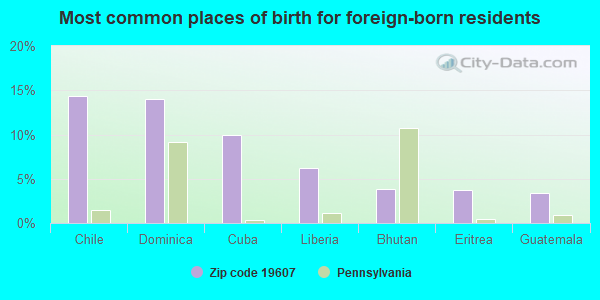
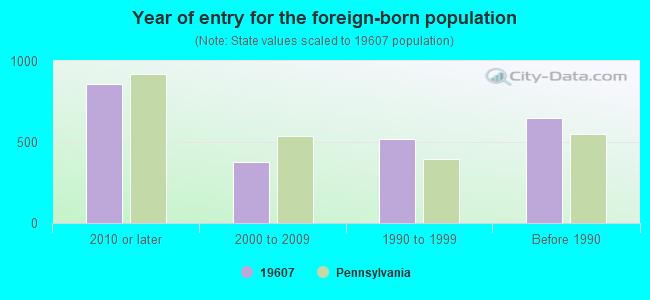
Foreign born population: 1,725 (7.2%) (73.2% of them are naturalized citizens)
Facilities with environmental interests located in this zip code:
ATLANTIC SHILLINGTON SVC STA (405 W LANCASTER AVE in SHILLINGTON, PA)
STATE MASTER (Pennsylvania database) - RCRIS-PAD982678401, HAZARDOUS WASTE PROGRAM (Resource Conservation and Recovery Act (tracking hazardous waste)) Organizations: OPERNAME (CONTACT/OPERATOR)
, ATLANTIC REF & MKT CO (CONTACT/OWNER)
, ATLANTIC REFINING & MARKETING CORPORATION (CONTACT/OWNER)
Alternative names: ATLANTIC SERVICE STATION
AW GOLDEN CADILLAC PONTIAC (801 LANCASTER AVE in READING, PA)
STATE MASTER (Pennsylvania database) - RCRIS-PAD008939142, HAZARDOUS WASTE PROGRAM Small Quantity Generators, between 100 kg and 1000 kg of hazardous waste/month (Resource Conservation and Recovery Act (tracking hazardous waste)) - notification Organizations: OPERNAME (CONTACT/OPERATOR)
, OWNERNAME (CONTACT/OWNER)
Alternative names: GOLDEN A W CADILLAC PONTIAC
BELL TELEPHONE OF PA SHILLINGTON SXS (216 W WALNUT ST in SHILLINGTON, PA)
AIR MINOR (AIRS/AFS) Business SIC classification: AUTOMOTIVE REPAIR SHOPS
BEAR ALIGNMENT DISCOUNT TIRE (1347 LANCASTER AVE in READING, PA)
Small Quantity Generators, between 100 kg and 1000 kg of hazardous waste/month (Resource Conservation and Recovery Act (tracking hazardous waste)) - notification Organizations: OPERNAME (CONTACT/OPERATOR)
, BLUM MEL (CONTACT/OWNER)
Housing units lacking complete plumbing facilities: 1.3% Housing units lacking complete kitchen facilities: 2.6%
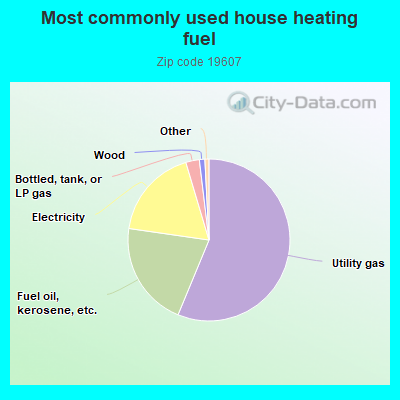
56.2%Utility gas
21.0%Fuel oil, kerosene, etc.
18.1%Electricity
2.7%Bottled, tank, or LP gas
1.1%Wood
Population in 1990: 19,281. Population change in the 1990s: +1,406 (+7.3%).
Place of birth for U.S.-born residents:
This state: 17,530
Northeast: 2,030
Midwest: 468
South: 942
West: 526
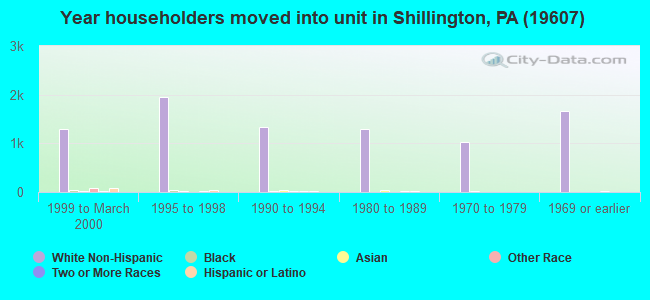
64% of the 19607 zip code residents lived in the same house 5 years ago. Out of people who lived in different houses, 69% lived in this county. Out of people who lived in different counties, 50% lived in Pennsylvania.
85% of the 19607 zip code residents lived in the same house 1 year ago. Out of people who lived in different houses, 62% moved from this county. Out of people who lived in different houses, 17% moved from different county within same state. Out of people who lived in different houses, 16% moved from different state. Out of people who lived in different houses, 2% moved from abroad.
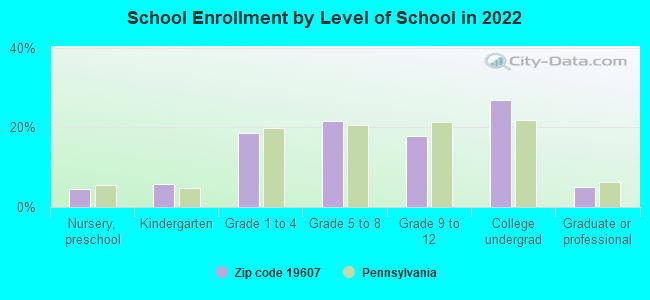
Private vs. public school enrollment:
Students in private schools in grades 1 to 8 (elementary and middle school): 337
Here:
15.9%
Pennsylvania:
15.7%
Students in private schools in grades 9 to 12 (high school): 89
Here:
9.4%
Pennsylvania:
13.4%
Students in private undergraduate colleges: 544
Here:
37.9%
Pennsylvania:
39.8%
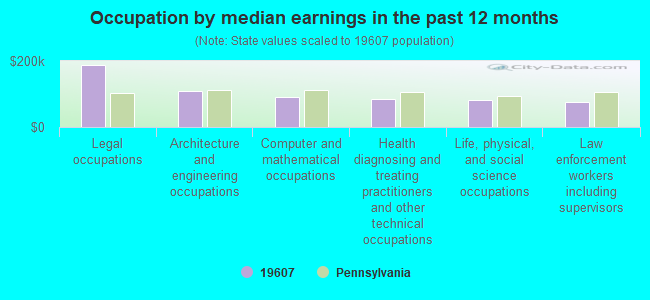
Occupation by median earnings in the past 12 months ($)
188,837Legal occupations
110,122Architecture and engineering occupations
92,050Computer and mathematical occupations
86,359Health diagnosing and treating practitioners and other technical occupations
82,848Life, physical, and social science occupations
76,806Law enforcement workers including supervisors
Companies with federal contracts located in this zip code (READING, PA):
UGI UTILITIES, INC (100 KACHEL BLVD 400) : $984,822 in 26 contractsfrom 2001 to 2006
Contracts for Gas Services, Maintenance, Repair or Alteration of Real Property -- Other Utilities, Facilities Operations Support Services, Gases: Compressed and Liquefied, and moreby Department of Veterans Affairs, Defense Logistics Agency, Public Buildings Service, Army, and others Signed by year:2000: $0; 2001: $139,608; 2002: $0; 2003: $96,000; 2004: $119,964; 2005: $330,661; 2006: $298,589.
Biggest contracts:
$188,570 with Department of Veterans Affairs for Gas Services. Signed on 2006-01-01. Completion date: 2006-03-31.
$108,835, same as above.Signed on 2005-10-01. Completion date: 2005-12-31.
$106,266, same as above.Signed on 2005-07-01. Completion date: 2005-09-30.
$104,213, same as above.Signed on 2006-04-01. Completion date: 2006-06-30.
SALIENT 3 COMMUNICATIONS INC (2675 MORGANTOWN RD) : $403,106 in 26 contractsfrom 2000 to 2003
Contracts for Administrative and Service Buildings by Navy Signed by year:2000: $165,172; 2001: $82,576; 2002: $121,515; 2003: $33,843; 2004: $0; 2005: $0; 2006: $0.
Biggest contracts:
$91,997 with Navy for Administrative and Service Buildings. Signed on 2000-06-20. Completion date: 2000-06-30.
$74,361, same as above.Signed on 2002-03-25. Completion date: 2000-06-30.
$36,171, same as above.Signed on 2000-03-22. Completion date: 2000-06-30.
$32,554, same as above.Signed on 2002-05-08. Completion date: 2000-06-30.
PARSONS POWER GROUP, INC. (2675 MORGANTOWN RD) : $254,537 in 5 contractsin 2001
Contracts for Other Environmental Protection -- Advanced Development (R&D), Other Architect and Engineering Services by Navy Signed by year:2000: $0; 2001: $254,537; 2002: $0; 2003: $0; 2004: $0; 2005: $0; 2006: $0.
Biggest contracts:
$81,184 with Navy for Other Environmental Protection -- Advanced Development (R&D). Taking place in CA. Signed on 2001-01-12. Completion date: 2000-12-31.
$71,305 with Navy for Other Architect and Engineering Services. Taking place in ME. Signed on 2001-01-18. Completion date: 2002-01-11.
$60,525 with Navy for Other Architect and Engineering Services. Taking place in NJ. Signed on 2001-01-23. Completion date: 2002-01-11.
$28,026, same as above.Signed on 2001-01-23. Completion date: 2002-01-11.
PENSKE LOGISTICS LLC (ROUTE 10 AND PHEASANT ROAD) : $175,655 in 6 contractsfrom 2003 to 2006
Contracts for Lease or Rental of Equipment -- Ground Effect Vehicles, Motor Vehicles, Trailers, and Cycles by Air Force, Navy Signed by year:2000: $0; 2001: $0; 2002: $0; 2003: $47,700; 2004: $27,930; 2005: $90,825; 2006: $9,200.
Biggest contracts:
$86,850 with Air Force for Lease or Rental of Equipment -- Ground Effect Vehicles, Motor Vehicles, Trailers, and Cycles. Taking place in DC. Signed on 2005-07-15. Completion date: 2005-07-01.
$47,700, same as above.Signed on 2003-12-31. Completion date: 2004-12-31.
$23,850, same as above.Signed on 2004-12-31. Completion date: 2005-06-30.
$9,200, same as above.Signed on 2006-06-15. Completion date: 2006-08-14.
HORA INC (2299 LANCASTER PIKE; small business) : $60,477 in 5 contractsfrom 2003 to 2005
Contracts for Lodging - Hotel/Motel by Army Signed by year:2000: $0; 2001: $0; 2002: $0; 2003: $54,150; 2004: $0; 2005: $6,327; 2006: $0.
Biggest contracts:
$39,729 with Army for Lodging - Hotel/Motel. Signed on 2003-01-14. Completion date: 2003-01-20.
$13,737, same as above.Signed on 2003-01-24. Completion date: 2003-01-24.
$3,876, same as above.Signed on 2005-02-10. Completion date: 2005-03-04.
$2,451, same as above.Signed on 2005-04-27. Completion date: 2005-03-04.
SKIP'S II PROPELLER SERVICE (401 MADISON ST) : $53,841 in 4 contractsfrom 2003 to 2005
$15,638 with U.S. Army Corps of Engineers - civil program financing only for Bridges, Fixed and Floating. Signed on 2005-03-15. Completion date: 2005-06-01.
$15,638 with Army for Bridges, Fixed and Floating. Signed on 2005-03-15. Completion date: 2005-06-01.
$13,526 with Army for Miscellaneous Items. Signed on 2004-09-21. Completion date: 2004-10-18.
$9,039 with U.S. Army Corps of Engineers - civil program financing only for Floating Drydocks. Signed on 2003-05-28. Completion date: 2003-06-27.
EGAN AUTOMOTIVE SPECIALISTS IN (914 FERN AVE; small business)
$50,000 with Army for Vehicular Cab, Body, and Frame Structural Components. Signed on 2002-07-31. Completion date: 2003-06-15.
MIFFLIN VALLEY, INC (31 S STERLEY ST) : $46,898 in 2 contractsfrom 2003 to 2004
$42,911 with Navy for Underwear and Nightwear, Men's. Signed on 2003-02-27. Completion date: 2003-02-21.
$3,987 with Army for Clothing, Special Purpose. Taking place in VA. Signed on 2004-03-15. Completion date: 2004-04-12.
KUTZ, E M INC (2456 MORGANTOWN RD; small business) : $35,001 in 2 contractsin 2004
$25,704 with National Park Service for Vehicular Cab, Body, and Frame Structural Components. Signed on 2004-09-10. Completion date: 2004-11-30.
$9,297 with Army for Construction of Structures and Facilities -- Government-Owned Government-Operated (GOGO) R&D Facilities. Signed on 2004-09-27. Completion date: 2004-10-27.
Top industries in this zip code by the number of employees in 2005:
2002 - 2018 National Fire Incident Reporting System (NFIRS) incidents
According to the data from the years 2002 - 2018 the average number of fires per year is 83. The highest number of reported fire incidents - 163 took place in 2016, and the least - 1 in 2011. The data has a rising trend.
When looking into fire subcategories, the most reports belonged to: Structure Fires (68.2%), and Outside Fires (16.5%).
Fire incident types reported to NFIRS in Zip Code 19607


 Nearest zip codes: 19611, 19602, 19610, 19540, 19601, 19609.


 According to the data from the years 2002 - 2018 the average number of fires per year is 83. The highest number of reported fire incidents - 163 took place in 2016, and the least - 1 in 2011. The data has a rising trend.
 When looking into fire subcategories, the most reports belonged to: Structure Fires (68.2%), and Outside Fires (16.5%).