Estimated zip code population in 2022: 37,813 Zip code population in 2010: 36,240 Zip code population in 2000: 35,105
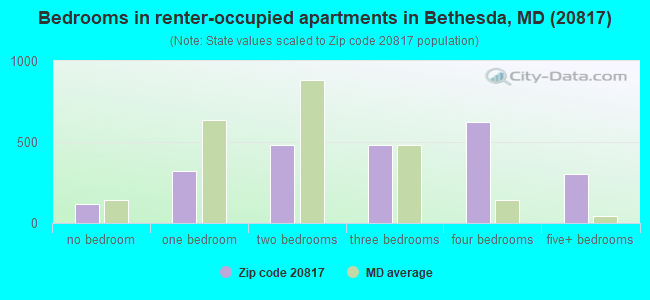
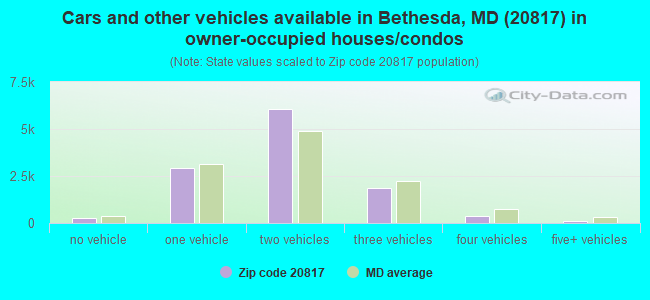
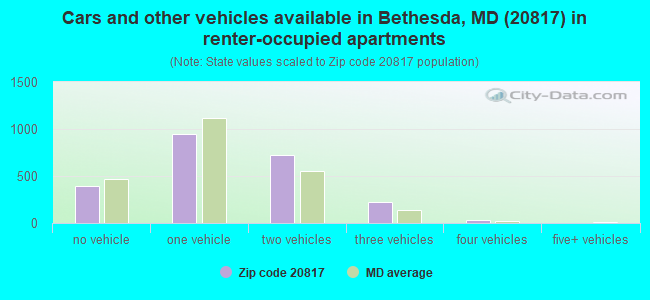
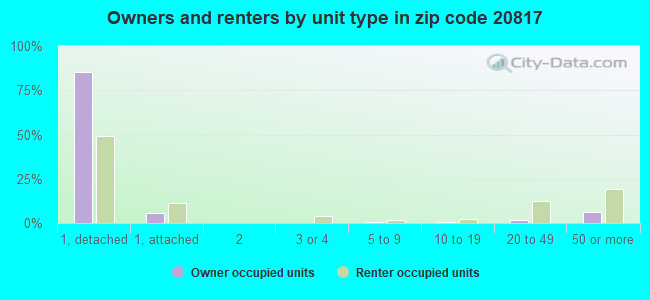
Houses and condos: 14,386 Renter-occupied apartments: 2,324
% of renters here:
17%
State:
32%
March 2022 cost of living index in zip code 20817: 187.0 (very high, U.S. average is 100)
Land area: 13.9 sq. mi. Water area: 0.1 sq. mi.
Population density: 2,726 people per square mile
(average).
OSM Map
General Map
Google Map
MSN Map
OSM Map
General Map
Google Map
MSN Map
OSM Map
General Map
Google Map
MSN Map
OSM Map
General Map
Google Map
MSN Map
Please wait while loading the map...
Real estate property taxes paid for housing units in 2022:
This zip code:
0.9% ($9,735)
Maryland:
0.9% ($3,777)
Median real estate property taxes paid for housing units with mortgages in 2022: $9,731 (0.8%) Median real estate property taxes paid for housing units with no mortgage in 2022: $9,428 (0.9%)
Estimated median house/condo value in 2022: $1,131,525
20817:
$1,131,525
Maryland:
$398,100
According to our research of Maryland and other state lists, there were 4 registered sex offenders living in 20817 zip code as of April 26, 2024. The ratio of all residents to sex offenders in zip code 20817 is 9,346 to 1. The ratio of registered sex offenders to all residents in this zip code is much lower than the state average.
Median resident age:
This zip code:
46.1 years
Maryland median age:
39.7 years
Average household size:
This zip code:
2.7 people
Maryland:
2.5 people
Averages for the 2020 tax year for zip code 20817, filed in 2021:
Average Adjusted Gross Income (AGI) in 2020: $311,772 (Individual Income Tax Returns)
Here:
$311,772
State:
$86,905
Salary/wage: $213,220 (reported on 73.1% of returns)
Here:
$213,220
State:
$73,953
(% of AGI for various income ranges: 1271.1% for AGIs below $25k, 3749.5% for AGIs $25k-50k, 6909.6% for AGIs $50k-75k, 9847.5% for AGIs $75k-100k, 19220.5% for AGIs $100k-200k, 128505.4% for AGIs over 200k)
Taxable interest for individuals: $5,175 (reported on 70.1% of returns)
This zip code:
$5,175
Maryland:
$1,528
(% of AGI for various income ranges: 67.5% for AGIs below $25k, 121.5% for AGIs $25k-50k, 169.7% for AGIs $50k-75k, 354.9% for AGIs $75k-100k, 523.8% for AGIs $100k-200k, 2832.4% for AGIs over 200k)
Ordinary dividends: $22,811 (reported on 59.5% of returns)
Here:
$22,811
State:
$8,028
(% of AGI for various income ranges: 191.9% for AGIs below $25k, 288.5% for AGIs $25k-50k, 446.5% for AGIs $50k-75k, 960.2% for AGIs $75k-100k, 1793.5% for AGIs $100k-200k, 11076.8% for AGIs over 200k)
Net capital gain/loss in AGI: +$97,833 (reported on 56.1% of returns)
Here:
+$97,833
State:
+$25,238
(% of AGI for various income ranges: 162.8% for AGIs below $25k, 263.7% for AGIs $25k-50k, 561.3% for AGIs $50k-75k, 791.1% for AGIs $75k-100k, 1751.7% for AGIs $100k-200k, 51948.8% for AGIs over 200k)
Profit/loss from business: +$44,611 (reported on 24.7% of returns)
Here:
+$44,611
State:
+$11,398
(% of AGI for various income ranges: 215.9% for AGIs below $25k, 408.1% for AGIs $25k-50k, 601.5% for AGIs $50k-75k, 874.2% for AGIs $75k-100k, 1496.6% for AGIs $100k-200k, 8677.7% for AGIs over 200k)
Taxable individual retirement arrangement distribution: $37,653 (reported on 13.2% of returns)
20817:
$37,653
Maryland:
$20,944
(% of AGI for various income ranges: 65.4% for AGIs below $25k, 173.5% for AGIs $25k-50k, 355.2% for AGIs $50k-75k, 659.4% for AGIs $75k-100k, 1359.0% for AGIs $100k-200k, 3229.5% for AGIs over 200k)
Self-employed (Keogh) retirement plans: $44,762 (reported on 7.2% of returns)
20817:
$44,762
Maryland:
$29,558
(% of AGI for various income ranges: 61.8% for AGIs $50k-75k, 80.4% for AGIs $75k-100k, 217.9% for AGIs $100k-200k, 2949.2% for AGIs over 200k)
Total itemized deductions: $47,782 (reported on 42.3% of returns)
Here:
$47,782
State:
$30,672
(% of AGI for various income ranges: 339.9% for AGIs below $25k, 615.7% for AGIs $25k-50k, 1182.1% for AGIs $50k-75k, 2284.3% for AGIs $75k-100k, 3691.0% for AGIs $100k-200k, 14966.9% for AGIs over 200k)
Charity contributions: $17,801 (reported on 36.7% of returns)
Here:
$17,801
State:
$9,065
(% of AGI for various income ranges: 14.8% for AGIs below $25k, 57.0% for AGIs $25k-50k, 118.5% for AGIs $50k-75k, 266.4% for AGIs $75k-100k, 475.9% for AGIs $100k-200k, 5878.2% for AGIs over 200k)
Taxes paid: $9,575 (reported on 42.2% of returns)
20817:
$9,575
State:
$8,475
(% of AGI for various income ranges: 69.3% for AGIs below $25k, 162.4% for AGIs $25k-50k, 316.8% for AGIs $50k-75k, 628.3% for AGIs $75k-100k, 1025.2% for AGIs $100k-200k, 2641.4% for AGIs over 200k)
Earned income credit: $1,553 (reported on 3.2% of returns)
Here:
$1,553
State:
$2,151
(% of AGI for various income ranges: 37.2% for AGIs below $25k, 28.9% for AGIs $25k-50k)
Percentage of individuals using paid preparers for their 2020 taxes: 89.0%
Here:
89%
State:
90%
(% for various income ranges: 87.5% for AGIs below $25k, 88.2% for AGIs $25k-50k, 87.9% for AGIs $50k-75k, 87.9% for AGIs $75k-100k, 86.5% for AGIs $100k-200k, 91.6% for AGIs over 200k)
Averages for the 2012 tax year for zip code 20817, filed in 2013:
Average Adjusted Gross Income (AGI) in 2012: $258,337 (Individual Income Tax Returns)
Here:
$258,337
State:
$72,703
Salary/wage: $173,792 (reported on 74.5% of returns)
Here:
$173,792
State:
$62,228
(% of AGI for various income ranges: 69.8% for AGIs below $25k, 67.5% for AGIs $25k-50k, 58.8% for AGIs $50k-75k, 57.6% for AGIs $75k-100k, 63.2% for AGIs $100k-200k, 47.2% for AGIs over 200k)
Taxable interest for individuals: $4,912 (reported on 70.7% of returns)
This zip code:
$4,912
Maryland:
$1,413
(% of AGI for various income ranges: 3.4% for AGIs below $25k, 2.5% for AGIs $25k-50k, 1.8% for AGIs $50k-75k, 1.5% for AGIs $75k-100k, 1.3% for AGIs $100k-200k, 1.3% for AGIs over 200k)
Ordinary dividends: $19,738 (reported on 58.2% of returns)
Here:
$19,738
State:
$6,933
(% of AGI for various income ranges: 9.4% for AGIs below $25k, 5.0% for AGIs $25k-50k, 4.7% for AGIs $50k-75k, 4.4% for AGIs $75k-100k, 4.4% for AGIs $100k-200k, 4.4% for AGIs over 200k)
Net capital gain/loss in AGI: +$63,773 (reported on 52.3% of returns)
Here:
+$63,773
State:
+$14,830
(% of AGI for various income ranges: 2.3% for AGIs below $25k, 1.4% for AGIs $25k-50k, 1.4% for AGIs $50k-75k, 1.2% for AGIs $75k-100k, 2.1% for AGIs $100k-200k, 15.5% for AGIs over 200k)
Profit/loss from business: +$47,923 (reported on 24.0% of returns)
Here:
+$47,923
State:
+$12,606
(% of AGI for various income ranges: 11.9% for AGIs below $25k, 7.7% for AGIs $25k-50k, 5.3% for AGIs $50k-75k, 6.1% for AGIs $75k-100k, 5.4% for AGIs $100k-200k, 4.1% for AGIs over 200k)
Taxable individual retirement arrangement distribution: $35,797 (reported on 17.4% of returns)
20817:
$35,797
Maryland:
$17,065
(% of AGI for various income ranges: 3.2% for AGIs below $25k, 3.3% for AGIs $25k-50k, 4.2% for AGIs $50k-75k, 4.4% for AGIs $75k-100k, 4.0% for AGIs $100k-200k, 2.0% for AGIs over 200k)
Self-employment retirement plans: $37,838 (reported on 7.5% of returns)
20817:
$37,838
Maryland:
$24,439
(% of AGI for various income ranges: 1.1% for AGIs below $25k, 0.2% for AGIs $50k-75k, 0.6% for AGIs $75k-100k, 0.7% for AGIs $100k-200k, 1.2% for AGIs over 200k)
Total itemized deductions: $64,888 (18% of AGI, reported on 68.0% of returns)
Here:
$64,888
State:
$27,886
Here:
17.7% of AGI
State:
22.8% of AGI
(% of AGI for various income ranges: 32.8% for AGIs below $25k, 22.7% for AGIs $25k-50k, 22.1% for AGIs $50k-75k, 23.8% for AGIs $75k-100k, 22.4% for AGIs $100k-200k, 15.7% for AGIs over 200k)
Charity contributions: $10,775 (reported on 60.3% of returns)
Here:
$10,775
State:
$4,452
(% of AGI for various income ranges: 1.4% for AGIs below $25k, 1.6% for AGIs $25k-50k, 2.0% for AGIs $50k-75k, 2.0% for AGIs $75k-100k, 2.3% for AGIs $100k-200k, 2.6% for AGIs over 200k)
Taxes paid: $36,230 (reported on 67.8% of returns)
20817:
$36,230
State:
$11,690
(% of AGI for various income ranges: 7.8% for AGIs below $25k, 6.9% for AGIs $25k-50k, 7.9% for AGIs $50k-75k, 10.1% for AGIs $75k-100k, 10.6% for AGIs $100k-200k, 9.4% for AGIs over 200k)
Earned income credit: $1,451 (reported on 3.4% of returns)
Here:
$1,451
State:
$2,199
(% of AGI for various income ranges: 1.9% for AGIs below $25k, 0.3% for AGIs $25k-50k)
Percentage of individuals using paid preparers for their 2012 taxes: 58.3%
Here:
58%
State:
52%
(% for various income ranges: 51.9% for AGIs below $25k, 52.1% for AGIs $25k-50k, 54.3% for AGIs $50k-75k, 55.9% for AGIs $75k-100k, 54.1% for AGIs $100k-200k, 69.6% for AGIs over 200k)
Averages for the 2004 tax year for zip code 20817, filed in 2005:
Average Adjusted Gross Income (AGI) in 2004: $179,347 (Individual Income Tax Returns)
Here:
$179,347
State:
$60,339
Salary/wage: $122,082 (reported on 71.8% of returns)
Here:
$122,082
State:
$52,211
(% of AGI for various income ranges: 61.4% for AGIs $10k-25k, 65.1% for AGIs $25k-50k, 55.4% for AGIs $50k-75k, 59.4% for AGIs $75k-100k, 46.8% for AGIs over 100k)
Taxable interest for individuals: $6,334 (reported on 76.5% of returns)
This zip code:
$6,334
Maryland:
$1,701
(% of AGI for various income ranges: 4.9% for AGIs $10k-25k, 3.3% for AGIs $25k-50k, 3.2% for AGIs $50k-75k, 2.9% for AGIs $75k-100k, 2.5% for AGIs over 100k)
Taxable dividends: $12,210 (reported on 64.7% of returns)
Here:
$12,210
State:
$4,235
(% of AGI for various income ranges: 7.4% for AGIs $10k-25k, 4.0% for AGIs $25k-50k, 5.2% for AGIs $50k-75k, 4.3% for AGIs $75k-100k, 4.2% for AGIs over 100k)
Net capital gain/loss: +$45,499 (reported on 57.5% of returns)
Here:
+$45,499
State:
+$15,888
(% of AGI for various income ranges: 4.1% for AGIs $10k-25k, 1.5% for AGIs $25k-50k, 1.3% for AGIs $50k-75k, 3.4% for AGIs $75k-100k, 16.0% for AGIs over 100k)
Profit/loss from business: +$42,462 (reported on 22.7% of returns)
Here:
+$42,462
State:
+$12,221
(% of AGI for various income ranges: 7.7% for AGIs $10k-25k, 6.5% for AGIs $25k-50k, 6.0% for AGIs $50k-75k, 5.1% for AGIs $75k-100k, 5.3% for AGIs over 100k)
IRA payment deduction: $3,394 (reported on 3.4% of returns)
20817:
$3,394
Maryland:
$2,968
(% of AGI for various income ranges: 0.5% for AGIs $10k-25k, 0.4% for AGIs $25k-50k, 0.2% for AGIs $50k-75k, 0.2% for AGIs $75k-100k, 0.0% for AGIs over 100k)
Self-employed pension: $25,980 (reported on 7.9% of returns)
Here:
$25,980
Maryland:
$17,155
(% of AGI for various income ranges: 0.2% for AGIs $10k-25k, 0.5% for AGIs $25k-50k, 0.7% for AGIs $50k-75k, 0.7% for AGIs $75k-100k, 1.2% for AGIs over 100k)
Total itemized deductions: $44,476 (17% of AGI, reported on 65.4% of returns)
Here:
$44,476
State:
$22,960
Here:
16.8% of AGI
State:
23.3% of AGI
(% of AGI for various income ranges: 24.5% for AGIs $10k-25k, 22.6% for AGIs $25k-50k, 24.6% for AGIs $50k-75k, 24.9% for AGIs $75k-100k, 15.0% for AGIs over 100k)
Charity contributions deductions: $8,545 (3% of AGI, reported on 59.6% of returns)
Here:
$8,545
State:
$4,031
Here:
3.0% of AGI
State:
3.9% of AGI
(% of AGI for various income ranges: 1.8% for AGIs $10k-25k, 2.2% for AGIs $25k-50k, 2.6% for AGIs $50k-75k, 3.0% for AGIs $75k-100k, 2.8% for AGIs over 100k)
Total tax: $44,054 (reported on 85.7% of returns)
20817:
$44,054
State:
$10,167
(% of AGI for various income ranges: 5.2% for AGIs $10k-25k, 8.7% for AGIs $25k-50k, 10.6% for AGIs $50k-75k, 11.2% for AGIs $75k-100k, 22.2% for AGIs over 100k)
Earned income credit: $1,219 (reported on 2.3% of returns)
Here:
$1,219
State:
$1,700
Percentage of individuals using paid preparers for their 2004 taxes: 58.1%
Here:
58%
State:
55%
(% for various income ranges: 55.0% for AGIs below $10k, 53.1% for AGIs $10k-25k, 51.4% for AGIs $25k-50k, 57.0% for AGIs $50k-75k, 54.2% for AGIs $75k-100k, 63.6% for AGIs over 100k)
Likely homosexual households (counted as self-reported same-sex unmarried-partner households)
Lesbian couples: 0.1% of all households
Gay men: 0.1% of all households
Household received Food Stamps/SNAP in the past 12 months: 400 Household did not receive Food Stamps/SNAP in the past 12 months: 13,352
Women who had a birth in the past 12 months: 310 (305 now married, 6 unmarried) Women who did not have a birth in the past 12 months: 7,298 (4,319 now married, 2,980 unmarried)
Housing units in zip code 20817 with a mortgage: 7,964 (1,310 second mortgage, 16 home equity loan, 1,186 both second mortgage and home equity loan) Houses without a mortgage: 156
Median monthly owner costs for units with a mortgage: $3,737 Median monthly owner costs for units without a mortgage: $1,347
Residents with income below the poverty level in 2022:
This zip code:
4.3%
Whole state:
9.6%
Residents with income below 50% of the poverty level in 2022:
This zip code:
2.3%
Whole state:
4.7%
Median number of rooms in houses and condos:
Here:
10.0
State:
7.3
Median number of rooms in apartments:
Here:
5.9
State:
4.2
Notable locations in this zip code not listed on our city pages
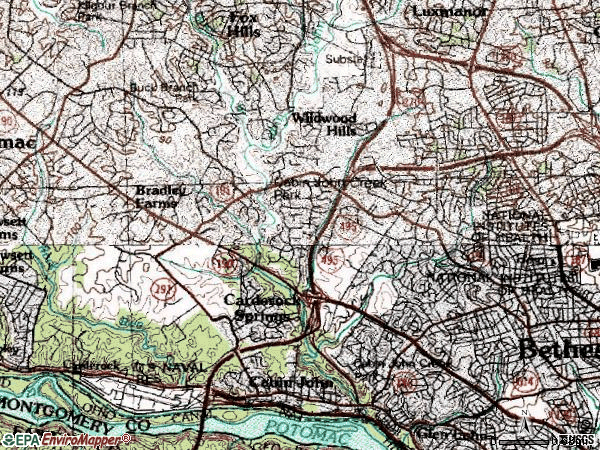
Notable locations in zip code 20817: Bethesda Country Club (A), Congressional Country Club (B), Kenwood Country Club (C), Rock Spring Industrial Park (D), Burning Tree Country Club (E), Cabin John Park Volunteer Fire Department Station 10 (F), Davis Library (G), Bethesda Fire Department Station 26 (H), Special Needs Library (I), Navel Ship Research and Development Fire Department (J). Display/hide their locations on the map
Churches in zip code 20817 include: Concord Church (A), Bethesda United Methodist Church (B), Saint Bartholemew Church (C), North Bethesda United Methodist Church (D), Wildwood Baptist Church (E), Bethesda United Church of Christ (F), Bradley Hills Church (G), Gibson Grove Church (H), Gunston-Temple Church (I). Display/hide their locations on the map
Parks in zip code 20817 include: Cabin John Regional Park (1), Wyngate Woods Park (2), Greentree Park (3), Fernwood Park (4), Bradley Hills Park (5), Cabin John Creek Stream Valley Park (6), Merrimack Park (7), Ayrlawn Park (8). Display/hide their locations on the map
8,685 married couples with children.
775 single-parent households (251 men, 524 women).
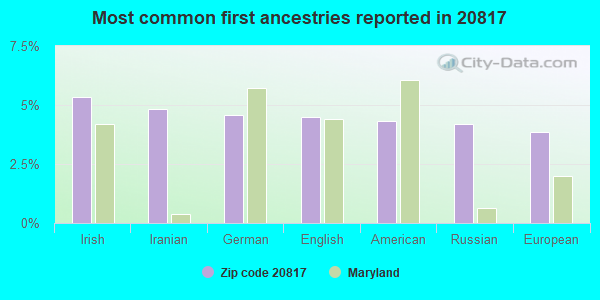
65.5% of residents of 20817 zip code speak English at home.
8.7% of residents speak Spanish at home (77% very well, 16% well, 4% not well, 2% not at all).
13.7% of residents speak other Indo-European language at home (82% very well, 12% well, 6% not well).
9.3% of residents speak Asian or Pacific Island language at home (68% very well, 18% well, 13% not well, 2% not at all).
3.2% of residents speak other language at home (65% very well, 20% well, 5% not well, 10% not at all).
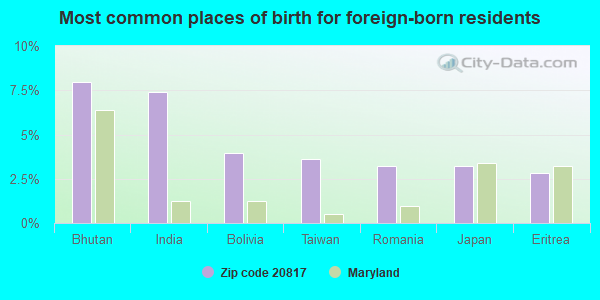
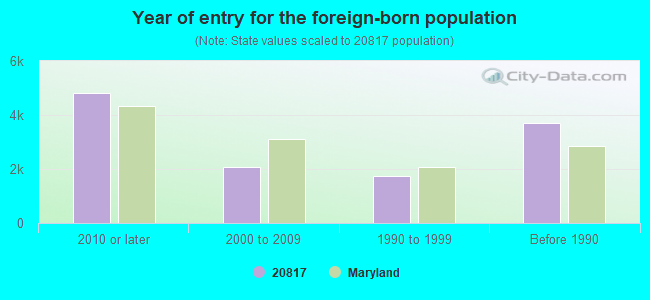
Foreign born population: 11,471 (30.3%) (60.1% of them are naturalized citizens)
Major facilities with environmental interests located in this zip code:
CARDEROCK DIVISION NAVAL SURFACE WARFARE CENTER (9500 MACARTHUR BOULEVARD in BETHESDA, MD) . Federal Facility. U.S. NAVY
AIR MINOR (AIRS/AFS) SUPERFUND (Superfund database) STATE MASTER (Maryland Permits tracking) - NPDES NON-MAJOR, OIL CONTROL STATE MASTER (Maryland Air Emissions Database) - AIR MINOR COMPLIANCE ACTIVITY (Tracking inspections of insecticide, fungicide, and rodenticide, and toxic substances) CRITERIA AND HAZARDOUS AIR POLLUTANT INVENTORY (Inventory of air pollution sources) National Pollutant Discharge Elimination System NON-MAJOR (Tracking pollutant discharge elimination systems) - permit HAZARDOUS WASTE BIENNIAL REPORTER (Resource Conservation and Recovery Act (tracking hazardous waste)) Large Quantity Generators, more that 1000 kg of hazardous waste/month (Resource Conservation and Recovery Act (tracking hazardous waste)) Business SIC classification: NATIONAL SECURITY Organizations: USNAVAL SURFACE WARFARE CENTER CARDEROCK (CONTACT/OPERATOR)
, DEPARTMENT OF THE NAVY (CONTACT/OWNER)
, COMMANDANT NAVAL DISTRICT WASHINGTON (CONTACT/OWNER)
Alternative names: DAVID TAYLOR MODEL BASIN, DAVID TAYLOR NAVAL SHIP, DAVID TAYLOR RESEARCH CENTER, DAVID W TAYLOR NAVAL SHIP RPD CENTER, DEPARTMENT OF THE NAVY, NAVAL SHIP R&D CTR., NAVAL SURFACE WARFARE CNTR-BETHESDA, NAVAL SURFACE WARFARE CENTER - CARDEROCK, NAVAL SURFACE WARFARE CENTER-CARDEROCK D, NSWC CARDEROCK
OUR LADY OF THE WOODS ACADEMY (6801 GREENTREE ROAD in BETHESDA, MD)
AIR MINOR (AIRS/AFS) (Integrated Compliance Information System) - ICIS-03-1989-0735, FORMAL ENFORCEMENT ACTION (Integrated Compliance Information System) - ICIS-03-2003-0009, FORMAL ENFORCEMENT ACTION STATE MASTER (Maryland Air Emissions Database) - AIR MINOR COMPLIANCE ACTIVITY (Tracking inspections of insecticide, fungicide, and rodenticide, and toxic substances) Business SIC classification: ELEMENTARY AND SECONDARY SCHOOLS
LANDON SCHOOL (6101 WILSON LANE in BETHESDA, MD)
AIR MINOR (AIRS/AFS) STATE MASTER (Maryland Permits tracking) - National Pollutant Discharge Elimination System Permit STATE MASTER (Maryland Air Emissions Database) - AIR MINOR COMPLIANCE ACTIVITY (Tracking inspections of insecticide, fungicide, and rodenticide, and toxic substances) National Pollutant Discharge Elimination System NON-MAJOR (Tracking pollutant discharge elimination systems) - permit (Resource Conservation and Recovery Act (tracking hazardous waste)) Business SIC classification: ELEMENTARY AND SECONDARY SCHOOLS Organizations: JOE CHARVAT (CONTACT/OPERATOR)
, LANDON SCHOOL FOR BOYS (CONTACT/OWNER)
PYLE THOMAS W MIDDLE SCHOOL (6311 WILSON LANE in BETHESDA, MD)
AIR MINOR (AIRS/AFS) (Geographic Names Information System) STATE MASTER (Maryland Air Emissions Database) - AIR MINOR (National Center for Education Statistics) - STATE ID-150428 Conditionally Exempt Small Quantity Generators, less than 100 kg/month of hazardous waste (Resource Conservation and Recovery Act (tracking hazardous waste)) - notification Business SIC classification: ELEMENTARY AND SECONDARY SCHOOLS Organizations: MONTGOMERY COUNTY PUBLIC SCHOOLS (CONTACT/OWNER)
Alternative names: THOMAS W PYLE MIDDLE SCHOOL
BRADLEY MILLS ELEMENTARY SCHOOL (8701 HARTSDALE AVENUE in BETHESDA, MD)
AIR MINOR (AIRS/AFS) ENFORCEMENT/COMPLIANCE ACTIVITY (Integrated Compliance Information System) STATE MASTER (Maryland Air Emissions Database) - AIR MINOR (National Center for Education Statistics) - STATE ID-150410 Conditionally Exempt Small Quantity Generators, less than 100 kg/month of hazardous waste (Resource Conservation and Recovery Act (tracking hazardous waste)) - notification Business SIC classification: ELEMENTARY AND SECONDARY SCHOOLS Organizations: MONTGOMERY CO PUB SCHOOLS (CONTACT/OWNER)
, MONTGOMERY COUNTY PUBLIC SCHOOLS (SCHOOL DISTRICT)
Alternative names: BRADLEY ELEMENTARY SCHOOL, BRADLEY HILLS ELEM SCHOOL, BRADLEY HILLS ELEMENTARY SCHOOL
BANNOCKBURN ELEMENTARY SCHOOL (6520 DALROY LANE in BETHESDA, MD)
AIR MINOR (AIRS/AFS) STATE MASTER (Maryland Air Emissions Database) - AIR MINOR (National Center for Education Statistics) - STATE ID-150420 Conditionally Exempt Small Quantity Generators, less than 100 kg/month of hazardous waste (Resource Conservation and Recovery Act (tracking hazardous waste)) - notification Business SIC classification: ELEMENTARY AND SECONDARY SCHOOLS Organizations: MONTGOMERY CO PUB SCHOOLS (CONTACT/OWNER)
, MONTGOMERY COUNTY PUBLIC SCHOOLS (SCHOOL DISTRICT)
Alternative names: BANNACKBURN ELEM SCHOOL
BETHESDA COUNTRY CLUB (7601 BRADLEY BOULEVARD in BETHESDA, MD)
AIR MINOR (AIRS/AFS) STATE MASTER (Maryland Permits tracking) - National Pollutant Discharge Elimination System Permit STATE MASTER (Maryland Air Emissions Database) - AIR MINOR National Pollutant Discharge Elimination System NON-MAJOR (Tracking pollutant discharge elimination systems) - permit Business SIC classification: MEMBERSHIP SPORTS AND RECREATION CLUBS
BURNING TREE ELEMENTARY SCHOOL (7900 BEECH TREE ROAD in BETHESDA, MD)
AIR MINOR (AIRS/AFS) AIR MONITORING SITE (Airborne pollution emission tracking) STATE MASTER (Maryland Air Emissions Database) - AIR MINOR (National Center for Education Statistics) - STATE ID-150419 Business SIC classification: ELEMENTARY AND SECONDARY SCHOOLS Organizations: MONTGOMERY COUNTY PUBLIC SCHOOLS (SCHOOL DISTRICT)
BRADLEY HILLS PRESBYTERIAN CHURCH (6601 BRADLEY BOULEVARD in BETHESDA, MD)
AIR MINOR (AIRS/AFS) (Integrated Compliance Information System) - ICIS-03-1989-0604, FORMAL ENFORCEMENT ACTION STATE MASTER (Maryland Air Emissions Database) - AIR MINOR COMPLIANCE ACTIVITY (Tracking inspections of insecticide, fungicide, and rodenticide, and toxic substances) Business SIC classification: RELIGIOUS ORGANIZATIONS
ASHBURTON ELEMENTARY SCHOOL (6314 LONE OAK DRIVE in BETHESDA, MD)
AIR MINOR (AIRS/AFS) STATE MASTER (Maryland Air Emissions Database) - AIR MINOR (National Center for Education Statistics) - STATE ID-150425 Business SIC classification: ELEMENTARY AND SECONDARY SCHOOLS Organizations: MONTGOMERY COUNTY PUBLIC SCHOOLS (SCHOOL DISTRICT)
NORTH BETHESDA MIDDLE SCHOOL (8935 BRADMOOR DRIVE in BETHESDA, MD)
AIR MINOR (AIRS/AFS) STATE MASTER (Maryland Air Emissions Database) - AIR MINOR (National Center for Education Statistics) - STATE ID-150413 Business SIC classification: ELEMENTARY AND SECONDARY SCHOOLS Organizations: MONTGOMERY COUNTY PUBLIC SCHOOLS (SCHOOL DISTRICT)
CARDEROCK SPRINGS ELEMENTARY SCHOOL (7401 PERSIMMON TREE LANE in BETHESDA, MD)
AIR MINOR (AIRS/AFS) STATE MASTER (Maryland Air Emissions Database) - AIR MINOR (National Center for Education Statistics) - STATE ID-150604 Business SIC classification: ELEMENTARY AND SECONDARY SCHOOLS Organizations: MONTGOMERY COUNTY PUBLIC SCHOOLS (SCHOOL DISTRICT)
COLEMAN, JIM CADILLAC (10400 AUTO PARK AVENUE in BETHESDA, MD)
AIR MINOR (AIRS/AFS) STATE MASTER (Maryland Air Emissions Database) - AIR MINOR Large Quantity Generators, more that 1000 kg of hazardous waste/month (Resource Conservation and Recovery Act (tracking hazardous waste)) Business SIC classification: MOTOR VEHICLE DEALERS (NEW AND USED) Organizations: OPERNAME (CONTACT/OPERATOR)
Alternative names: COLEMAN CADILLAC, COLEMAN JIM TOYOTA
Housing units lacking complete plumbing facilities: 0.5% Housing units lacking complete kitchen facilities: 0.4%
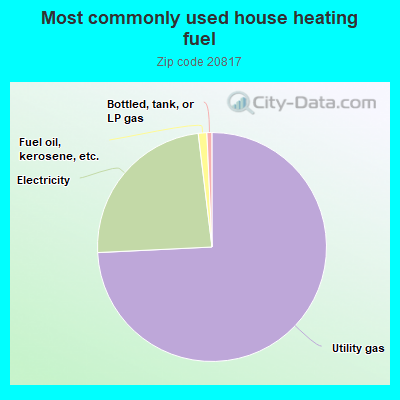
73.7%Utility gas
23.7%Electricity
1.2%Fuel oil, kerosene, etc.
0.7%Bottled, tank, or LP gas
Population in 1990: 33,484. Population change in the 1990s: +1,621 (+4.8%).
Place of birth for U.S.-born residents:
This state: 6,086
Northeast: 7,069
Midwest: 2,662
South: 8,490
West: 1,431
65% of the 20817 zip code residents lived in the same house 5 years ago. Out of people who lived in different houses, 55% lived in this county. Out of people who lived in different counties, 50% lived in Maryland.
89% of the 20817 zip code residents lived in the same house 1 year ago. Out of people who lived in different houses, 42% moved from this county. Out of people who lived in different houses, 6% moved from different county within same state. Out of people who lived in different houses, 32% moved from different state. Out of people who lived in different houses, 21% moved from abroad.
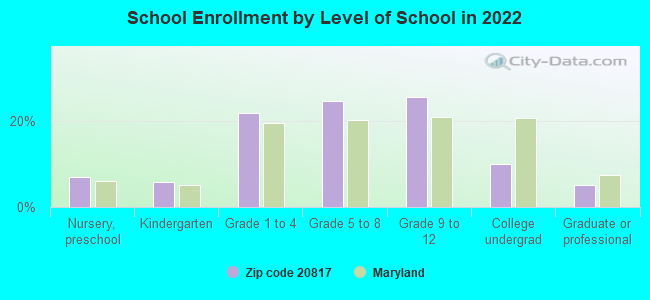
Private vs. public school enrollment:
Students in private schools in grades 1 to 8 (elementary and middle school): 1,137
Here:
24.2%
Maryland:
15.2%
Students in private schools in grades 9 to 12 (high school): 607
Here:
23.3%
Maryland:
14.4%
Students in private undergraduate colleges: 385
Here:
37.5%
Maryland:
20.2%
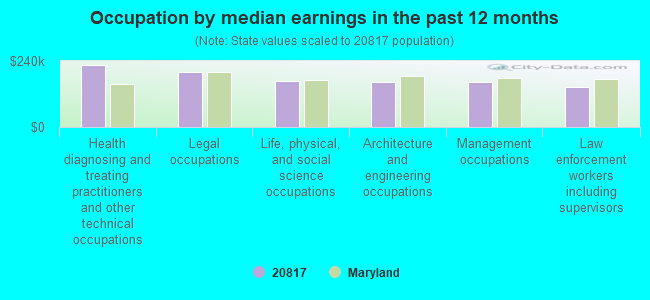
Occupation by median earnings in the past 12 months ($)
223,987Health diagnosing and treating practitioners and other technical occupations
200,792Legal occupations
168,255Life, physical, and social science occupations
163,152Architecture and engineering occupations
162,775Management occupations
146,366Law enforcement workers including supervisors
Companies with biggest federal contracts located in this zip code (BETHESDA, MD):
LOCKHEED MARTIN CORPORATION (6801 ROCKLEDGE DR) : $2,238,301,908 in 817 contractsfrom 1999 to 2006
Contracts for Space Vehicles, Invalid code: AC67, Engineering and Technical Services, Defense Aircraft -- Engineering Development (R&D), and moreby Navy, Air Force, Federal Bureau of Investigation, EPA, and others Signed by year:2000: $486,947,211; 2001: $234,141,037; 2002: $115,300,933; 2003: $26,929,908; 2004: $510,872,995; 2005: $181,059,860; 2006: $396,791,764.
Biggest contracts:
$306,000,000 with Navy for Space Vehicles. Taking place in CA. Signed on 2004-10-22. Completion date: 2011-02-28.
$255,712,230, same as above.Signed on 2006-01-30. Completion date: 2011-02-23.
$100,876,131 with Navy for Invalid code: AC67. Taking place in NJ. Signed on 2004-12-23. Completion date: 2007-09-30.
$100,000,000 with Navy for Space Vehicles. Taking place in CA. Signed on 2006-02-15. Completion date: 2011-02-23.
LOCKHEED MARTIN INTEGRATED SYS (6801 ROCKLEDGE DR) : $1,613,257,313 in 1180 contractsfrom 1999 to 2006
Contracts for Operation of Government-Owned Facilities -- Government-Owned Contractor-Operated (GOCO) R&D Facilities, Guns, through 30 mm, Miscellaneous Weapons, Aircraft Propellers and Components, and moreby ENERGY, Department of, Navy, Air Force, Defense Information Systems Agency, and others Signed by year:2000: -$51,755,846; 2001: $58,809,112; 2002: $196,914,294; 2003: $174,292,131; 2004: $394,995,012; 2005: $345,033,212; 2006: $191,587,254.
Biggest contracts:
$143,480,000 with ENERGY, Department of for Operation of Government-Owned Facilities -- Government-Owned Contractor-Operated (GOCO) R&D Facilities. Taking place in TN. Signed on 1999-12-15. Completion date: 2001-04-15.
$136,654,000, same as above.Signed on 2000-01-15. Completion date: 2001-04-15.
$74,930,000, same as above.Signed on 2000-03-15. Completion date: 2001-04-15.
$66,347,544 with Navy for Guns, through 30 mm. Signed on 2000-10-01. Completion date: 2000-11-30.
LOCKHEED MARTIN GLOBAL TELECOM (6550 ROCK SPRING DRIVE) : $133,468,408 in 65 contractsfrom 2001 to 2004
Contracts for Miscellaneous Communication Equipment by Department of Defense, Defense Information Systems Agency Signed by year:2000: $0; 2001: $33,121,321; 2002: $69,650,168; 2003: $16,652,980; 2004: $14,043,939; 2005: $0; 2006: $0.
Biggest contracts:
$12,646,906 with Department of Defense for Miscellaneous Communication Equipment. Signed on 2002-01-31. Completion date: 2003-07-31.
$9,736,107 with Defense Information Systems Agency for Miscellaneous Communication Equipment. Signed on 2004-09-30. Completion date: 2005-07-17.
$4,634,233 with Department of Defense for Miscellaneous Communication Equipment. Signed on 2001-10-05. Completion date: 2002-10-07.
$4,634,233, same as above.Signed on 2001-10-18. Completion date: 2002-12-30.
COMSAT GENERAL CORPORATION (ROCK SPRING ONE STE 450) : $91,713,624 in 235 contractsfrom 1999 to 2005
Contracts for Communications Services, Other ADP and Telecommunications Services (includes data storage on tapes, compact disks, etc.), Systems Engineering Services, Telephone and/or Communications Services (includes Telegraph, Telex, and Cablevision Services), and moreby Army, Department of Defense, Air Force, Navy, and others Signed by year:2000: $6,946,687; 2001: $12,935,268; 2002: $14,696,685; 2003: $20,215,331; 2004: $34,953,353; 2005: $252,300; 2006: $0.
Biggest contracts:
$3,907,000 with Army for Communications Services. Signed on 2003-08-29. Completion date: 2004-08-28.
$3,300,000, same as above.Signed on 2004-09-16. Completion date: 2005-09-30.
$3,160,991, same as above.Signed on 2004-04-02. Completion date: 2005-03-31.
$3,000,000, same as above.Signed on 2004-06-04. Completion date: 2005-09-30.
1425 NEW YORK AVE ASSOCIATES (1 DEMOCRACY PLZ) : $57,501,092 in 246 contractsfrom 1999 to 2005
Contracts for Lease or Rental of Facilities -- Office Buildings, Maintenance, Repair or Alteration of Real Property -- Office Buildings by Public Buildings Service Signed by year:2000: $8,528,000; 2001: $8,654,000; 2002: $10,995,844; 2003: $19,190,244; 2004: $2,696,788; 2005: $5,304,216; 2006: $0.
Biggest contracts:
$372,274 with Public Buildings Service for Lease or Rental of Facilities -- Office Buildings. Taking place in DC. Signed on 2003-09-15. Completion date: 2003-09-15.
$372,274, same as above.Signed on 2003-06-15. Completion date: 2003-06-15.
$371,523, same as above.Signed on 2003-06-15. Completion date: 2003-06-15.
$371,523, same as above.Signed on 2003-09-15. Completion date: 2003-09-15.
INTERNATIONAL BUSINESS MACHINE (6710 ROCKLEDGE DR) : $52,541,547 in 27 contractsfrom 1999 to 2006
Contracts for ADP Input/Output and Storage Devices, Other ADP and Telecommunications Services (includes data storage on tapes, compact disks, etc.), ADP Components, ADPE System Configuration, and moreby Tennessee Valley Authority, Bureau of the Census, Geological Survey, Navy, and others Signed by year:2000: $36,692,726; 2001: $678,079; 2002: $0; 2003: $0; 2004: $79,600; 2005: $2,764,948; 2006: $10,635,194.
Biggest contracts:
$35,750,000 with Tennessee Valley Authority for ADP Input/Output and Storage Devices. Taking place in TN. Signed on 2000-03-15. Completion date: 2005-09-15.
$7,610,451 with Bureau of the Census for Other ADP and Telecommunications Services (includes data storage on tapes, compact disks, etc.). Signed on 2006-02-13. Completion date: 2006-09-30.
$3,489,549, same as above.Signed on 2006-08-15. Completion date: 2005-08-31.
$2,750,000, same as above.Signed on 2005-09-16. Completion date: 2006-09-30.
GIBSON SHIPHOLDING CORPORATION (6550 ROCK SPRING DRIVE) : $41,121,201 in 17 contractsfrom 2000 to 2003
Contracts for Marine Charter for Things, Motor Pool Operations by Navy Signed by year:2000: $33,734,138; 2001: $1,623,882; 2002: $1,119,181; 2003: $4,644,000; 2004: $0; 2005: $0; 2006: $0.
Biggest contracts:
$31,258,977 with Navy for Marine Charter for Things. Taking place in FL. Signed on 2000-09-06. Completion date: 2004-06-08.
$3,000,000 with Navy for Marine Charter for Things. Signed on 2003-07-09. Completion date: 2004-09-30.
$1,644,000 with Navy for Motor Pool Operations. Taking place in CA. Signed on 2003-06-19. Completion date: 2003-07-03.
$1,286,942 with Navy for Marine Charter for Things. Taking place in FL. Signed on 2000-06-23. Completion date: 2004-06-08.
TARAGO SHIPHOLDING CORP (6550 ROCK SPRING DR) : $39,831,006 in 39 contractsfrom 1999 to 2005
Contracts for Marine Charter for Things, Maintenance, Repair and Rebuilding of Equipment -- Ship and Marine Equipment by Navy Signed by year:2000: $614,078; 2001: $17,536,873; 2002: $3,878,785; 2003: $11,594,065; 2004: $1,149,815; 2005: $2,054,094; 2006: $0.
Biggest contracts:
$11,256,745 with Navy for Marine Charter for Things. Taking place in FL. Signed on 2003-10-28. Completion date: 2005-07-19.
$9,500,000 with Navy for Maintenance, Repair and Rebuilding of Equipment -- Ship and Marine Equipment. Signed on 2001-10-15. Completion date: 1999-10-21.
$3,000,000 with Navy for Maintenance, Repair and Rebuilding of Equipment -- Ship and Marine Equipment. Taking place in FL. Signed on 2001-02-22. Completion date: 2002-02-21.
$2,621,918 with Navy for Maintenance, Repair and Rebuilding of Equipment -- Ship and Marine Equipment. Signed on 1999-10-21. Completion date: 1999-04-21.
CORMORANT SHIPHOLDING CORPORAT (6550 ROCK SPRING DR # 300; small business) : $32,328,907 in 14 contractsfrom 2000 to 2002
Contracts for Marine Charter for Things by Navy Signed by year:2000: $29,896,611; 2001: $2,253,621; 2002: $178,675; 2003: $0; 2004: $0; 2005: $0; 2006: $0.
Biggest contracts:
$28,986,014 with Navy for Marine Charter for Things. Signed on 2000-09-05. Completion date: 2002-09-20.
$952,381, same as above.Signed on 2001-09-17. Completion date: 2006-09-17.
$631,372, same as above.Signed on 2000-06-23. Completion date: 2002-09-20.
$416,311, same as above.Signed on 2001-10-17. Completion date: 2002-09-30.
OMNITEC SOLUTIONS, INC (6905 ROCKLEDGE DRIVE SUITE; small business) : $27,134,694 in 121 contractsfrom 2001 to 2006
Contracts for ADP Systems Analysis Services, Other Professional Services, ADP Telecommunications and Transmission Services, Miscellaneous Items, and moreby Federal Technology Service, Navy, American Forces Information Service, Air Force, and others Signed by year:2000: $0; 2001: $173,410; 2002: $1,988,260; 2003: $5,485,795; 2004: $6,472,205; 2005: $11,165,976; 2006: $1,849,048.
Biggest contracts:
$1,328,414 with Federal Technology Service for ADP Systems Analysis Services. Taking place in TX. Signed on 2005-09-29. Effective on 2005-09-30. Completion date: 2006-09-29.
$1,258,924 with Navy for Other Professional Services. Taking place in DC. Signed on 2003-11-17. Completion date: 2005-01-21.
$1,187,993 with Navy for ADP Telecommunications and Transmission Services. Taking place in DC. Signed on 2005-03-02. Completion date: 2006-04-06.
$1,150,906 with Navy for Other Professional Services. Taking place in DC. Signed on 2003-03-04. Completion date: 2003-09-30.
Top industries in this zip code by the number of employees in 2005:
2004 - 2018 National Fire Incident Reporting System (NFIRS) incidents
According to the data from the years 2004 - 2018 the average number of fire incidents per year is 48. The highest number of fire incidents - 82 took place in 2006, and the least - 19 in 2004. The data has an increasing trend.
When looking into fire subcategories, the most incidents belonged to: Structure Fires (35.0%), and Outside Fires (31.7%).
Fire incident types reported to NFIRS in Zip Code 20817


 Nearest zip codes: 20818, 20812, 20814, 20816, 22101, 20852.


 . Federal Facility. U.S. NAVY
 According to the data from the years 2004 - 2018 the average number of fire incidents per year is 48. The highest number of fire incidents - 82 took place in 2006, and the least - 19 in 2004. The data has an increasing trend.
 When looking into fire subcategories, the most incidents belonged to: Structure Fires (35.0%), and Outside Fires (31.7%).