Estimated zip code population in 2022: 25,835 Zip code population in 2010: 24,807 Zip code population in 2000: 24,498
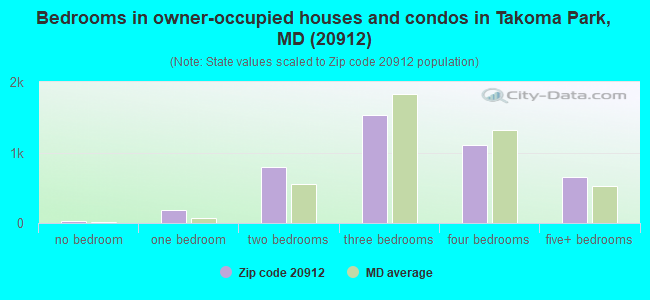
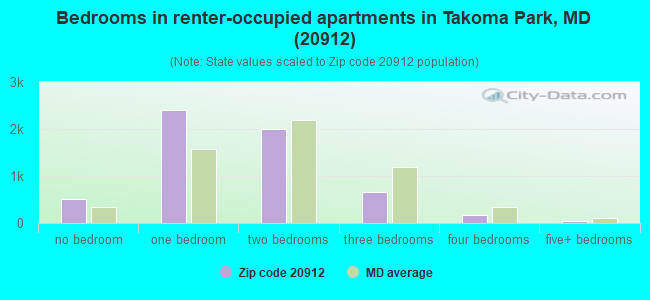
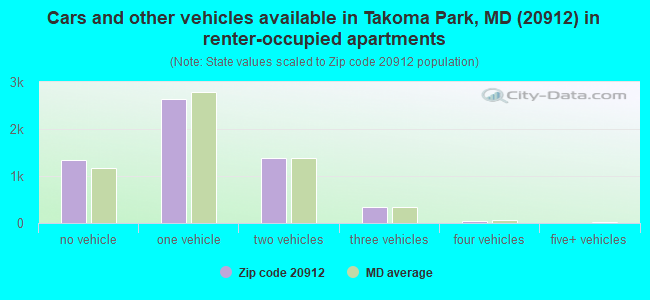
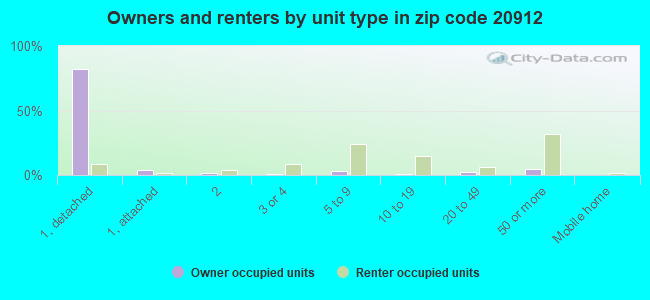
Houses and condos: 10,288 Renter-occupied apartments: 5,734
% of renters here:
57%
State:
32%
March 2022 cost of living index in zip code 20912: 187.6 (very high, U.S. average is 100)
Land area: 2.7 sq. mi. Water area: 0.0 sq. mi.
Population density: 9,684 people per square mile
(high).
OSM Map
General Map
Google Map
MSN Map
OSM Map
General Map
Google Map
MSN Map
OSM Map
General Map
Google Map
MSN Map
OSM Map
General Map
Google Map
MSN Map
Please wait while loading the map...
Real estate property taxes paid for housing units in 2022:
This zip code:
1.1% ($7,424)
Maryland:
0.9% ($3,777)
Median real estate property taxes paid for housing units with mortgages in 2022: $7,463 (1.0%) Median real estate property taxes paid for housing units with no mortgage in 2022: $7,280 (1.3%)
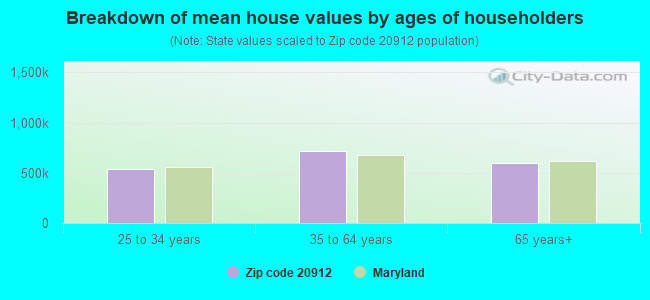
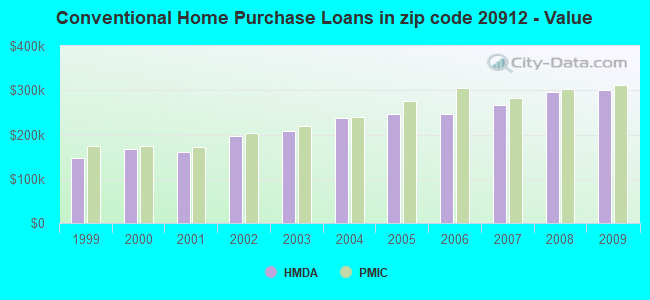
Estimated median house/condo value in 2022: $675,985
20912:
$675,985
Maryland:
$398,100
According to our research of Maryland and other state lists, there were 16 registered sex offenders living in 20912 zip code as of April 27, 2024. The ratio of all residents to sex offenders in zip code 20912 is 1,662 to 1. The ratio of registered sex offenders to all residents in this zip code is lower than the state average.
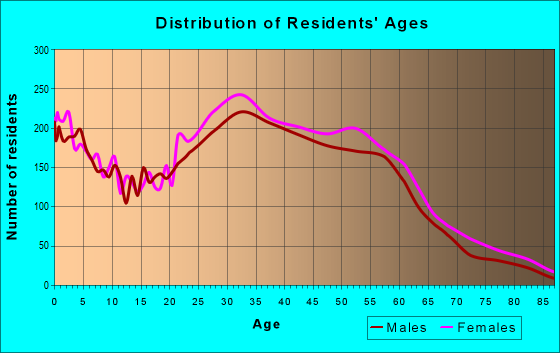
Median resident age:
This zip code:
37.9 years
Maryland median age:
39.7 years
Average household size:
This zip code:
2.5 people
Maryland:
2.5 people
Averages for the 2020 tax year for zip code 20912, filed in 2021:
Average Adjusted Gross Income (AGI) in 2020: $79,484 (Individual Income Tax Returns)
Here:
$79,484
State:
$86,905
Salary/wage: $74,303 (reported on 79.1% of returns)
Here:
$74,303
State:
$73,953
(% of AGI for various income ranges: 1152.3% for AGIs below $25k, 3843.4% for AGIs $25k-50k, 7179.3% for AGIs $50k-75k, 10769.6% for AGIs $75k-100k, 19791.6% for AGIs $100k-200k, 71151.7% for AGIs over 200k)
Taxable interest for individuals: $912 (reported on 32.2% of returns)
This zip code:
$912
Maryland:
$1,528
(% of AGI for various income ranges: 6.8% for AGIs below $25k, 13.4% for AGIs $25k-50k, 27.6% for AGIs $50k-75k, 72.6% for AGIs $75k-100k, 102.7% for AGIs $100k-200k, 368.8% for AGIs over 200k)
Ordinary dividends: $7,107 (reported on 19.9% of returns)
Here:
$7,107
State:
$8,028
(% of AGI for various income ranges: 16.2% for AGIs below $25k, 34.1% for AGIs $25k-50k, 63.8% for AGIs $50k-75k, 244.8% for AGIs $75k-100k, 480.9% for AGIs $100k-200k, 2380.2% for AGIs over 200k)
Net capital gain/loss in AGI: +$16,924 (reported on 18.8% of returns)
Here:
+$16,924
State:
+$25,238
(% of AGI for various income ranges: 17.8% for AGIs below $25k, 26.8% for AGIs $25k-50k, 77.2% for AGIs $50k-75k, 196.1% for AGIs $75k-100k, 639.6% for AGIs $100k-200k, 7339.0% for AGIs over 200k)
Profit/loss from business: +$12,952 (reported on 31.7% of returns)
Here:
+$12,952
State:
+$11,398
(% of AGI for various income ranges: 369.1% for AGIs below $25k, 189.8% for AGIs $25k-50k, 242.0% for AGIs $50k-75k, 360.9% for AGIs $75k-100k, 915.4% for AGIs $100k-200k, 5980.0% for AGIs over 200k)
Taxable individual retirement arrangement distribution: $20,256 (reported on 5.3% of returns)
20912:
$20,256
Maryland:
$20,944
(% of AGI for various income ranges: 20.7% for AGIs below $25k, 29.2% for AGIs $25k-50k, 95.9% for AGIs $50k-75k, 325.0% for AGIs $75k-100k, 529.0% for AGIs $100k-200k, 1056.9% for AGIs over 200k)
Self-employed (Keogh) retirement plans: $27,391 (reported on 1.8% of returns)
20912:
$27,391
Maryland:
$29,558
(% of AGI for various income ranges: 11.8% for AGIs $25k-50k, 85.6% for AGIs $100k-200k, 1244.5% for AGIs over 200k)
Total itemized deductions: $29,745 (reported on 20.2% of returns)
Here:
$29,745
State:
$30,672
(% of AGI for various income ranges: 115.9% for AGIs below $25k, 324.8% for AGIs $25k-50k, 725.5% for AGIs $50k-75k, 1320.4% for AGIs $75k-100k, 2239.4% for AGIs $100k-200k, 6905.2% for AGIs over 200k)
Charity contributions: $8,588 (reported on 17.2% of returns)
Here:
$8,588
State:
$9,065
(% of AGI for various income ranges: 18.2% for AGIs below $25k, 103.8% for AGIs $25k-50k, 187.6% for AGIs $50k-75k, 298.3% for AGIs $75k-100k, 436.2% for AGIs $100k-200k, 1903.1% for AGIs over 200k)
Taxes paid: $8,406 (reported on 20.2% of returns)
20912:
$8,406
State:
$8,475
(% of AGI for various income ranges: 28.1% for AGIs below $25k, 69.8% for AGIs $25k-50k, 194.6% for AGIs $50k-75k, 434.6% for AGIs $75k-100k, 754.1% for AGIs $100k-200k, 1774.0% for AGIs over 200k)
Earned income credit: $2,028 (reported on 15.7% of returns)
Here:
$2,028
State:
$2,151
(% of AGI for various income ranges: 101.6% for AGIs below $25k, 69.3% for AGIs $25k-50k)
Percentage of individuals using paid preparers for their 2020 taxes: 87.5%
Here:
88%
State:
90%
(% for various income ranges: 82.4% for AGIs below $25k, 89.0% for AGIs $25k-50k, 89.7% for AGIs $50k-75k, 88.8% for AGIs $75k-100k, 90.5% for AGIs $100k-200k, 93.5% for AGIs over 200k)
Averages for the 2012 tax year for zip code 20912, filed in 2013:
Average Adjusted Gross Income (AGI) in 2012: $58,426 (Individual Income Tax Returns)
Here:
$58,426
State:
$72,703
Salary/wage: $55,506 (reported on 84.2% of returns)
Here:
$55,506
State:
$62,228
(% of AGI for various income ranges: 75.7% for AGIs below $25k, 89.2% for AGIs $25k-50k, 85.6% for AGIs $50k-75k, 82.8% for AGIs $75k-100k, 83.8% for AGIs $100k-200k, 66.7% for AGIs over 200k)
Taxable interest for individuals: $851 (reported on 31.8% of returns)
This zip code:
$851
Maryland:
$1,413
(% of AGI for various income ranges: 0.5% for AGIs below $25k, 0.3% for AGIs $25k-50k, 0.4% for AGIs $50k-75k, 0.5% for AGIs $75k-100k, 0.4% for AGIs $100k-200k, 0.7% for AGIs over 200k)
Ordinary dividends: $5,013 (reported on 18.0% of returns)
Here:
$5,013
State:
$6,933
(% of AGI for various income ranges: 0.8% for AGIs below $25k, 0.5% for AGIs $25k-50k, 0.8% for AGIs $50k-75k, 1.3% for AGIs $75k-100k, 1.5% for AGIs $100k-200k, 3.0% for AGIs over 200k)
Net capital gain/loss in AGI: +$10,698 (reported on 13.8% of returns)
Here:
+$10,698
State:
+$14,830
(% of AGI for various income ranges: 0.1% for AGIs below $25k, 0.2% for AGIs $25k-50k, 0.5% for AGIs $50k-75k, 0.3% for AGIs $75k-100k, 0.9% for AGIs $100k-200k, 8.9% for AGIs over 200k)
Profit/loss from business: +$13,068 (reported on 24.9% of returns)
Here:
+$13,068
State:
+$12,606
(% of AGI for various income ranges: 17.4% for AGIs below $25k, 3.1% for AGIs $25k-50k, 3.3% for AGIs $50k-75k, 3.2% for AGIs $75k-100k, 4.8% for AGIs $100k-200k, 6.2% for AGIs over 200k)
Taxable individual retirement arrangement distribution: $14,335 (reported on 4.9% of returns)
20912:
$14,335
Maryland:
$17,065
(% of AGI for various income ranges: 0.9% for AGIs below $25k, 0.7% for AGIs $25k-50k, 1.0% for AGIs $50k-75k, 1.8% for AGIs $75k-100k, 1.2% for AGIs $100k-200k, 1.5% for AGIs over 200k)
Self-employment retirement plans: $17,735 (reported on 1.7% of returns)
20912:
$17,735
Maryland:
$24,439
(% of AGI for various income ranges: 0.2% for AGIs below $25k, 0.3% for AGIs $50k-75k, 0.5% for AGIs $100k-200k, 1.3% for AGIs over 200k)
Total itemized deductions: $24,242 (24% of AGI, reported on 42.8% of returns)
Here:
$24,242
State:
$27,886
Here:
23.9% of AGI
State:
22.8% of AGI
(% of AGI for various income ranges: 12.3% for AGIs below $25k, 17.1% for AGIs $25k-50k, 17.5% for AGIs $50k-75k, 20.3% for AGIs $75k-100k, 20.0% for AGIs $100k-200k, 16.5% for AGIs over 200k)
Charity contributions: $3,457 (reported on 35.0% of returns)
Here:
$3,457
State:
$4,452
(% of AGI for various income ranges: 1.2% for AGIs below $25k, 2.5% for AGIs $25k-50k, 2.4% for AGIs $50k-75k, 2.4% for AGIs $75k-100k, 1.9% for AGIs $100k-200k, 1.9% for AGIs over 200k)
Taxes paid: $10,556 (reported on 42.6% of returns)
20912:
$10,556
State:
$11,690
(% of AGI for various income ranges: 2.3% for AGIs below $25k, 3.8% for AGIs $25k-50k, 6.0% for AGIs $50k-75k, 8.9% for AGIs $75k-100k, 10.1% for AGIs $100k-200k, 9.6% for AGIs over 200k)
Earned income credit: $2,088 (reported on 18.3% of returns)
Here:
$2,088
State:
$2,199
(% of AGI for various income ranges: 6.1% for AGIs below $25k, 1.0% for AGIs $25k-50k)
Percentage of individuals using paid preparers for their 2012 taxes: 56.6%
Here:
57%
State:
52%
(% for various income ranges: 60.7% for AGIs below $25k, 58.6% for AGIs $25k-50k, 50.3% for AGIs $50k-75k, 52.3% for AGIs $75k-100k, 46.6% for AGIs $100k-200k, 59.6% for AGIs over 200k)
Averages for the 2004 tax year for zip code 20912, filed in 2005:
Average Adjusted Gross Income (AGI) in 2004: $45,672 (Individual Income Tax Returns)
Here:
$45,672
State:
$60,339
Salary/wage: $42,951 (reported on 87.3% of returns)
Here:
$42,951
State:
$52,211
(% of AGI for various income ranges: 96.8% for AGIs below $10k, 85.4% for AGIs $10k-25k, 89.8% for AGIs $25k-50k, 86.3% for AGIs $50k-75k, 84.6% for AGIs $75k-100k, 74.4% for AGIs over 100k)
Taxable interest for individuals: $934 (reported on 38.0% of returns)
This zip code:
$934
Maryland:
$1,701
(% of AGI for various income ranges: 2.5% for AGIs below $10k, 0.7% for AGIs $10k-25k, 0.6% for AGIs $25k-50k, 1.0% for AGIs $50k-75k, 0.8% for AGIs $75k-100k, 0.7% for AGIs over 100k)
Taxable dividends: $3,001 (reported on 20.3% of returns)
Here:
$3,001
State:
$4,235
(% of AGI for various income ranges: 3.5% for AGIs below $10k, 0.6% for AGIs $10k-25k, 0.6% for AGIs $25k-50k, 0.8% for AGIs $50k-75k, 1.0% for AGIs $75k-100k, 2.1% for AGIs over 100k)
Net capital gain/loss: +$8,907 (reported on 15.9% of returns)
Here:
+$8,907
State:
+$15,888
(% of AGI for various income ranges: -1.0% for AGIs below $10k, 0.2% for AGIs $10k-25k, 0.3% for AGIs $25k-50k, 0.6% for AGIs $50k-75k, 0.9% for AGIs $75k-100k, 7.1% for AGIs over 100k)
Profit/loss from business: +$11,751 (reported on 20.4% of returns)
Here:
+$11,751
State:
+$12,221
(% of AGI for various income ranges: 25.5% for AGIs below $10k, 8.0% for AGIs $10k-25k, 3.1% for AGIs $25k-50k, 2.8% for AGIs $50k-75k, 5.0% for AGIs $75k-100k, 6.0% for AGIs over 100k)
IRA payment deduction: $2,754 (reported on 2.3% of returns)
20912:
$2,754
Maryland:
$2,968
(% of AGI for various income ranges: 0.2% for AGIs below $10k, 0.2% for AGIs $10k-25k, 0.2% for AGIs $25k-50k, 0.2% for AGIs $50k-75k, 0.1% for AGIs $75k-100k, 0.1% for AGIs over 100k)
Self-employed pension: $14,451 (reported on 1.9% of returns)
Here:
$14,451
Maryland:
$17,155
(% of AGI for various income ranges: 0.1% for AGIs $10k-25k, 0.1% for AGIs $25k-50k, 0.3% for AGIs $50k-75k, 0.5% for AGIs $75k-100k, 1.1% for AGIs over 100k)
Total itemized deductions: $19,643 (26% of AGI, reported on 45.7% of returns)
Here:
$19,643
State:
$22,960
Here:
26.5% of AGI
State:
23.3% of AGI
(% of AGI for various income ranges: 11.4% for AGIs below $10k, 17.2% for AGIs $10k-25k, 21.2% for AGIs $25k-50k, 21.6% for AGIs $50k-75k, 22.5% for AGIs $75k-100k, 18.2% for AGIs over 100k)
Charity contributions deductions: $3,408 (4% of AGI, reported on 39.9% of returns)
Here:
$3,408
State:
$4,031
Here:
4.4% of AGI
State:
3.9% of AGI
(% of AGI for various income ranges: 1.0% for AGIs below $10k, 2.6% for AGIs $10k-25k, 3.8% for AGIs $25k-50k, 3.2% for AGIs $50k-75k, 3.0% for AGIs $75k-100k, 2.6% for AGIs over 100k)
Total tax: $7,080 (reported on 75.2% of returns)
20912:
$7,080
State:
$10,167
(% of AGI for various income ranges: 5.4% for AGIs below $10k, 4.0% for AGIs $10k-25k, 6.5% for AGIs $25k-50k, 10.0% for AGIs $50k-75k, 11.8% for AGIs $75k-100k, 17.2% for AGIs over 100k)
Earned income credit: $1,575 (reported on 18.2% of returns)
Here:
$1,575
State:
$1,700
Percentage of individuals using paid preparers for their 2004 taxes: 56.6%
Here:
57%
State:
55%
(% for various income ranges: 57.8% for AGIs below $10k, 65.0% for AGIs $10k-25k, 55.5% for AGIs $25k-50k, 47.7% for AGIs $50k-75k, 46.7% for AGIs $75k-100k, 51.7% for AGIs over 100k)
Likely homosexual households (counted as self-reported same-sex unmarried-partner households)
Lesbian couples: 0.1% of all households
Gay men: 0.3% of all households
Household received Food Stamps/SNAP in the past 12 months: 1,086 Household did not receive Food Stamps/SNAP in the past 12 months: 8,922
Women who had a birth in the past 12 months: 547 (416 now married, 132 unmarried) Women who did not have a birth in the past 12 months: 5,785 (2,652 now married, 3,133 unmarried)
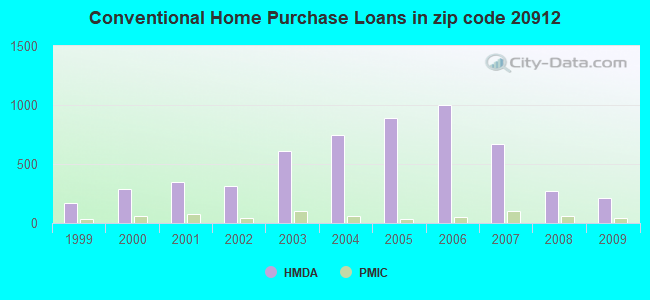
Housing units in zip code 20912 with a mortgage: 3,262 (372 second mortgage, 27 home equity loan, 294 both second mortgage and home equity loan) Houses without a mortgage: 88
Median monthly owner costs for units with a mortgage: $2,716 Median monthly owner costs for units without a mortgage: $961
Residents with income below the poverty level in 2022:
This zip code:
13.7%
Whole state:
9.6%
Residents with income below 50% of the poverty level in 2022:
This zip code:
7.8%
Whole state:
4.7%
Median number of rooms in houses and condos:
Here:
7.5
State:
7.3
Median number of rooms in apartments:
Here:
3.6
State:
4.2
Notable locations in this zip code not listed on our city pages
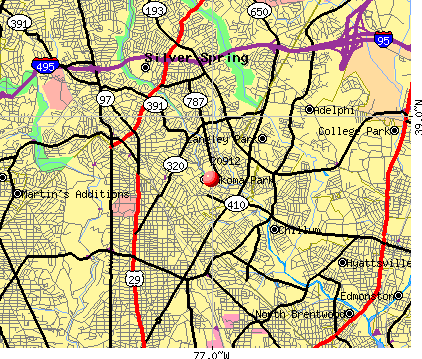
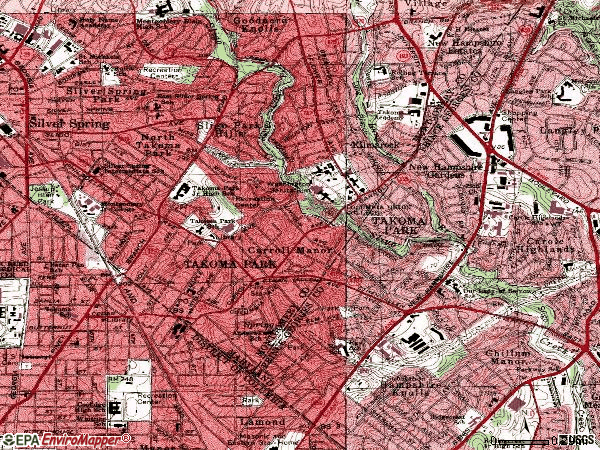
Notable locations in zip code 20912: Takoma Park City Hall (A), Takoma Park Volunteer Fire Department Station 2 (B), Takoma Park Library (C). Display/hide their locations on the map
Churches in zip code 20912 include: Grace United Methodist Church (A), Our Lady of Sorrows Catholic Church (B), Sligo Church (C), Marthoma Church of Greater Washington (D), Bright Light Baptist Church (E), Chinese Christian Church of Greater Washington District of Columbia (F), Church Universal and Triumphant (G), Takoma Park Presbyterian Church (H), New Creation Gospel Center (I). Display/hide their locations on the map
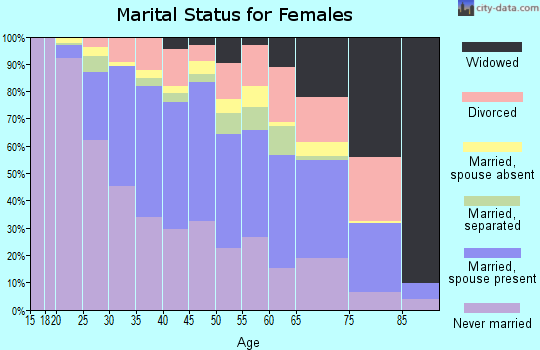
4,590 married couples with children.
2,077 single-parent households (739 men, 1,338 women).
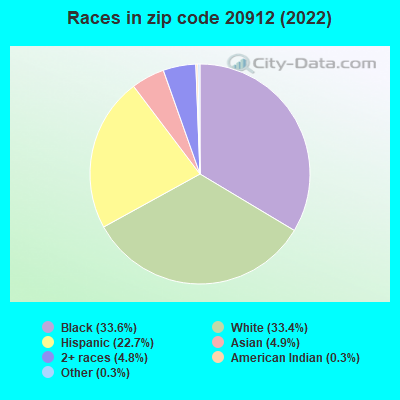
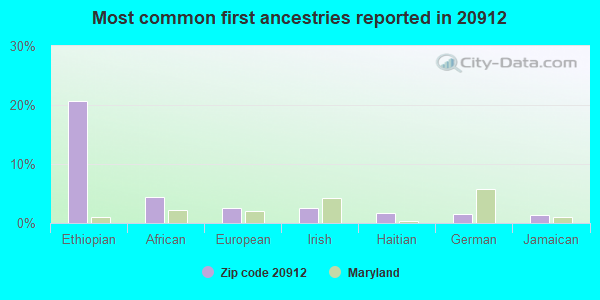
54.9% of residents of 20912 zip code speak English at home.
21.8% of residents speak Spanish at home (39% very well, 20% well, 26% not well, 15% not at all).
8.5% of residents speak other Indo-European language at home (56% very well, 37% well, 7% not well).
2.5% of residents speak Asian or Pacific Island language at home (56% very well, 19% well, 23% not well, 3% not at all).
14.7% of residents speak other language at home (58% very well, 32% well, 5% not well, 6% not at all).
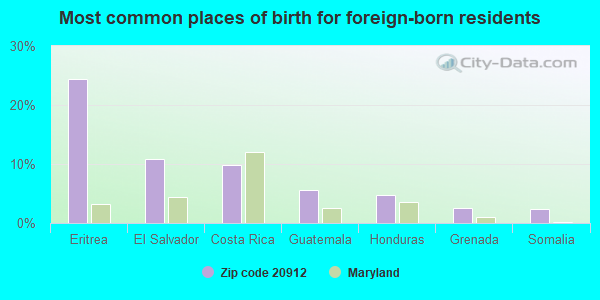
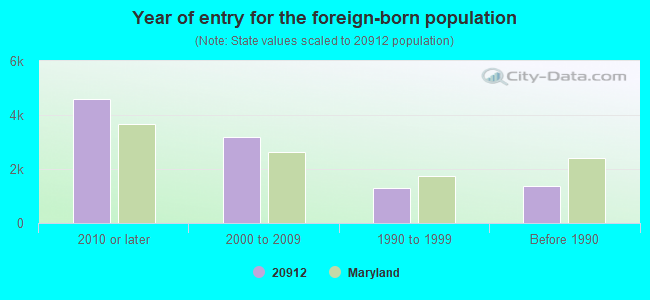
Foreign born population: 9,808 (38.0%) (42.5% of them are naturalized citizens)
Major facilities with environmental interests located in this zip code:
MONTGOMERY COLLEGE TAKOMA PARK (7600 TAKOMA AVENUE in TAKOMA PARK, MD)
AIR MINOR (AIRS/AFS) STATE MASTER (Maryland Permits tracking) - National Pollutant Discharge Elimination System Permit, NPDES STORMWATER PERMIT STATE MASTER (Maryland Air Emissions Database) - AIR MINOR Conditionally Exempt Small Quantity Generators, less than 100 kg/month of hazardous waste (Resource Conservation and Recovery Act (tracking hazardous waste)) - notification Business SIC classification: COLLEGES, UNIVERSITIES, AND PROFESSIONAL SCHOOLS; JUNIOR COLLEGES AND TECHNICAL INSTITUTES Organizations: OPERNAME (CONTACT/OPERATOR)
, BOARD OF TRUSTEES, MONTGOMERY COLLEGE (CONTACT/OWNER)
Alternative names: MONTGOMERY COM COLL
AMOCO #84666-TANKS (920 EAST WEST HWY in TAKOMA PARK, MD)
AIR MINOR (AIRS/AFS) STATE MASTER (Maryland Air Emissions Database) - AIR MINOR Small Quantity Generators, between 100 kg and 1000 kg of hazardous waste/month (Resource Conservation and Recovery Act (tracking hazardous waste)) - notification Business SIC classification: GASOLINE SERVICE STATIONS Organizations: OPERNAME (CONTACT/OPERATOR)
, AMOCO OIL COMPANY (CONTACT/OWNER)
Alternative names: AMOCO - 920 EAST-WEST HIGHWAY, AMOCO - 920 EW HGHWY (SEE 16-1427), BP - 920 EAST WEST HIGHWAY
BARRON STREET 8306 08 (8306-08 BARRON STREET in TAKOMA PARK, MD)
AIR MINOR (AIRS/AFS) STATE MASTER (Maryland Air Emissions Database) - AIR MINOR Business SIC classification: OPERATORS OF APARTMENT BUILDINGS Alternative names: WASH. ADVENTIST HOSP
BLAIR ROAD 7702 (7702 BLAIR ROAD in TAKOMA PARK, MD)
AIR MINOR (AIRS/AFS) STATE MASTER (Maryland Air Emissions Database) - AIR MINOR Business SIC classification: OPERATORS OF APARTMENT BUILDINGS
LEE AVENUE 116 (116 LEE AVENUE in TAKOMA PARK, MD)
AIR MINOR (AIRS/AFS) STATE MASTER (Maryland Air Emissions Database) - AIR MINOR Business SIC classification: OPERATORS OF APARTMENT BUILDINGS
LEE AVENUE 115 (115 LEE AVENUE in TAKOMA PARK, MD)
AIR MINOR (AIRS/AFS) STATE MASTER (Maryland Air Emissions Database) - AIR MINOR Business SIC classification: OPERATORS OF APARTMENT BUILDINGS
PINEY BRANCH SERVICE CENTER (8875 PINEY BRANCH RD. in SILVER SPRING, MD)
AIR MINOR (AIRS/AFS) STATE MASTER (Maryland Air Emissions Database) - AIR MINOR Business SIC classification: GASOLINE SERVICE STATIONS
CARROLL AVENUE 7051 (7051 CARROLL AVENUE in TAKOMA PARK, MD)
AIR MINOR (AIRS/AFS) STATE MASTER (Maryland Air Emissions Database) - AIR MINOR Business SIC classification: OPERATORS OF APARTMENT BUILDINGS
LEE AVENUE 111 (111 LEE AVENUE in TAKOMA PARK, MD)
AIR MINOR (AIRS/AFS) STATE MASTER (Maryland Air Emissions Database) - AIR MINOR Business SIC classification: OPERATORS OF APARTMENT BUILDINGS
PINEY BRANCH MIDDLE SCHOOL (7510 MAPLE AVENUE in TAKOMA PARK, MD)
AIR MINOR (AIRS/AFS) STATE MASTER (Maryland Air Emissions Database) - AIR MINOR Business SIC classification: ELEMENTARY AND SECONDARY SCHOOLS
LEE AVENUE, 28 (28 LEE AVENUE in TAKOMA PARK, MD)
AIR MINOR (AIRS/AFS) STATE MASTER (Maryland Air Emissions Database) - AIR MINOR Business SIC classification: OPERATORS OF APARTMENT BUILDINGS
MAPLE AVENUE 7520 (7520 MAPLE AVENUE in TAKOMA PARK, MD)
AIR MINOR (AIRS/AFS) STATE MASTER (Maryland Air Emissions Database) - AIR MINOR Business SIC classification: OPERATORS OF APARTMENT BUILDINGS
MAPLE AVENUE 7610 (7610 MAPLE AVENUE in TAKOMA PARK, MD)
AIR MINOR (AIRS/AFS) STATE MASTER (Maryland Air Emissions Database) - AIR MINOR Business SIC classification: OPERATORS OF APARTMENT BUILDINGS
Housing units lacking complete plumbing facilities: 0.3% Housing units lacking complete kitchen facilities: 0.6%
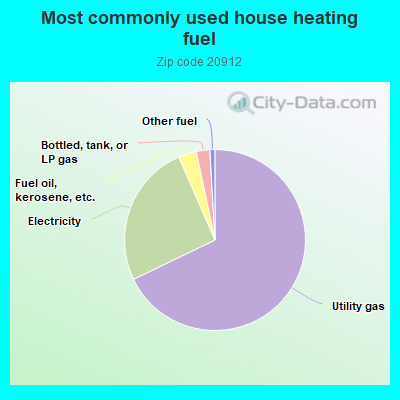
67.5%Utility gas
25.5%Electricity
3.2%Fuel oil, kerosene, etc.
2.4%Bottled, tank, or LP gas
0.9%Other fuel
Population in 1990: 24,356. Population change in the 1990s: +142 (+0.6%).
Place of birth for U.S.-born residents:
This state: 5,979
Northeast: 2,883
Midwest: 1,727
South: 4,561
West: 756
54% of the 20912 zip code residents lived in the same house 5 years ago. Out of people who lived in different houses, 46% lived in this county. Out of people who lived in different counties, 50% lived in Maryland.
89% of the 20912 zip code residents lived in the same house 1 year ago. Out of people who lived in different houses, 37% moved from this county. Out of people who lived in different houses, 25% moved from different county within same state. Out of people who lived in different houses, 26% moved from different state. Out of people who lived in different houses, 12% moved from abroad.
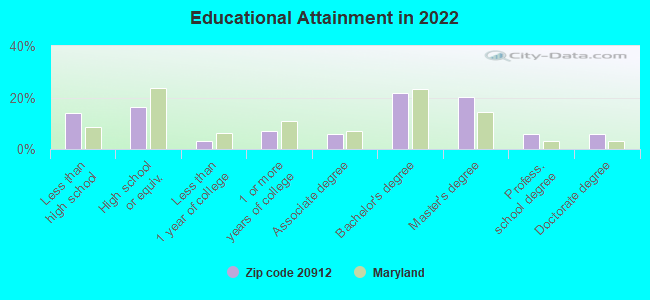
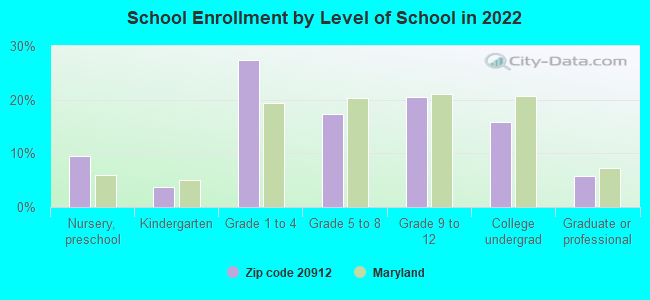
Private vs. public school enrollment:
Students in private schools in grades 1 to 8 (elementary and middle school): 479
Here:
15.7%
Maryland:
15.2%
Students in private schools in grades 9 to 12 (high school): 107
Here:
7.6%
Maryland:
14.4%
Students in private undergraduate colleges: 271
Here:
24.9%
Maryland:
20.2%
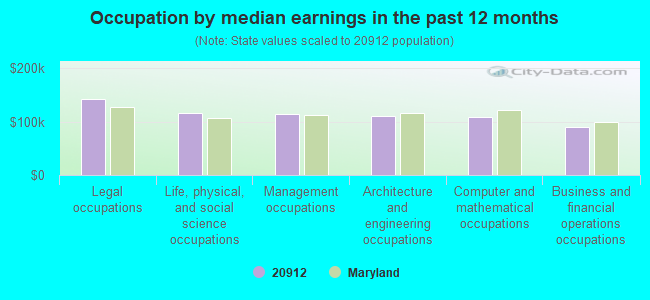
Occupation by median earnings in the past 12 months ($)
142,368Legal occupations
116,919Life, physical, and social science occupations
114,722Management occupations
110,776Architecture and engineering occupations
108,748Computer and mathematical occupations
90,108Business and financial operations occupations
Companies with federal contracts located in this zip code (TAKOMA PARK, MD):
OMV MEDICAL, INC (6940 CARROLL AVE; small business) : $113,277,483 in 702 contractsfrom 1999 to 2006
Contracts for Nursing Home Care Contracts, Nursing Services, General Health Care Services, Other Medical Services, and moreby Army, United States Coast Guard (disused code: now 7008), National Oceanic and Atmospheric Administration/Under Secretary for Oceans and Atmosphere, Office of Assistant Secretary for Health except national centers (disused code), and others Signed by year:2000: $20,527,931; 2001: $16,702,242; 2002: $23,480,956; 2003: $8,989,863; 2004: $142,404,603; 2005: -$107,912,763; 2006: $387,210.
Biggest contracts:
$123,472,725 with Army for Nursing Home Care Contracts. Taking place in DC. Signed on 2004-12-13. Completion date: 2005-03-31.
$9,586,188 with Army for Nursing Services. Taking place in TX. Signed on 2005-11-01. Completion date: 2006-09-30.
$7,181,554, same as above.Signed on 2004-11-04. Completion date: 2005-09-30.
$6,385,057, same as above.Signed on 2003-02-03. Completion date: 2010-09-30.
LAWSON S PROFESSIONAL CLEANING (6917 PRINCE GEORGES AVE; small business) : $901,208 in 76 contractsfrom 1999 to 2006
Contracts for Other Buildings, Maintenance, Repair and Rebuilding of Equipment -- Refrigeration, Air Conditioning, and Air Circulating Equipment, Other Housekeeping Services, Other Professional Services, and moreby National Park Service, Corporation for National and Community Service, Navy, Public Buildings Service, and others Signed by year:2000: $58,446; 2001: $10,272; 2002: $193,896; 2003: $178,850; 2004: $145,903; 2005: $198,862; 2006: $55,509.
Biggest contracts:
$75,000 with National Park Service for Other Buildings. Taking place in VA. Signed on 2002-09-15. Completion date: 2002-09-15.
$72,200 with Corporation for National and Community Service for Maintenance, Repair and Rebuilding of Equipment -- Refrigeration, Air Conditioning, and Air Circulating Equipment. Signed on 2003-07-15. Completion date: 2003-09-15.
$59,470 with Navy for Other Housekeeping Services. Taking place in NC. Signed on 1999-10-25. Completion date: 2000-09-30.
$58,446, same as above.Signed on 2000-10-23. Completion date: 2001-09-30.
ROBUST ANALYSIS, INC (6618 ALLEGHENY AVENUE; small business) : $519,621 in 2 contractsfrom 2002 to 2005
$459,621 with Navy for Defense Electronics and Communication Equipment -- Applied Research and Exploratory Development (R&D). Signed on 2005-02-04. Completion date: 2006-06-15.
$60,000 with Navy for Mathematical and Computer Sciences -- Basic Research (R&D). Signed on 2002-10-11. Completion date: 2003-04-11.
CREATIVE FILING SYSTEMS INC (1350 HOLTON LN; small business) : $225,344 in 17 contractsfrom 2000 to 2006
Contracts for Veterinary/Animal Care Services, Other Photographic, Mapping, Printing, and Publication Services, Arts/Graphics Services, Office Supplies, and moreby Financial Crimes Enforcement Network, Department of State, Food and Drug Administration, Navy, and others Signed by year:2000: $71,000; 2001: $47,000; 2002: $37,616; 2003: -$15,599; 2004: $4,095; 2005: $61,322; 2006: $19,910.
Biggest contracts:
$71,000 with Financial Crimes Enforcement Network for Veterinary/Animal Care Services. Taking place in CA. Signed on 2000-11-15. Completion date: 2000-11-15.
$59,000, same as above.Signed on 2001-10-15. Completion date: 2002-09-15.
$47,616, same as above.Signed on 2002-12-15. Completion date: 2003-09-15.
$44,133 with Department of State for Other Photographic, Mapping, Printing, and Publication Services. Signed on 2005-06-28. Completion date: 2005-07-29.
JAMES B. DAY (6415 5TH AVENUE; small business) : $130,003 in 5 contractsfrom 2004 to 2006
Contracts for Personal Services Contracts by Departmental Offices Signed by year:2000: $0; 2001: $0; 2002: $0; 2003: $0; 2004: $47,182; 2005: $19,980; 2006: $62,841.
Biggest contracts:
$40,220 with Departmental Offices for Personal Services Contracts. Taking place in DC. Signed on 2006-01-13. Effective on 2006-01-16. Completion date: 2007-01-15.
$37,462, same as above.Signed on 2004-12-30. Completion date: 2006-01-15.
$22,621, same as above.Signed on 2006-09-22. Completion date: 2007-01-15.
$19,980, same as above.Signed on 2005-11-15. Completion date: 2006-01-15.
ICARUS INSTRUMENTS, INC (7000 CARROLL AVE STE-200; small business)
$27,950 with Air Force for Antennas, Waveguides, and Related Equipment. Signed on 2002-09-29. Completion date: 2002-11-28.
HELF, GAVIN (8001 GLENSIDE DR; small business) : $20,000 in 2 contractsfrom 2003 to 2004
$10,000 with Army for Technical Assistance. Signed on 2003-12-04. Completion date: 2004-12-07.
$10,000, same as above.Signed on 2004-01-29. Completion date: 2004-12-07.
SILVER, SUSAN (8308 BARRON ST APT 4; small business)
$3,500 with Navy for Other Professional Services. Signed on 2005-04-12. Completion date: 2005-06-08.
Top industries in this zip code by the number of employees in 2005:
Health Care and Social Assistance: General Medical and Surgical Hospitals (over 1000 employees: 1 establishment)
Administrative and Support and Waste Management and Remediation Services: Security Guards and Patrol Services (250-499: 1, 1-4: 1)
Health Care and Social Assistance: Offices of Physicians (except Mental Health Specialists) (20-49: 1, 10-19: 6, 5-9: 10, 1-4: 27)
Administrative and Support and Waste Management and Remediation Services: Temporary Help Services (100-249: 1, 10-19: 1)
Health Care and Social Assistance: Nursing Care Facilities (100-249: 1, 1-4: 1)
2004 - 2018 National Fire Incident Reporting System (NFIRS) incidents
According to the data from the years 2004 - 2018 the average number of fires per year is 39. The highest number of reported fire incidents - 67 took place in 2007, and the least - 23 in 2004. The data has an increasing trend.
When looking into fire subcategories, the most reports belonged to: Structure Fires (46.5%), and Outside Fires (28.5%).
Fire incident types reported to NFIRS in Zip Code 20912
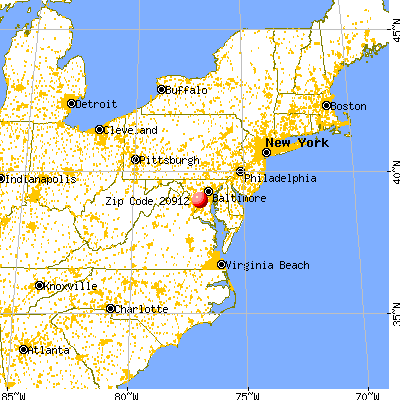


 Nearest zip codes: 20307, 20012, 20783, 20011, 20782, 20901.
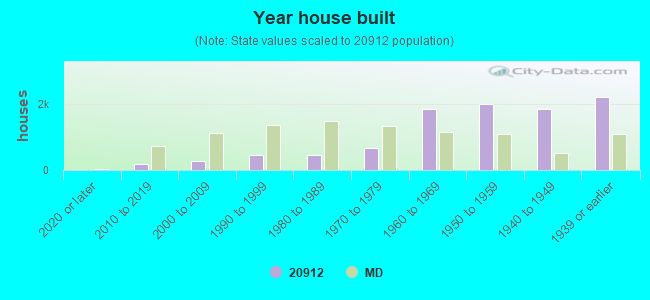


 According to the data from the years 2004 - 2018 the average number of fires per year is 39. The highest number of reported fire incidents - 67 took place in 2007, and the least - 23 in 2004. The data has an increasing trend.
 When looking into fire subcategories, the most reports belonged to: Structure Fires (46.5%), and Outside Fires (28.5%).