Estimated zip code population in 2022: 38,650 Zip code population in 2010: 38,474 Zip code population in 2000: 37,779
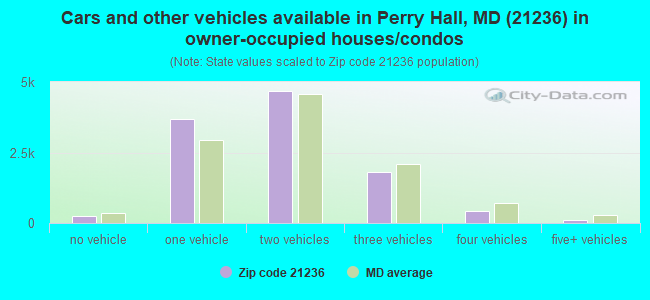
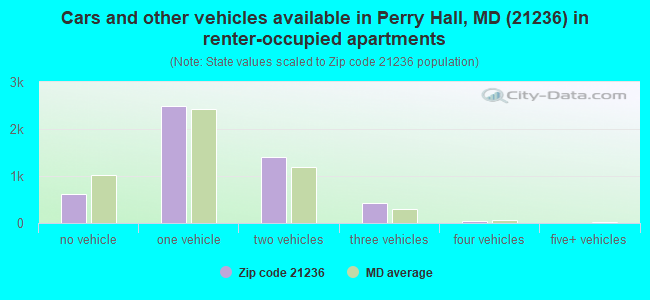
Houses and condos: 16,228 Renter-occupied apartments: 4,993
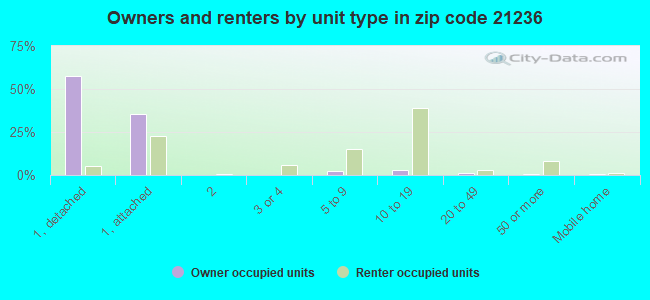
% of renters here:
31%
State:
32%
March 2022 cost of living index in zip code 21236: 105.9 (more than average, U.S. average is 100)
Land area: 8.6 sq. mi. Water area: 0.0 sq. mi.
Population density: 4,515 people per square mile
(average).
OSM Map
General Map
Google Map
MSN Map
OSM Map
General Map
Google Map
MSN Map
OSM Map
General Map
Google Map
MSN Map
OSM Map
General Map
Google Map
MSN Map
Please wait while loading the map...
Real estate property taxes paid for housing units in 2022:
This zip code:
1.1% ($3,374)
Maryland:
0.9% ($3,777)
Median real estate property taxes paid for housing units with mortgages in 2022: $3,332 (1.1%) Median real estate property taxes paid for housing units with no mortgage in 2022: $3,457 (1.1%)
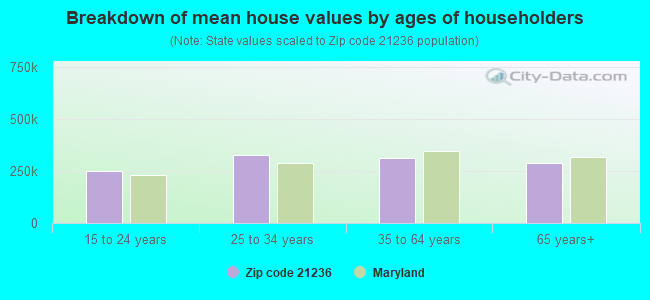
Estimated median house/condo value in 2022: $302,786
21236:
$302,786
Maryland:
$398,100
According to our research of Maryland and other state lists, there were 38 registered sex offenders living in 21236 zip code as of April 26, 2024. The ratio of all residents to sex offenders in zip code 21236 is 1,024 to 1. The ratio of registered sex offenders to all residents in this zip code is lower than the state average.
Median resident age:
This zip code:
39.2 years
Maryland median age:
39.7 years
Average household size:
This zip code:
2.4 people
Maryland:
2.5 people
Averages for the 2020 tax year for zip code 21236, filed in 2021:
Average Adjusted Gross Income (AGI) in 2020: $63,750 (Individual Income Tax Returns)
Here:
$63,750
State:
$86,905
Salary/wage: $58,902 (reported on 82.8% of returns)
Here:
$58,902
State:
$73,953
(% of AGI for various income ranges: 1105.0% for AGIs below $25k, 3589.7% for AGIs $25k-50k, 6760.4% for AGIs $50k-75k, 9605.6% for AGIs $75k-100k, 17465.8% for AGIs $100k-200k, 50172.7% for AGIs over 200k)
Taxable interest for individuals: $894 (reported on 35.6% of returns)
This zip code:
$894
Maryland:
$1,528
(% of AGI for various income ranges: 20.4% for AGIs below $25k, 19.9% for AGIs $25k-50k, 44.5% for AGIs $50k-75k, 50.8% for AGIs $75k-100k, 83.4% for AGIs $100k-200k, 536.8% for AGIs over 200k)
Ordinary dividends: $3,287 (reported on 17.8% of returns)
Here:
$3,287
State:
$8,028
(% of AGI for various income ranges: 21.0% for AGIs below $25k, 28.0% for AGIs $25k-50k, 54.7% for AGIs $50k-75k, 100.0% for AGIs $75k-100k, 172.5% for AGIs $100k-200k, 1536.4% for AGIs over 200k)
Net capital gain/loss in AGI: +$5,419 (reported on 15.6% of returns)
Here:
+$5,419
State:
+$25,238
(% of AGI for various income ranges: 3.3% for AGIs below $25k, 20.6% for AGIs $25k-50k, 57.3% for AGIs $50k-75k, 97.3% for AGIs $75k-100k, 227.5% for AGIs $100k-200k, 3922.3% for AGIs over 200k)
Profit/loss from business: +$6,451 (reported on 17.0% of returns)
Here:
+$6,451
State:
+$11,398
(% of AGI for various income ranges: 129.8% for AGIs below $25k, 108.4% for AGIs $25k-50k, 79.3% for AGIs $50k-75k, 168.1% for AGIs $75k-100k, 266.4% for AGIs $100k-200k, 1115.9% for AGIs over 200k)
Taxable individual retirement arrangement distribution: $15,696 (reported on 9.3% of returns)
21236:
$15,696
Maryland:
$20,944
(% of AGI for various income ranges: 59.8% for AGIs below $25k, 91.0% for AGIs $25k-50k, 173.4% for AGIs $50k-75k, 296.3% for AGIs $75k-100k, 497.9% for AGIs $100k-200k, 1829.5% for AGIs over 200k)
Self-employed (Keogh) retirement plans: $9,950 (reported on 0.2% of returns)
21236:
$9,950
Maryland:
$29,558
(% of AGI for various income ranges: 17.9% for AGIs $100k-200k)
Total itemized deductions: $24,527 (reported on 15.3% of returns)
Here:
$24,527
State:
$30,672
(% of AGI for various income ranges: 67.9% for AGIs below $25k, 196.2% for AGIs $25k-50k, 613.9% for AGIs $50k-75k, 968.2% for AGIs $75k-100k, 1280.5% for AGIs $100k-200k, 3417.3% for AGIs over 200k)
Charity contributions: $6,019 (reported on 12.8% of returns)
Here:
$6,019
State:
$9,065
(% of AGI for various income ranges: 5.8% for AGIs below $25k, 30.2% for AGIs $25k-50k, 92.8% for AGIs $50k-75k, 168.8% for AGIs $75k-100k, 319.8% for AGIs $100k-200k, 1081.8% for AGIs over 200k)
Taxes paid: $8,037 (reported on 15.2% of returns)
21236:
$8,037
State:
$8,475
(% of AGI for various income ranges: 12.6% for AGIs below $25k, 48.5% for AGIs $25k-50k, 204.1% for AGIs $50k-75k, 376.0% for AGIs $75k-100k, 428.4% for AGIs $100k-200k, 994.5% for AGIs over 200k)
Earned income credit: $2,192 (reported on 13.7% of returns)
Here:
$2,192
State:
$2,151
(% of AGI for various income ranges: 88.0% for AGIs below $25k, 63.9% for AGIs $25k-50k, 0.7% for AGIs $50k-75k)
Percentage of individuals using paid preparers for their 2020 taxes: 91.3%
Here:
91%
State:
90%
(% for various income ranges: 90.3% for AGIs below $25k, 92.4% for AGIs $25k-50k, 91.0% for AGIs $50k-75k, 91.5% for AGIs $75k-100k, 91.9% for AGIs $100k-200k, 89.3% for AGIs over 200k)
Averages for the 2012 tax year for zip code 21236, filed in 2013:
Average Adjusted Gross Income (AGI) in 2012: $56,680 (Individual Income Tax Returns)
Here:
$56,680
State:
$72,703
Salary/wage: $53,434 (reported on 86.4% of returns)
Here:
$53,434
State:
$62,228
(% of AGI for various income ranges: 71.7% for AGIs below $25k, 81.6% for AGIs $25k-50k, 81.1% for AGIs $50k-75k, 82.1% for AGIs $75k-100k, 84.4% for AGIs $100k-200k, 75.3% for AGIs over 200k)
Taxable interest for individuals: $760 (reported on 45.1% of returns)
This zip code:
$760
Maryland:
$1,413
(% of AGI for various income ranges: 1.4% for AGIs below $25k, 0.6% for AGIs $25k-50k, 0.6% for AGIs $50k-75k, 0.5% for AGIs $75k-100k, 0.5% for AGIs $100k-200k, 0.7% for AGIs over 200k)
Ordinary dividends: $2,447 (reported on 20.7% of returns)
Here:
$2,447
State:
$6,933
(% of AGI for various income ranges: 1.3% for AGIs below $25k, 0.7% for AGIs $25k-50k, 0.8% for AGIs $50k-75k, 0.9% for AGIs $75k-100k, 0.8% for AGIs $100k-200k, 1.6% for AGIs over 200k)
Net capital gain/loss in AGI: +$2,868 (reported on 13.3% of returns)
Here:
+$2,868
State:
+$14,830
(% of AGI for various income ranges: 0.3% for AGIs $50k-75k, 0.2% for AGIs $75k-100k, 0.7% for AGIs $100k-200k, 5.6% for AGIs over 200k)
Profit/loss from business: +$7,984 (reported on 12.8% of returns)
Here:
+$7,984
State:
+$12,606
(% of AGI for various income ranges: 6.1% for AGIs below $25k, 2.3% for AGIs $25k-50k, 1.5% for AGIs $50k-75k, 1.1% for AGIs $75k-100k, 1.1% for AGIs $100k-200k, 2.8% for AGIs over 200k)
Taxable individual retirement arrangement distribution: $11,967 (reported on 10.3% of returns)
21236:
$11,967
Maryland:
$17,065
(% of AGI for various income ranges: 3.8% for AGIs below $25k, 2.2% for AGIs $25k-50k, 1.9% for AGIs $50k-75k, 2.1% for AGIs $75k-100k, 1.9% for AGIs $100k-200k, 2.6% for AGIs over 200k)
Self-employment retirement plans: $11,540 (reported on 0.2% of returns)
21236:
$11,540
Maryland:
$24,439
Total itemized deductions: $20,281 (24% of AGI, reported on 46.5% of returns)
Here:
$20,281
State:
$27,886
Here:
23.8% of AGI
State:
22.8% of AGI
(% of AGI for various income ranges: 11.2% for AGIs below $25k, 13.5% for AGIs $25k-50k, 17.4% for AGIs $50k-75k, 18.4% for AGIs $75k-100k, 18.2% for AGIs $100k-200k, 14.3% for AGIs over 200k)
Charity contributions: $2,682 (reported on 40.0% of returns)
Here:
$2,682
State:
$4,452
(% of AGI for various income ranges: 1.0% for AGIs below $25k, 1.6% for AGIs $25k-50k, 2.1% for AGIs $50k-75k, 2.0% for AGIs $75k-100k, 2.1% for AGIs $100k-200k, 1.7% for AGIs over 200k)
Taxes paid: $8,205 (reported on 46.4% of returns)
21236:
$8,205
State:
$11,690
(% of AGI for various income ranges: 2.4% for AGIs below $25k, 3.9% for AGIs $25k-50k, 6.2% for AGIs $50k-75k, 7.5% for AGIs $75k-100k, 8.6% for AGIs $100k-200k, 8.2% for AGIs over 200k)
Earned income credit: $2,001 (reported on 11.6% of returns)
Here:
$2,001
State:
$2,199
(% of AGI for various income ranges: 4.6% for AGIs below $25k, 0.7% for AGIs $25k-50k)
Percentage of individuals using paid preparers for their 2012 taxes: 50.0%
Here:
50%
State:
52%
(% for various income ranges: 48.2% for AGIs below $25k, 47.6% for AGIs $25k-50k, 50.1% for AGIs $50k-75k, 53.5% for AGIs $75k-100k, 54.0% for AGIs $100k-200k, 61.5% for AGIs over 200k)
Averages for the 2004 tax year for zip code 21236, filed in 2005:
Average Adjusted Gross Income (AGI) in 2004: $47,358 (Individual Income Tax Returns)
Here:
$47,358
State:
$60,339
Salary/wage: $45,863 (reported on 87.3% of returns)
Here:
$45,863
State:
$52,211
(% of AGI for various income ranges: 88.4% for AGIs below $10k, 73.5% for AGIs $10k-25k, 84.0% for AGIs $25k-50k, 86.7% for AGIs $50k-75k, 87.8% for AGIs $75k-100k, 83.4% for AGIs over 100k)
Taxable interest for individuals: $1,057 (reported on 55.0% of returns)
This zip code:
$1,057
Maryland:
$1,701
(% of AGI for various income ranges: 5.0% for AGIs below $10k, 2.8% for AGIs $10k-25k, 1.4% for AGIs $25k-50k, 0.9% for AGIs $50k-75k, 0.9% for AGIs $75k-100k, 1.0% for AGIs over 100k)
Taxable dividends: $1,434 (reported on 25.8% of returns)
Here:
$1,434
State:
$4,235
(% of AGI for various income ranges: 2.5% for AGIs below $10k, 1.5% for AGIs $10k-25k, 0.8% for AGIs $25k-50k, 0.6% for AGIs $50k-75k, 0.6% for AGIs $75k-100k, 0.8% for AGIs over 100k)
Net capital gain/loss: +$2,645 (reported on 18.5% of returns)
Here:
+$2,645
State:
+$15,888
(% of AGI for various income ranges: -1.5% for AGIs below $10k, 0.3% for AGIs $10k-25k, 0.2% for AGIs $25k-50k, 0.4% for AGIs $50k-75k, 0.5% for AGIs $75k-100k, 3.1% for AGIs over 100k)
Profit/loss from business: +$7,693 (reported on 11.6% of returns)
Here:
+$7,693
State:
+$12,221
(% of AGI for various income ranges: 2.9% for AGIs below $10k, 4.4% for AGIs $10k-25k, 1.9% for AGIs $25k-50k, 1.6% for AGIs $50k-75k, 1.5% for AGIs $75k-100k, 1.7% for AGIs over 100k)
IRA payment deduction: $2,916 (reported on 3.2% of returns)
21236:
$2,916
Maryland:
$2,968
(% of AGI for various income ranges: 0.2% for AGIs below $10k, 0.3% for AGIs $10k-25k, 0.3% for AGIs $25k-50k, 0.2% for AGIs $50k-75k, 0.2% for AGIs $75k-100k, 0.1% for AGIs over 100k)
Self-employed pension: $7,990 (reported on 0.5% of returns)
Here:
$7,990
Maryland:
$17,155
(% of AGI for various income ranges: 0.1% for AGIs $25k-50k, 0.0% for AGIs $50k-75k, 0.1% for AGIs $75k-100k, 0.2% for AGIs over 100k)
Total itemized deductions: $16,606 (23% of AGI, reported on 48.9% of returns)
Here:
$16,606
State:
$22,960
Here:
23.4% of AGI
State:
23.3% of AGI
(% of AGI for various income ranges: 11.9% for AGIs below $10k, 11.8% for AGIs $10k-25k, 16.1% for AGIs $25k-50k, 18.8% for AGIs $50k-75k, 19.1% for AGIs $75k-100k, 16.8% for AGIs over 100k)
Charity contributions deductions: $2,430 (3% of AGI, reported on 45.0% of returns)
Here:
$2,430
State:
$4,031
Here:
3.4% of AGI
State:
3.9% of AGI
(% of AGI for various income ranges: 0.8% for AGIs below $10k, 1.4% for AGIs $10k-25k, 2.1% for AGIs $25k-50k, 2.5% for AGIs $50k-75k, 2.6% for AGIs $75k-100k, 2.5% for AGIs over 100k)
Total tax: $5,793 (reported on 82.9% of returns)
21236:
$5,793
State:
$10,167
(% of AGI for various income ranges: 2.4% for AGIs below $10k, 4.5% for AGIs $10k-25k, 7.6% for AGIs $25k-50k, 9.3% for AGIs $50k-75k, 10.1% for AGIs $75k-100k, 14.9% for AGIs over 100k)
Earned income credit: $1,570 (reported on 7.8% of returns)
Here:
$1,570
State:
$1,700
Percentage of individuals using paid preparers for their 2004 taxes: 50.7%
Here:
51%
State:
55%
(% for various income ranges: 42.2% for AGIs below $10k, 52.3% for AGIs $10k-25k, 51.3% for AGIs $25k-50k, 53.5% for AGIs $50k-75k, 52.2% for AGIs $75k-100k, 52.2% for AGIs over 100k)
Likely homosexual households (counted as self-reported same-sex unmarried-partner households)
Lesbian couples: 0.2% of all households
Gay men: 0.1% of all households
Household received Food Stamps/SNAP in the past 12 months: 1,570 Household did not receive Food Stamps/SNAP in the past 12 months: 14,257
Women who had a birth in the past 12 months: 405 (185 now married, 217 unmarried) Women who did not have a birth in the past 12 months: 8,635 (3,882 now married, 4,753 unmarried)
Housing units in zip code 21236 with a mortgage: 7,311 (699 second mortgage, 36 home equity loan, 523 both second mortgage and home equity loan) Houses without a mortgage: 328
Median monthly owner costs for units with a mortgage: $1,721 Median monthly owner costs for units without a mortgage: $603
Residents with income below the poverty level in 2022:
This zip code:
10.2%
Whole state:
9.6%
Residents with income below 50% of the poverty level in 2022:
This zip code:
4.1%
Whole state:
4.7%
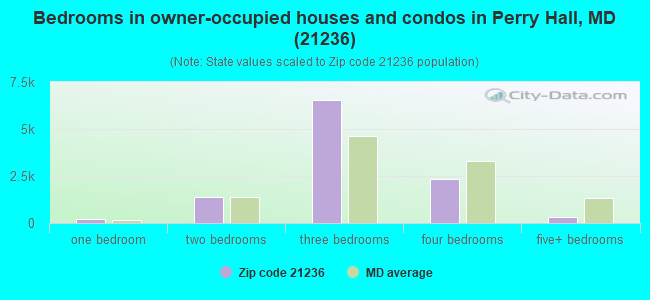
Median number of rooms in houses and condos:
Here:
7.0
State:
7.3
Median number of rooms in apartments:
Here:
4.3
State:
4.2
Notable locations in this zip code not listed on our city pages
Notable locations in zip code 21236: Baltimore County Fire Department Station 8 Fullerton (A), Baltimore County Fire Department Station 55 Perry Hall (B), Perry Hall Branch Baltimore County Public Library (C), Brightview of White Marsh Assisted Living Center (D), Baltimore County Police Department - Eastern Traffic Unit (E), Fourteenth District Health Center (F). Display/hide their locations on the map
Shopping Centers: Belair Beltway Plaza Shopping Center (1), Fullerton Plaza Shopping Center (2), Putty Hill Plaza Shopping Center (3), White Marsh Plaza Shopping Center (4), Perry Hall Crossing Shopping Center (5), Perry Hall Shopping Center (6), Perry Hall Square Shopping Center (7), Silver Spring Shopping Center (8), Northview Shopping Center (9). Display/hide their locations on the map
Churches in zip code 21236 include: Saint Peters Lutheran Church (A), Perry Hall Church (B), East Baltimore Church of Christ (C), Faith Fellowship Church (D), Perry Hall Presbyterian Church (E), Zion United Church of Christ Perry Hall (F), Saint Josephs Church (G), Saint Michaels Church (H). Display/hide their locations on the map
In group quarters: 24 (-1 institutionalized population)
Size of family households: 4,415 2-persons, 3,013 3-persons, 1,663 4-persons, 853 5-persons, 378 6-persons, 32 7-or-more-persons
Size of nonfamily households: 4,449 1-person, 1,035 2-persons, 22 3-persons
4,889 married couples with children.
2,711 single-parent households (487 men, 2,224 women).
77.9% of residents of 21236 zip code speak English at home.
3.2% of residents speak Spanish at home (76% very well, 20% well, 3% not well, 1% not at all).
9.1% of residents speak other Indo-European language at home (57% very well, 28% well, 5% not well, 11% not at all).
6.1% of residents speak Asian or Pacific Island language at home (68% very well, 21% well, 10% not well, 1% not at all).
4.0% of residents speak other language at home (83% very well, 17% well).
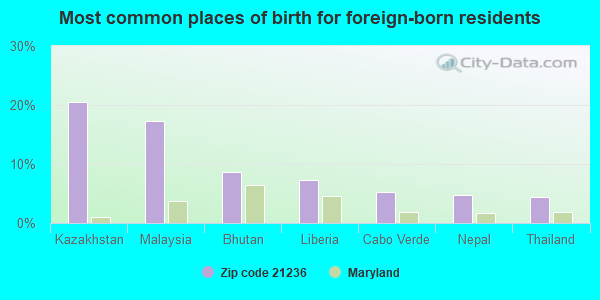
Foreign born population: 7,043 (18.2%) (60.7% of them are naturalized citizens)
Major facilities with environmental interests located in this zip code:
MD SCHOOL FOR BLIND (3501 TAYLOR AVE in BALTIMORE, MD)
AIR MINOR (AIRS/AFS) STATE MASTER (Maryland Permits tracking) - National Pollutant Discharge Elimination System Permit STATE MASTER (Maryland Air Emissions Database) - AIR MINOR COMPLIANCE ACTIVITY (Tracking inspections of insecticide, fungicide, and rodenticide, and toxic substances) National Pollutant Discharge Elimination System NON-MAJOR (Tracking pollutant discharge elimination systems) - permit Business SIC classification: ELEMENTARY AND SECONDARY SCHOOLS
PERRY HALL MIDDLE SCHOOL (4300 EBENEZER ROAD in BALTIMORE, MD)
AIR MINOR (AIRS/AFS) STATE MASTER (Maryland Air Emissions Database) - AIR MINOR (National Center for Education Statistics) - STATE ID-031151 Small Quantity Generators, between 100 kg and 1000 kg of hazardous waste/month (Resource Conservation and Recovery Act (tracking hazardous waste)) - notification Business SIC classification: ELEMENTARY AND SECONDARY SCHOOLS Organizations: BALTO COUNTY BOARD OF ED (CONTACT/OWNER)
, BALTIMORE COUNTY PUBLIC SCHOOLS (SCHOOL DISTRICT)
BETTY BRITE CLEANERS (7616 BELAIR RD in BALTIMORE, MD)
AIR MINOR (AIRS/AFS) STATE MASTER (Maryland Air Emissions Database) - AIR MINOR Conditionally Exempt Small Quantity Generators, less than 100 kg/month of hazardous waste (Resource Conservation and Recovery Act (tracking hazardous waste)) - notification Business SIC classification: DRYCLEANING PLANTS, EXCEPT RUG CLEANING Organizations: OPERNAME (CONTACT/OPERATOR)
, HYO JUN KIM (CONTACT/OWNER)
, DAVID H KIM (CONTACT/OWNER)
Alternative names: BETTY BRITE - 7616 BELAIR ROAD
PUTTY HILL BODY SHOP (8225 BELAIR ROAD in BALTIMORE, MD)
AIR MINOR (AIRS/AFS) STATE MASTER (Maryland Air Emissions Database) - AIR MINOR Large Quantity Generators, more that 1000 kg of hazardous waste/month (Resource Conservation and Recovery Act (tracking hazardous waste)) - notification Business SIC classification: TOP, BODY, AND UPHOLSTERY REPAIR SHOPS AND PAINT SHOPS Organizations: SCHLUTER CHARLES (CONTACT/OWNER)
BALTIMORE COUNTY RECREATION & PARKS (7704 BELAIR RD. in BALTIMORE, MD)
AIR MINOR (AIRS/AFS) STATE MASTER (Maryland Air Emissions Database) - AIR MINOR (Resource Conservation and Recovery Act (tracking hazardous waste)) Business SIC classification: HIGHWAY AND STREET CONSTRUCTION, EXCEPT ELEVATED HIGHWAYS; REGULATION AND ADMINISTRATION OF TRANSPORTATION PROGRAMS Alternative names: BALTIMORE CO. - DOUBLE ROCK MAINTNCE, DOUBLE ROCK MAIN SHOP
BELAIR CLEANERS (7950 BELAIR ROAD in BALTIMORE, MD)
AIR MINOR (AIRS/AFS) STATE MASTER (Maryland Air Emissions Database) - AIR MINOR Conditionally Exempt Small Quantity Generators, less than 100 kg/month of hazardous waste (Resource Conservation and Recovery Act (tracking hazardous waste)) - notification Business SIC classification: DRYCLEANING PLANTS, EXCEPT RUG CLEANING Organizations: OPERNAME (CONTACT/OPERATOR)
, OWNERNAME (CONTACT/OWNER)
Alternative names: BEL AIR CLEANERS
EXXON (8101 BELAIR ROAD in BALTIMORE, MD)
AIR MINOR (AIRS/AFS) STATE MASTER (Maryland Air Emissions Database) - AIR MINOR Small Quantity Generators, between 100 kg and 1000 kg of hazardous waste/month (Resource Conservation and Recovery Act (tracking hazardous waste)) - notification Business SIC classification: GASOLINE SERVICE STATIONS Organizations: OPERNAME (CONTACT/OPERATOR)
, EXXONMOBIL CORP (CONTACT/OWNER)
Alternative names: EXXON - 8101 BELAIR ROAD, EXXON COMPANY USA RS#27477, EXXON RAS 27477
PERRY HALL AMOCO (8809 BELAIR ROAD in NOTTINGHAM, MD)
AIR MINOR (AIRS/AFS) STATE MASTER (Maryland Air Emissions Database) - AIR MINOR Small Quantity Generators, between 100 kg and 1000 kg of hazardous waste/month (Resource Conservation and Recovery Act (tracking hazardous waste)) - notification Business SIC classification: GASOLINE SERVICE STATIONS Organizations: AMOCO OIL CO (CONTACT/OWNER)
Alternative names: AMOCO #60067 TANKS, BP, BP - 8809 BELAIR ROAD
AIR COMPRESSOR SERVICE (8346 BELAIR ROAD in BALTIMORE, MD)
AIR MINOR (AIRS/AFS) STATE MASTER (Maryland Air Emissions Database) - AIR MINOR Business SIC classification: REPAIR SHOPS AND RELATED SERVICES
PUTTY HILL PRINTING (8019 BELAIR ROAD in FULLERTON, MD)
AIR MINOR (AIRS/AFS) STATE MASTER (Maryland Air Emissions Database) - AIR MINOR Business SIC classification: COMMERCIAL PRINTING, LITHOGRAPHIC
B.J. S WHOLESALE CLUB - 4201 WHOLESA (4201 WHOLESALE CLUB DRIVE in NOTTINGHAM, MD)
AIR MINOR (AIRS/AFS) STATE MASTER (Maryland Air Emissions Database) - AIR MINOR Business SIC classification: VARIETY STORES; GASOLINE SERVICE STATIONS Alternative names: BJS WHOLESALE CLUB -40
CHUCK'S BODY & FENDER (8400 BELAIR ROAD in FULLERTON, MD)
AIR MINOR (AIRS/AFS) STATE MASTER (Maryland Air Emissions Database) - AIR MINOR Business SIC classification: TOP, BODY, AND UPHOLSTERY REPAIR SHOPS AND PAINT SHOPS; GENERAL AUTOMOTIVE REPAIR SHOPS Alternative names: CHUCK S BODY & FENDER
BELMONT RECREATIONAL CORP. (8549 GRADIEN DRIVE in BALTIMORE, MD)
STATE MASTER (Maryland Permits tracking) - National Pollutant Discharge Elimination System Permit National Pollutant Discharge Elimination System NON-MAJOR (Tracking pollutant discharge elimination systems) - permit Business SIC classification: AMUSEMENT AND RECREATION SERVICES Alternative names: CONWAY MANAGEMENT CO.,INC.
Housing units lacking complete plumbing facilities: 0.1% Housing units lacking complete kitchen facilities: 0.3%
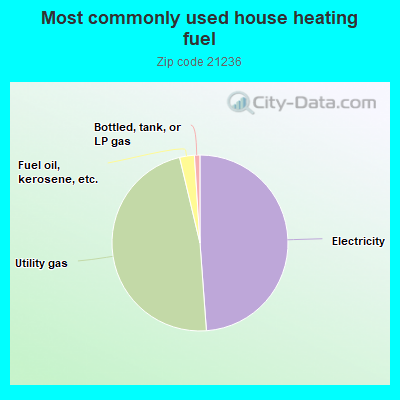
48.7%Electricity
47.3%Utility gas
2.7%Fuel oil, kerosene, etc.
1.0%Bottled, tank, or LP gas
Population in 1990: 33,099. Population change in the 1990s: +4,680 (+14.1%).
Place of birth for U.S.-born residents:
This state: 24,799
Northeast: 2,937
Midwest: 845
South: 2,086
West: 860
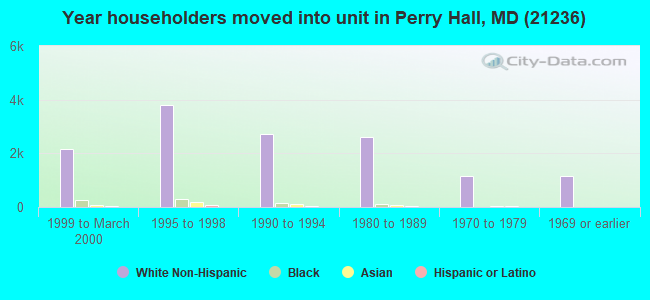
59% of the 21236 zip code residents lived in the same house 5 years ago. Out of people who lived in different houses, 50% lived in this county. Out of people who lived in different counties, 50% lived in Maryland.
92% of the 21236 zip code residents lived in the same house 1 year ago. Out of people who lived in different houses, 62% moved from this county. Out of people who lived in different houses, 26% moved from different county within same state. Out of people who lived in different houses, 12% moved from different state. Out of people who lived in different houses, 1% moved from abroad.
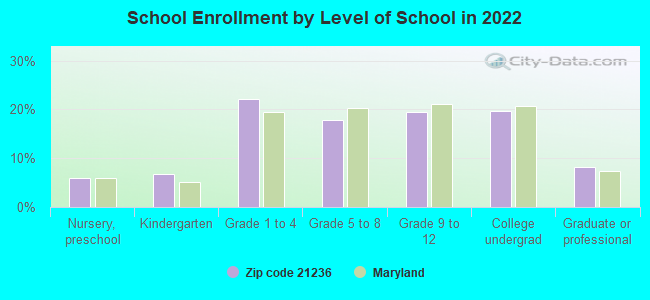
Private vs. public school enrollment:
Students in private schools in grades 1 to 8 (elementary and middle school): 399
Here:
11.6%
Maryland:
15.2%
Students in private schools in grades 9 to 12 (high school): 212
Here:
12.6%
Maryland:
14.4%
Students in private undergraduate colleges: 321
Here:
18.9%
Maryland:
20.2%
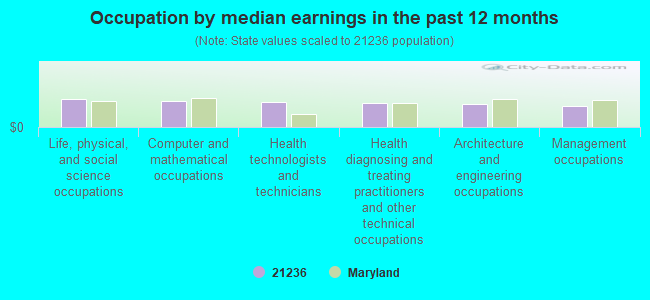
Occupation by median earnings in the past 12 months ($)
100,962Life, physical, and social science occupations
95,716Computer and mathematical occupations
90,975Health technologists and technicians
86,628Health diagnosing and treating practitioners and other technical occupations
82,365Architecture and engineering occupations
77,889Management occupations
Companies with biggest federal contracts located in this zip code (BALTIMORE, MD):
ALEXANDERS MOVING & STORAGE EA (10001 FRANKLIN SQUARE DRIV) : $35,633,627 in 46 contractsfrom 1999 to 2006
Contracts for Relocation Services, Modification of Equipment -- Instruments and Laboratory Equipment, Construction of Structures and Facilities -- Office Buildings, Technical Representation Services -- Alarm, Signal, and Security Detection Systems by Army Signed by year:2000: $15,165,811; 2001: $10,659,078; 2002: $8,240,362; 2003: $1,650,199; 2004: -$291,066; 2005: $0; 2006: $9,243.
Biggest contracts:
$5,516,321 with Army for Relocation Services. Signed on 2000-01-27. Completion date: 2000-12-31.
$3,000,000 with Army for Modification of Equipment -- Instruments and Laboratory Equipment. Signed on 2001-09-21. Completion date: 2002-12-31.
$2,744,241 with Army for Relocation Services. Signed on 2000-03-01. Completion date: 2000-12-31.
$2,200,000, same as above.Signed on 2001-02-15. Completion date: 2001-12-31.
SCHMIDT BAKING COMPANY INCORPO (7801 FITCH LN; small business) : $2,504,416 in 27 contractsfrom 2001 to 2006
Contracts for Food Items For Resale, Bakery and Cereal Products, Drugs and Biologicals by Defense Commissary Agency, Department of Veterans Affairs, Defense Logistics Agency Signed by year:2000: $0; 2001: $36,000; 2002: $22,000; 2003: $29,568; 2004: $458,864; 2005: $1,370,232; 2006: $587,752.
Biggest contracts:
$600,160 with Defense Commissary Agency for Food Items For Resale. Signed on 2005-04-01. Completion date: 2005-08-31.
$585,216, same as above.Signed on 2006-01-01. Completion date: 2006-03-31.
$449,757, same as above.Signed on 2004-10-01. Completion date: 2005-02-28.
$370,804, same as above.Signed on 2005-10-01. Completion date: 2005-12-31.
TURNBERRY, LLC (4940 CAMPBELL BLVD STE 11)
$1,244,376 with Air Force for Lodging - Hotel/Motel. Signed on 2004-09-30. Completion date: 2008-12-31.
PEGASUS RADIO CORPORATION (8622 BEL AIR ROAD; small business) 50 employees, $0 revenue. : $637,821 in 8 contractsfrom 1999 to 2005
Contracts for Radio and Television Communication Equipment, Except Airborne, Other ADP and Telecommunications Services (includes data storage on tapes, compact disks, etc.), Other Professional Services, Maintenance, Repair and Rebuilding of Equipment -- Communication, Detection, and Coherent Radiation Equipment, and moreby Air Force, Department of Veterans Affairs, Navy Signed by year:2000: $0; 2001: $110,456; 2002: $180,232; 2003: $0; 2004: $88,728; 2005: $175,345; 2006: $0.
Biggest contracts:
$106,368 with Air Force for Radio and Television Communication Equipment, Except Airborne. Signed on 2005-10-01. Completion date: 2006-09-30.
$90,116 with Air Force for Other ADP and Telecommunications Services (includes data storage on tapes, compact disks, etc.). Signed on 2002-12-18. Completion date: 2003-09-30.
$90,116, same as above.Signed on 2002-12-18. Completion date: 2003-09-30.
$88,728 with Air Force for Other Professional Services. Taking place in DC. Signed on 2004-10-01. Completion date: 2005-09-30.
MARECO INC (4409 WYNN RD; small business)
$277,419 with Navy for Condiments and Related Products. Signed on 2000-12-27. Completion date: 2001-02-28.
NEW ACTON MOBILE INDUSTRIES LL (8007 CORPORATE DR STE A; small business) : $264,855 in 34 contractsfrom 2004 to 2006
Contracts for Trailers, Lease or Rental of Equipment -- Miscellaneous, Riveting Machines, Building Components, Prefabricated, and moreby Defense Logistics Agency, Pentagon Renovation Program Office, Bureau of Prisoners/Federal Prison System, National Park Service, and others Signed by year:2000: $0; 2001: $0; 2002: $0; 2003: $0; 2004: $199,992; 2005: $18,257; 2006: $46,606.
Biggest contracts:
$50,062 with Defense Logistics Agency for Trailers. Signed on 2004-10-29. Completion date: 2004-11-10.
$37,109 with Pentagon Renovation Program Office for Lease or Rental of Equipment -- Miscellaneous. Taking place in VA. Signed on 2004-04-28. Completion date: 2007-04-19.
$24,559 with Bureau of Prisoners/Federal Prison System for Riveting Machines. Signed on 2006-09-12. Completion date: 2006-09-12.
$20,599 with National Park Service for Building Components, Prefabricated. Taking place in NC. Signed on 2004-12-08. Completion date: 2005-12-08.
MACHINECRAFT, INC (7621 FITCH LN; small business) 500 employees, $0 revenue. : $224,909 in 10 contractsfrom 2001 to 2006
Contracts for Hardware, Commercial, Hardware, Weapon System, Cartridge and Propellant Actuated Devices and Components, Bushings, Rings, Shims, and Spacers, and moreby Navy, Defense Logistics Agency Signed by year:2000: $0; 2001: $97,069; 2002: $37,280; 2003: $43,509; 2004: $0; 2005: $21,257; 2006: $25,794.
Biggest contracts:
$57,919 with Navy for Hardware, Commercial. Signed on 2001-08-03. Completion date: 2002-08-03.
$39,150 with Defense Logistics Agency for Hardware, Weapon System. Signed on 2001-07-16. Completion date: 2001-11-13.
$37,280, same as above.Signed on 2002-02-08. Completion date: 2002-08-07.
$29,100 with Navy for Hardware, Commercial. Signed on 2003-03-27. Completion date: 2008-03-31.
IN THE COMPANY OF NURSES, INC (20 DUNNETT CT; small business) : $181,921 in 3 contractsin 2001
$137,000 with Centers for Medicare & Medicaid Services for Nursing Services. Signed on 2001-08-15. Completion date: 2002-08-15.
$44,921 with Defense Logistics Agency for Nursing Services. Signed on 2001-11-02. Completion date: 2002-09-30.
$0, same as above.Signed on 2001-11-02. Completion date: 2002-09-30.
RESCO ELECTRONICS (4961 MERCANTILE RD; small business) : $77,540 in 9 contractsfrom 2000 to 2006
Contracts for Coils and Transformers, Connectors, Electrical, Antennas, Waveguides, and Related Equipment, Resistors by Defense Logistics Agency, U.S. Coast Guard Signed by year:2000: $37,397; 2001: $0; 2002: $0; 2003: $0; 2004: $0; 2005: $288; 2006: $39,855.
Biggest contracts:
$37,397 with Defense Logistics Agency for Coils and Transformers. Taking place in NY. Signed on 2000-08-03. Completion date: 2000-11-16.
$15,604 with Defense Logistics Agency for Connectors, Electrical. Signed on 2006-05-12. Completion date: 2006-08-20.
$6,899 with Defense Logistics Agency for Antennas, Waveguides, and Related Equipment. Signed on 2006-06-09. Completion date: 2006-09-17.
$5,239 with Defense Logistics Agency for Connectors, Electrical. Taking place in FL. Signed on 2006-01-20. Completion date: 2006-04-19.
EAST COAST CONTRACTORS INC (7709 FITCH LANE; small business)
$65,700 with Navy for Other Defense -- Applied Research and Exploratory Development (R&D). Signed on 2001-10-01. Completion date: 2001-09-30.
Top industries in this zip code by the number of employees in 2005:
2002 - 2018 National Fire Incident Reporting System (NFIRS) incidents
Based on the data from the years 2002 - 2018 the average number of fire incidents per year is 86. The highest number of fires - 141 took place in 2002, and the least - 0 in 2003. The data has a dropping trend.
When looking into fire subcategories, the most incidents belonged to: Outside Fires (57.8%), and Mobile Property/Vehicle Fires (19.3%).
Fire incident types reported to NFIRS in Zip Code 21236

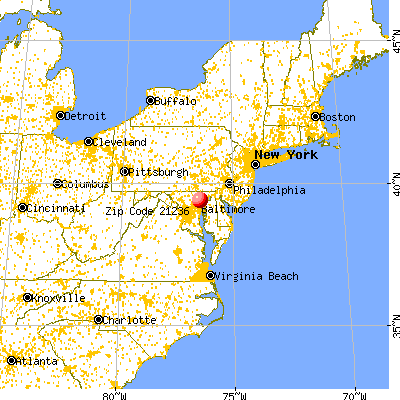


 Nearest zip codes: 21128, 21237, 21234, 21057, 21206, 21162.
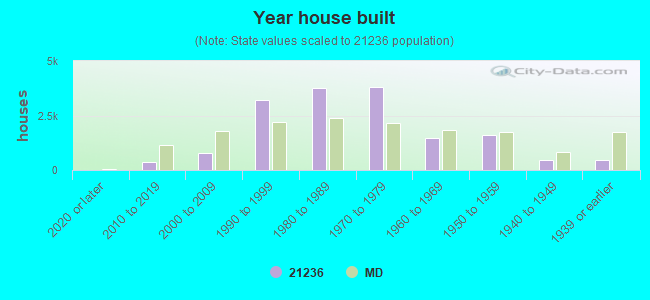


 Based on the data from the years 2002 - 2018 the average number of fire incidents per year is 86. The highest number of fires - 141 took place in 2002, and the least - 0 in 2003. The data has a dropping trend.
 When looking into fire subcategories, the most incidents belonged to: Outside Fires (57.8%), and Mobile Property/Vehicle Fires (19.3%).