Estimated zip code population in 2022: 1,145 Zip code population in 2010: 1,548 Zip code population in 2000: 1,549
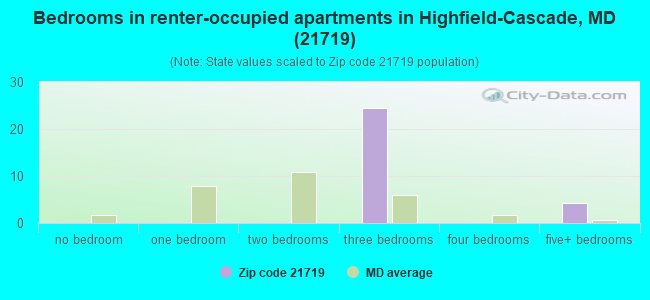
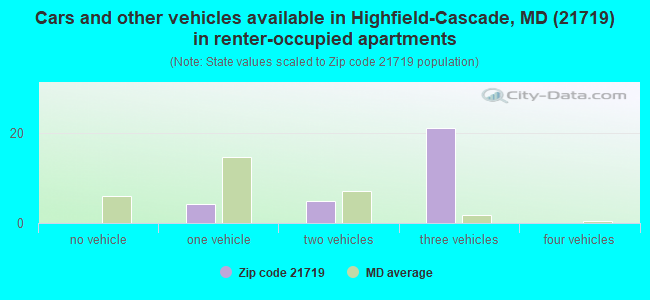
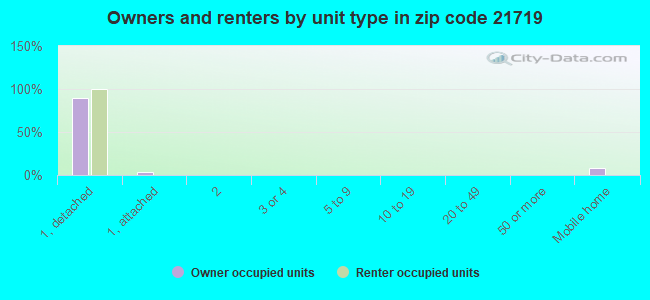
Houses and condos: 574 Renter-occupied apartments: 29
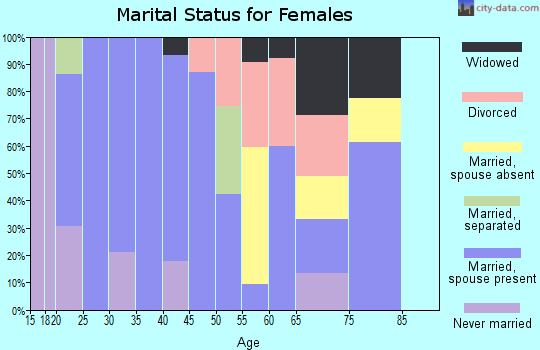
% of renters here:
7%
State:
32%
March 2022 cost of living index in zip code 21719: 129.7 (high, U.S. average is 100)
Land area: 3.4 sq. mi. Water area: 0.0 sq. mi.
Population density: 341 people per square mile
(very low).
OSM Map
General Map
Google Map
MSN Map
OSM Map
General Map
Google Map
MSN Map
OSM Map
General Map
Google Map
MSN Map
OSM Map
General Map
Google Map
MSN Map
Please wait while loading the map...
Real estate property taxes paid for housing units in 2022:
This zip code:
0.8% ($1,906)
Maryland:
0.9% ($3,777)
Median real estate property taxes paid for housing units with mortgages in 2022: $1,928 (0.7%) Median real estate property taxes paid for housing units with no mortgage in 2022: $1,868 (0.8%)
Averages for the 2020 tax year for zip code 21719, filed in 2021:
Average Adjusted Gross Income (AGI) in 2020: $56,090 (Individual Income Tax Returns)
Here:
$56,090
State:
$86,905
Salary/wage: $50,656 (reported on 83.9% of returns)
Here:
$50,656
State:
$73,953
(% of AGI for various income ranges: 1076.2% for AGIs below $25k, 3542.1% for AGIs $25k-50k, 6270.0% for AGIs $50k-75k, 10108.0% for AGIs $75k-100k, 18611.7% for AGIs $100k-200k)
Taxable interest for individuals: $200 (reported on 27.4% of returns)
This zip code:
$200
Maryland:
$1,528
(% of AGI for various income ranges: 1.5% for AGIs below $25k, 2.9% for AGIs $25k-50k, 25.0% for AGIs $50k-75k, 4.0% for AGIs $75k-100k, 18.3% for AGIs $100k-200k)
Ordinary dividends: $1,322 (reported on 14.5% of returns)
Here:
$1,322
State:
$8,028
(% of AGI for various income ranges: 13.1% for AGIs below $25k, 118.3% for AGIs $50k-75k, 51.7% for AGIs $100k-200k)
Net capital gain/loss in AGI: +$5,986 (reported on 11.3% of returns)
Here:
+$5,986
State:
+$25,238
(% of AGI for various income ranges: 100.0% for AGIs $50k-75k, 598.3% for AGIs $100k-200k)
Profit/loss from business: +$10,433 (reported on 14.5% of returns)
Here:
+$10,433
State:
+$11,398
(% of AGI for various income ranges: 106.9% for AGIs below $25k, 172.9% for AGIs $25k-50k, 138.3% for AGIs $50k-75k, 791.7% for AGIs $100k-200k)
Taxable individual retirement arrangement distribution: $9,775 (reported on 6.5% of returns)
21719:
$9,775
Maryland:
$20,944
(% of AGI for various income ranges: 651.7% for AGIs $50k-75k)
Total itemized deductions: $26,725 (reported on 6.5% of returns)
Here:
$26,725
State:
$30,672
(% of AGI for various income ranges: 389.3% for AGIs $25k-50k, 873.3% for AGIs $100k-200k)
Charity contributions: $4,333 (reported on 4.8% of returns)
Here:
$4,333
State:
$9,065
(% of AGI for various income ranges: 260.0% for AGIs $75k-100k)
Taxes paid: $8,325 (reported on 6.5% of returns)
21719:
$8,325
State:
$8,475
(% of AGI for various income ranges: 666.0% for AGIs $75k-100k)
Earned income credit: $2,178 (reported on 14.5% of returns)
Here:
$2,178
State:
$2,151
(% of AGI for various income ranges: 86.9% for AGIs below $25k, 59.3% for AGIs $25k-50k)
Percentage of individuals using paid preparers for their 2020 taxes: 95.2%
Here:
95%
State:
90%
(% for various income ranges: 89.5% for AGIs below $25k, 94.4% for AGIs $25k-50k, 100.0% for AGIs $50k-75k, 100.0% for AGIs $75k-100k, 100.0% for AGIs $100k-200k)
Averages for the 2012 tax year for zip code 21719, filed in 2013:
Average Adjusted Gross Income (AGI) in 2012: $44,785 (Individual Income Tax Returns)
Here:
$44,785
State:
$72,703
Salary/wage: $42,333 (reported on 85.9% of returns)
Here:
$42,333
State:
$62,228
(% of AGI for various income ranges: 75.1% for AGIs below $25k, 81.6% for AGIs $25k-50k, 85.6% for AGIs $50k-75k, 86.1% for AGIs $75k-100k, 75.1% for AGIs $100k-200k)
Taxable interest for individuals: $328 (reported on 25.4% of returns)
This zip code:
$328
Maryland:
$1,413
(% of AGI for various income ranges: 0.2% for AGIs below $25k, 0.3% for AGIs $25k-50k, 0.2% for AGIs $75k-100k, 0.1% for AGIs $100k-200k)
Ordinary dividends: $1,088 (reported on 11.3% of returns)
Here:
$1,088
State:
$6,933
(% of AGI for various income ranges: 0.5% for AGIs $25k-50k, 0.6% for AGIs $75k-100k)
Net capital gain/loss in AGI: +$1,550 (reported on 5.6% of returns)
Here:
+$1,550
State:
+$14,830
Profit/loss from business: +$5,938 (reported on 11.3% of returns)
Here:
+$5,938
State:
+$12,606
(% of AGI for various income ranges: 7.1% for AGIs below $25k, 2.2% for AGIs $25k-50k, 1.0% for AGIs $75k-100k)
Taxable individual retirement arrangement distribution: $7,175 (reported on 5.6% of returns)
21719:
$7,175
Maryland:
$17,065
Total itemized deductions: $18,130 (23% of AGI, reported on 32.4% of returns)
Here:
$18,130
State:
$27,886
Here:
22.5% of AGI
State:
22.8% of AGI
(% of AGI for various income ranges: 10.2% for AGIs $25k-50k, 12.6% for AGIs $50k-75k, 19.4% for AGIs $75k-100k, 15.4% for AGIs $100k-200k)
Charity contributions: $2,406 (reported on 22.5% of returns)
Here:
$2,406
State:
$4,452
(% of AGI for various income ranges: 1.3% for AGIs below $25k, 0.6% for AGIs $50k-75k, 1.9% for AGIs $75k-100k, 1.9% for AGIs $100k-200k)
Taxes paid: $7,226 (reported on 32.4% of returns)
21719:
$7,226
State:
$11,690
(% of AGI for various income ranges: 2.5% for AGIs $25k-50k, 4.6% for AGIs $50k-75k, 7.3% for AGIs $75k-100k, 8.3% for AGIs $100k-200k)
Earned income credit: $2,131 (reported on 18.3% of returns)
Here:
$2,131
State:
$2,199
(% of AGI for various income ranges: 5.9% for AGIs below $25k, 1.1% for AGIs $25k-50k)
Percentage of individuals using paid preparers for their 2012 taxes: 45.1%
Here:
45%
State:
52%
(% for various income ranges: 44.4% for AGIs below $25k, 42.1% for AGIs $25k-50k, 40.0% for AGIs $50k-75k, 55.6% for AGIs $75k-100k, 50.0% for AGIs $100k-200k)
Averages for the 2004 tax year for zip code 21719, filed in 2005:
Average Adjusted Gross Income (AGI) in 2004: $38,173 (Individual Income Tax Returns)
Here:
$38,173
State:
$60,339
Salary/wage: $35,823 (reported on 89.4% of returns)
Here:
$35,823
State:
$52,211
(% of AGI for various income ranges: 120.5% for AGIs below $10k, 82.1% for AGIs $10k-25k, 85.4% for AGIs $25k-50k, 88.4% for AGIs $50k-75k, 90.6% for AGIs $75k-100k, 63.2% for AGIs over 100k)
Taxable interest for individuals: $682 (reported on 36.3% of returns)
This zip code:
$682
Maryland:
$1,701
(% of AGI for various income ranges: 0.6% for AGIs below $10k, 1.9% for AGIs $10k-25k, 1.2% for AGIs $25k-50k, 0.2% for AGIs $50k-75k, 0.1% for AGIs $75k-100k, 0.3% for AGIs over 100k)
Taxable dividends: $1,474 (reported on 12.6% of returns)
Here:
$1,474
State:
$4,235
(% of AGI for various income ranges: 1.2% for AGIs $10k-25k, 0.2% for AGIs $25k-50k, 0.1% for AGIs $50k-75k, 0.2% for AGIs $75k-100k, 1.4% for AGIs over 100k)
Net capital gain/loss: +$11,132 (reported on 6.9% of returns)
Here:
+$11,132
State:
+$15,888
(% of AGI for various income ranges: -1.3% for AGIs below $10k, -0.1% for AGIs $25k-50k, 0.6% for AGIs $50k-75k, 12.0% for AGIs over 100k)
Profit/loss from business: +$6,682 (reported on 11.4% of returns)
Here:
+$6,682
State:
+$12,221
(% of AGI for various income ranges: 8.7% for AGIs below $10k, 4.3% for AGIs $10k-25k, 3.0% for AGIs $25k-50k, 1.3% for AGIs $50k-75k, 1.1% for AGIs $75k-100k)
IRA payment deduction: $2,071 (reported on 1.8% of returns)
21719:
$2,071
Maryland:
$2,968
Total itemized deductions: $15,812 (24% of AGI, reported on 32.4% of returns)
Here:
$15,812
State:
$22,960
Here:
23.7% of AGI
State:
23.3% of AGI
(% of AGI for various income ranges: 7.9% for AGIs $10k-25k, 9.2% for AGIs $25k-50k, 16.3% for AGIs $50k-75k, 17.9% for AGIs $75k-100k, 16.6% for AGIs over 100k)
Charity contributions deductions: $2,218 (3% of AGI, reported on 25.0% of returns)
Here:
$2,218
State:
$4,031
Here:
3.1% of AGI
State:
3.9% of AGI
(% of AGI for various income ranges: 0.3% for AGIs $10k-25k, 0.9% for AGIs $25k-50k, 1.4% for AGIs $50k-75k, 1.4% for AGIs $75k-100k, 3.5% for AGIs over 100k)
Total tax: $4,348 (reported on 75.6% of returns)
21719:
$4,348
State:
$10,167
(% of AGI for various income ranges: 2.7% for AGIs below $10k, 4.3% for AGIs $10k-25k, 6.9% for AGIs $25k-50k, 8.4% for AGIs $50k-75k, 9.9% for AGIs $75k-100k, 14.3% for AGIs over 100k)
Earned income credit: $1,680 (reported on 15.8% of returns)
Here:
$1,680
State:
$1,700
Percentage of individuals using paid preparers for their 2004 taxes: 54.7%
Here:
55%
State:
55%
(% for various income ranges: 35.8% for AGIs below $10k, 54.7% for AGIs $10k-25k, 58.7% for AGIs $25k-50k, 67.7% for AGIs $50k-75k, 51.7% for AGIs $75k-100k, 60.6% for AGIs over 100k)
Size of family households: 129 2-persons, 80 3-persons, 28 4-persons, 10 5-persons, 18 6-persons, 18 7-or-more-persons
Size of nonfamily households: 132 1-person, 10 2-persons, 1 3-persons
213 married couples with children.
21 single-parent households (21 men).
95.0% of residents of 21719 zip code speak English at home.
2.0% of residents speak Spanish at home (100% very well).
1.1% of residents speak other Indo-European language at home (100% very well).
0.6% of residents speak Asian or Pacific Island language at home (50% very well, 50% well).
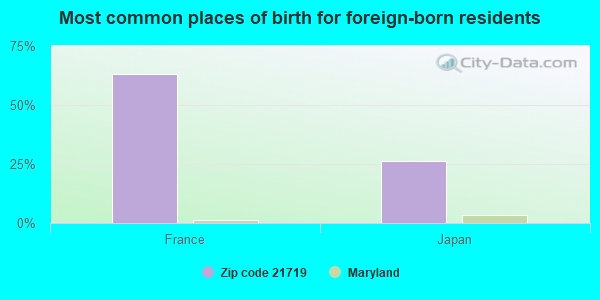
Foreign born population: 19 (1.7%) (100.0% of them are naturalized citizens)
This zip code:
1.7%
Whole state:
16.7%
63%France
26%Japan
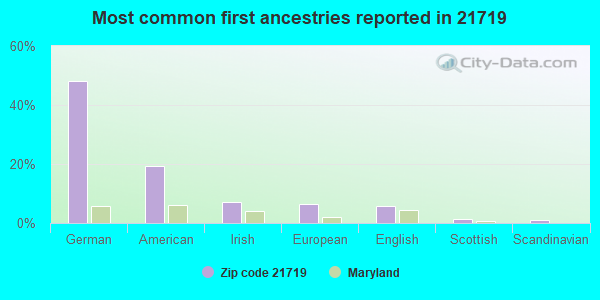
48%German
19%American
7%Irish
7%European
6%English
1%Scottish
1%Scandinavian
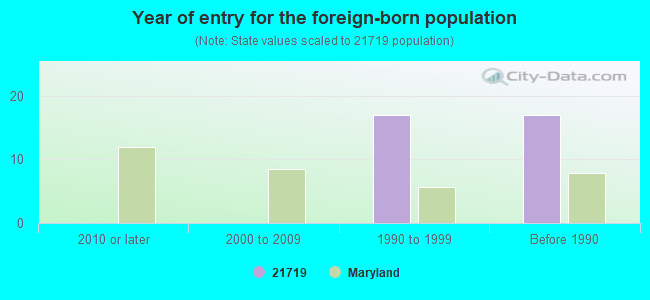
Year of entry for the foreign-born population
02010 or later
02000 to 2009
171990 to 1999
17Before 1990
Facilities with environmental interests located in this zip code:
CASCADE ELEMENTARY SCHOOL (14519 PENNERSVILLE ROAD in CASCADE, MD)
AIR MINOR (AIRS/AFS) (Geographic Names Information System) STATE MASTER (Maryland Air Emissions Database) - AIR MINOR (National Center for Education Statistics) - STATE ID-211401 Business SIC classification: ELEMENTARY AND SECONDARY SCHOOLS Organizations: WASHINGTON COUNTY BOARD OF EDUCATION (SCHOOL DISTRICT)
MARYLAND ARMY NATIONAL GUARD (25510 WARREN AVE HIGHFIELD ARMORY in CASCADE, MD)
Small Quantity Generators, between 100 kg and 1000 kg of hazardous waste/month (Resource Conservation and Recovery Act (tracking hazardous waste)) - notification Organizations: MARYLAND MILITARY DEPT (CONTACT/OWNER)
Housing units lacking complete plumbing facilities: 1.4% Housing units lacking complete kitchen facilities: 1.5%
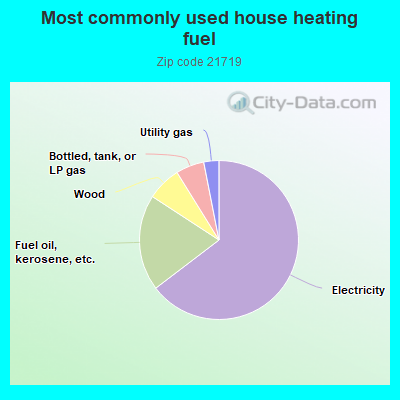
65.1%Electricity
19.7%Fuel oil, kerosene, etc.
7.0%Wood
5.8%Bottled, tank, or LP gas
3.1%Utility gas
Population in 1990: 2,672.
Place of birth for U.S.-born residents:
This state: 621
Northeast: 285
Midwest: 47
South: 138
61% of the 21719 zip code residents lived in the same house 5 years ago. Out of people who lived in different houses, 35% lived in this county. Out of people who lived in different counties, 50% lived in Maryland.
98% of the 21719 zip code residents lived in the same house 1 year ago. Out of people who lived in different houses, 105% moved from this county. Out of people who lived in different houses, 16% moved from different county within same state.
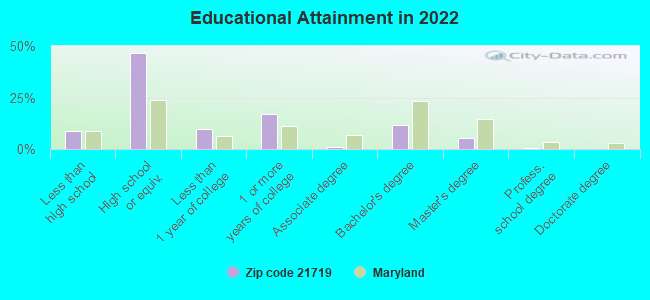
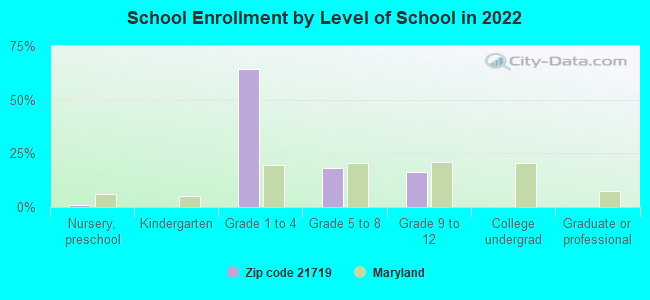
Private vs. public school enrollment:
Students in private schools in grades 1 to 8 (elementary and middle school): 8
Here:
5.3%
Maryland:
15.2%
Students in private schools in grades 9 to 12 (high school):
Here:
0.0%
Maryland:
14.4%
Students in private undergraduate colleges:
Here:
0.0%
Maryland:
20.2%
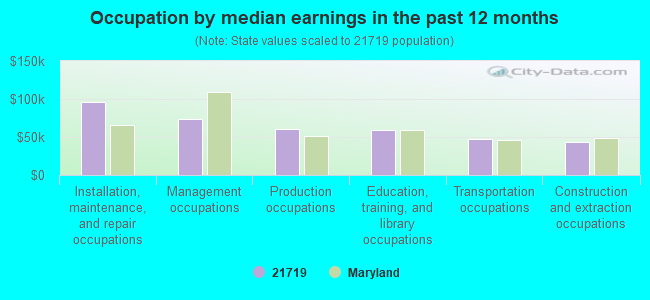
Occupation by median earnings in the past 12 months ($)
96,624Installation, maintenance, and repair occupations
73,514Management occupations
60,329Production occupations
59,746Education, training, and library occupations
47,058Transportation occupations
43,124Construction and extraction occupations
Companies with federal contracts located in this zip code:
BLUE RIDGE OFFICIALS ASSOCIATI (14529 PENNERSVILLE ROAD in CASCADE, MD; small business) : $4,400 in 4 contractsfrom 2004 to 2005
$5,500 with Army for Recreational Services. Signed on 2004-08-31. Completion date: 2004-12-01.
$0, same as above.Signed on 2004-06-14. Completion date: 2003-12-01.
-$330, same as above.Signed on 2004-06-14. Completion date: 2003-12-01.
-$770, same as above.Signed on 2005-06-16. Completion date: 2004-12-01.
Top industries in this zip code by the number of employees in 2005:
Other Services (except Public Administration): Religious Organizations (20-49 employees: 1 establishment, 1-4 employees: 2 establishments)
Other Services (except Public Administration): Civic and Social Organizations (10-19: 2)
Accommodation and Food Services: Recreational and Vacation Camps (except Campgrounds) (10-19: 1)
Construction: New Single-Family Housing Construction (except Operative Builders) (5-9: 1)
Wholesale Trade: Other Miscellaneous Durable Goods Merchant Wholesalers (1-4: 1)
Construction: Painting and Wall Covering Contractors (1-4: 1)
Accommodation and Food Services: Drinking Places (Alcoholic Beverages) (1-4: 1)
Fatal accident statistics in 2013:
Fatal accident count: 2
Vehicles involved in fatal accidents: 3
Fatal accidents caused by drunken drivers: 1
Fatalities: 2
Persons involved in fatal accidents: 3
Pedestrians involved in fatal accidents: 0
Home Mortgage Disclosure Act Aggregated Statistics For Year 2009 (Based on 4 partial tracts)
A) FHA, FSA/RHS & VA Home Purchase Loans
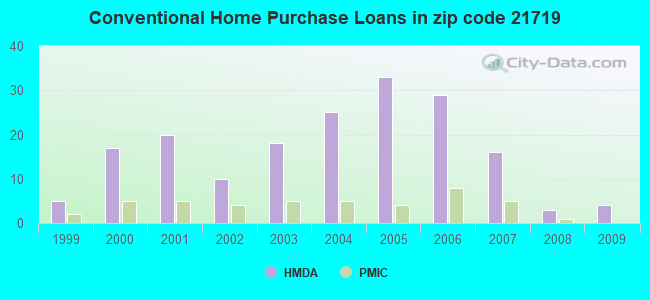
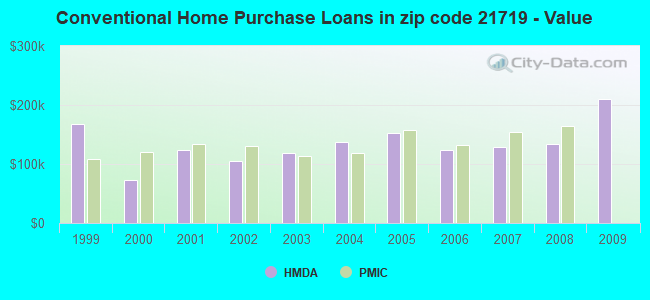
B) Conventional Home Purchase Loans
C) Refinancings
D) Home Improvement Loans
F) Non-occupant Loans on < 5 Family Dwellings (A B C & D)
Number
Average Value
Number
Average Value
Number
Average Value
Number
Average Value
Number
Average Value
LOANS ORIGINATED
9
$148,059
4
$210,270
27
$181,999
3
$11,797
0
$0
APPLICATIONS APPROVED, NOT ACCEPTED
0
$0
0
$0
3
$228,460
0
$0
0
$0
APPLICATIONS DENIED
0
$0
1
$131,540
7
$130,767
1
$69,680
0
$0
APPLICATIONS WITHDRAWN
0
$0
0
$0
8
$239,090
0
$0
0
$0
FILES CLOSED FOR INCOMPLETENESS
0
$0
0
$0
3
$155,253
0
$0
1
$232,540
Aggregated Statistics For Year 2008 (Based on 4 partial tracts)
A) FHA, FSA/RHS & VA Home Purchase Loans
B) Conventional Home Purchase Loans
C) Refinancings
D) Home Improvement Loans
F) Non-occupant Loans on < 5 Family Dwellings (A B C & D)
Number
Average Value
Number
Average Value
Number
Average Value
Number
Average Value
Number
Average Value
LOANS ORIGINATED
3
$147,030
3
$133,623
38
$175,507
5
$93,070
4
$112,745
APPLICATIONS APPROVED, NOT ACCEPTED
0
$0
0
$0
3
$151,467
0
$0
0
$0
APPLICATIONS DENIED
0
$0
1
$215,960
19
$156,915
9
$70,062
0
$0
APPLICATIONS WITHDRAWN
0
$0
3
$131,467
5
$203,852
1
$5,240
0
$0
FILES CLOSED FOR INCOMPLETENESS
0
$0
0
$0
1
$306,380
0
$0
1
$308,490
Aggregated Statistics For Year 2007 (Based on 4 partial tracts)
B) Conventional Home Purchase Loans
C) Refinancings
D) Home Improvement Loans
F) Non-occupant Loans on < 5 Family Dwellings (A B C & D)
Number
Average Value
Number
Average Value
Number
Average Value
Number
Average Value
LOANS ORIGINATED
16
$128,316
39
$182,198
7
$77,391
3
$191,743
APPLICATIONS APPROVED, NOT ACCEPTED
0
$0
5
$196,760
0
$0
0
$0
APPLICATIONS DENIED
1
$56,790
28
$182,155
8
$121,156
0
$0
APPLICATIONS WITHDRAWN
3
$141,260
24
$175,350
1
$66,760
0
$0
FILES CLOSED FOR INCOMPLETENESS
0
$0
5
$222,558
0
$0
0
$0
Aggregated Statistics For Year 2006 (Based on 4 partial tracts)
A) FHA, FSA/RHS & VA Home Purchase Loans
B) Conventional Home Purchase Loans
C) Refinancings
D) Home Improvement Loans
F) Non-occupant Loans on < 5 Family Dwellings (A B C & D)
Number
Average Value
Number
Average Value
Number
Average Value
Number
Average Value
Number
Average Value
LOANS ORIGINATED
5
$202,738
29
$124,007
66
$170,606
19
$77,688
4
$105,988
APPLICATIONS APPROVED, NOT ACCEPTED
0
$0
5
$119,926
8
$152,431
4
$29,338
0
$0
APPLICATIONS DENIED
1
$211,730
5
$151,706
30
$186,655
4
$104,878
0
$0
APPLICATIONS WITHDRAWN
0
$0
4
$101,765
25
$159,416
1
$278,480
0
$0
FILES CLOSED FOR INCOMPLETENESS
0
$0
3
$87,630
22
$208,427
0
$0
0
$0
Aggregated Statistics For Year 2005 (Based on 4 partial tracts)
A) FHA, FSA/RHS & VA Home Purchase Loans
B) Conventional Home Purchase Loans
C) Refinancings
D) Home Improvement Loans
F) Non-occupant Loans on < 5 Family Dwellings (A B C & D)
Number
Average Value
Number
Average Value
Number
Average Value
Number
Average Value
Number
Average Value
LOANS ORIGINATED
4
$154,700
33
$152,900
61
$144,397
8
$122,331
4
$246,820
APPLICATIONS APPROVED, NOT ACCEPTED
0
$0
1
$59,750
8
$138,525
4
$25,275
1
$53,440
APPLICATIONS DENIED
0
$0
7
$127,183
21
$119,841
7
$58,371
1
$5,010
APPLICATIONS WITHDRAWN
0
$0
1
$221,030
34
$151,091
3
$84,877
1
$204,750
FILES CLOSED FOR INCOMPLETENESS
0
$0
0
$0
9
$139,010
1
$53,870
0
$0
Aggregated Statistics For Year 2004 (Based on 4 partial tracts)
A) FHA, FSA/RHS & VA Home Purchase Loans
B) Conventional Home Purchase Loans
C) Refinancings
D) Home Improvement Loans
E) Loans on Dwellings For 5+ Families
F) Non-occupant Loans on < 5 Family Dwellings (A B C & D)
G) Loans On Manufactured Home Dwelling (A B C & D)
Number
Average Value
Number
Average Value
Number
Average Value
Number
Average Value
Number
Average Value
Number
Average Value
Number
Average Value
LOANS ORIGINATED
7
$124,281
25
$136,506
57
$144,834
4
$39,640
1
$378,370
1
$132,290
0
$0
APPLICATIONS APPROVED, NOT ACCEPTED
0
$0
3
$65,517
9
$107,162
4
$37,832
0
$0
0
$0
0
$0
APPLICATIONS DENIED
0
$0
5
$131,332
46
$111,410
7
$42,697
0
$0
1
$177,770
3
$104,190
APPLICATIONS WITHDRAWN
0
$0
5
$139,456
50
$130,131
4
$112,432
0
$0
3
$60,433
0
$0
FILES CLOSED FOR INCOMPLETENESS
0
$0
1
$49,580
5
$157,440
0
$0
0
$0
0
$0
0
$0
Aggregated Statistics For Year 2003 (Based on 4 partial tracts)
A) FHA, FSA/RHS & VA Home Purchase Loans
B) Conventional Home Purchase Loans
C) Refinancings
D) Home Improvement Loans
F) Non-occupant Loans on < 5 Family Dwellings (A B C & D)
Number
Average Value
Number
Average Value
Number
Average Value
Number
Average Value
Number
Average Value
LOANS ORIGINATED
5
$162,454
18
$118,887
78
$124,766
4
$27,468
3
$140,127
APPLICATIONS APPROVED, NOT ACCEPTED
0
$0
4
$102,670
17
$107,396
3
$54,740
0
$0
APPLICATIONS DENIED
0
$0
7
$90,917
45
$92,979
7
$7,083
4
$96,275
APPLICATIONS WITHDRAWN
0
$0
1
$117,220
49
$114,410
1
$78,830
1
$94,590
FILES CLOSED FOR INCOMPLETENESS
0
$0
0
$0
1
$146,470
0
$0
0
$0
Aggregated Statistics For Year 2002 (Based on 4 partial tracts)
A) FHA, FSA/RHS & VA Home Purchase Loans
B) Conventional Home Purchase Loans
C) Refinancings
D) Home Improvement Loans
F) Non-occupant Loans on < 5 Family Dwellings (A B C & D)
Number
Average Value
Number
Average Value
Number
Average Value
Number
Average Value
Number
Average Value
LOANS ORIGINATED
4
$122,562
10
$104,707
61
$106,049
4
$38,810
3
$89,170
APPLICATIONS APPROVED, NOT ACCEPTED
1
$123,500
1
$179,750
11
$97,249
1
$21,090
0
$0
APPLICATIONS DENIED
0
$0
4
$61,358
25
$107,597
4
$17,480
3
$111,583
APPLICATIONS WITHDRAWN
0
$0
0
$0
17
$111,233
0
$0
0
$0
FILES CLOSED FOR INCOMPLETENESS
0
$0
1
$57,760
1
$119,730
0
$0
1
$115,610
Aggregated Statistics For Year 2001 (Based on 4 partial tracts)
A) FHA, FSA/RHS & VA Home Purchase Loans
B) Conventional Home Purchase Loans
C) Refinancings
D) Home Improvement Loans
F) Non-occupant Loans on < 5 Family Dwellings (A B C & D)
Number
Average Value
Number
Average Value
Number
Average Value
Number
Average Value
Number
Average Value
LOANS ORIGINATED
8
$105,084
20
$123,898
31
$97,622
11
$22,007
4
$126,188
APPLICATIONS APPROVED, NOT ACCEPTED
0
$0
1
$159,190
7
$103,471
0
$0
0
$0
APPLICATIONS DENIED
0
$0
12
$47,180
29
$78,071
3
$13,563
3
$73,573
APPLICATIONS WITHDRAWN
0
$0
1
$86,840
26
$119,273
4
$29,702
1
$84,080
FILES CLOSED FOR INCOMPLETENESS
0
$0
0
$0
3
$190,640
0
$0
1
$411,220
Aggregated Statistics For Year 2000 (Based on 4 partial tracts)
A) FHA, FSA/RHS & VA Home Purchase Loans
B) Conventional Home Purchase Loans
C) Refinancings
D) Home Improvement Loans
F) Non-occupant Loans on < 5 Family Dwellings (A B C & D)
Number
Average Value
Number
Average Value
Number
Average Value
Number
Average Value
Number
Average Value
LOANS ORIGINATED
12
$111,905
17
$73,163
27
$82,254
8
$21,579
1
$77,090
APPLICATIONS APPROVED, NOT ACCEPTED
0
$0
1
$121,600
5
$101,862
1
$6,730
0
$0
APPLICATIONS DENIED
1
$178,680
3
$37,473
23
$76,729
7
$29,317
1
$7,880
APPLICATIONS WITHDRAWN
1
$139,260
0
$0
12
$69,625
1
$39,410
0
$0
FILES CLOSED FOR INCOMPLETENESS
1
$177,360
0
$0
3
$52,720
1
$15,770
0
$0
Aggregated Statistics For Year 1999 (Based on 2 partial tracts)
A) FHA, FSA/RHS & VA Home Purchase Loans
B) Conventional Home Purchase Loans
C) Refinancings
D) Home Improvement Loans
F) Non-occupant Loans on < 5 Family Dwellings (A B C & D)
Detailed PMIC statistics for the following Tracts:0101.00
, 7529.00
2002 - 2018 National Fire Incident Reporting System (NFIRS) incidents
Based on the data from the years 2002 - 2018 the average number of fire incidents per year is 8. The highest number of reported fires - 20 took place in 2007, and the least - 3 in 2015. The data has a constant trend.
When looking into fire subcategories, the most reports belonged to: Structure Fires (56.5%), and Outside Fires (33.3%).
Fire incident types reported to NFIRS in Zip Code 21719
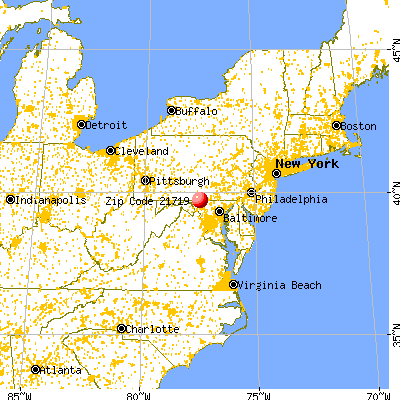


 Nearest zip codes: 21780, 17250, 17214, 21783, 17268, 17320.
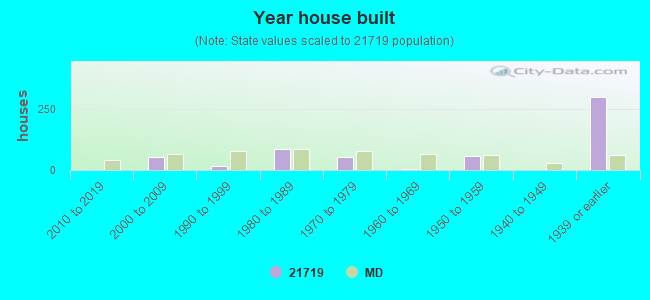


 Based on the data from the years 2002 - 2018 the average number of fire incidents per year is 8. The highest number of reported fires - 20 took place in 2007, and the least - 3 in 2015. The data has a constant trend.
 When looking into fire subcategories, the most reports belonged to: Structure Fires (56.5%), and Outside Fires (33.3%).