Estimated zip code population in 2022: 26,020 Zip code population in 2010: 24,302 Zip code population in 2000: 22,815
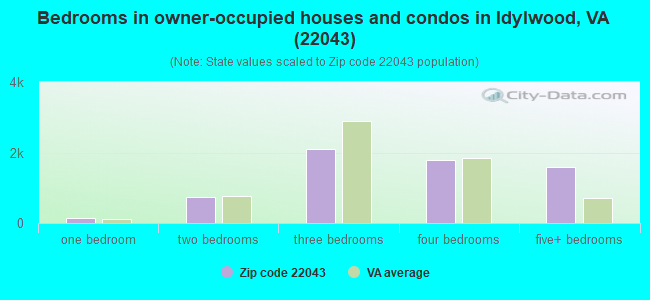
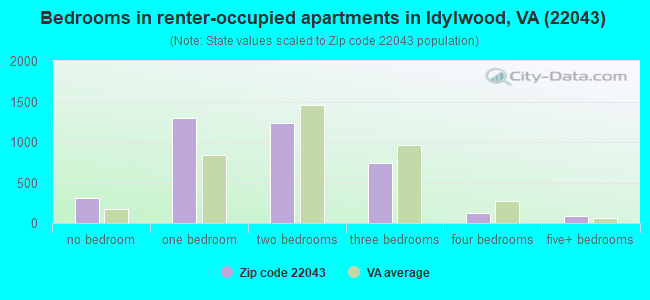
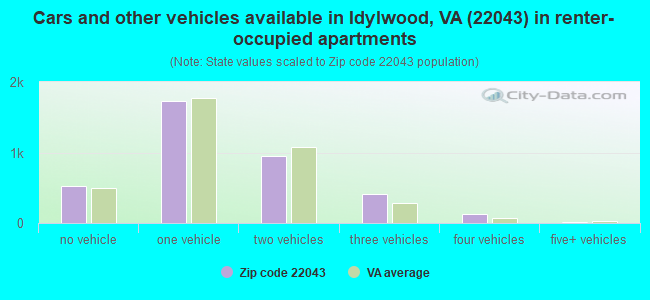
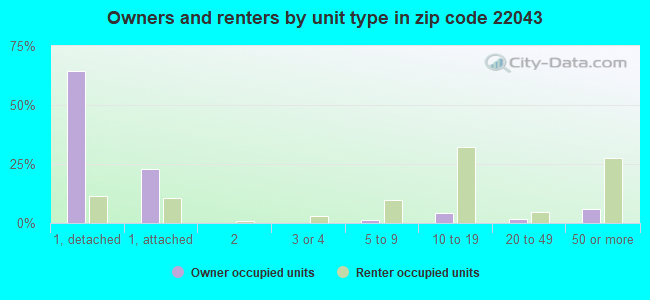
Houses and condos: 10,587 Renter-occupied apartments: 3,746
% of renters here:
37%
State:
33%
March 2022 cost of living index in zip code 22043: 168.5 (very high, U.S. average is 100)
Land area: 4.8 sq. mi. Water area: 0.0 sq. mi.
Population density: 5,457 people per square mile
(average).
OSM Map
General Map
Google Map
MSN Map
OSM Map
General Map
Google Map
MSN Map
OSM Map
General Map
Google Map
MSN Map
OSM Map
General Map
Google Map
MSN Map
Please wait while loading the map...
Real estate property taxes paid for housing units in 2022:
This zip code:
1.0% ($8,755)
Virginia:
0.7% ($2,617)
Median real estate property taxes paid for housing units with mortgages in 2022: $8,777 (1.0%) Median real estate property taxes paid for housing units with no mortgage in 2022: $8,939 (1.0%)
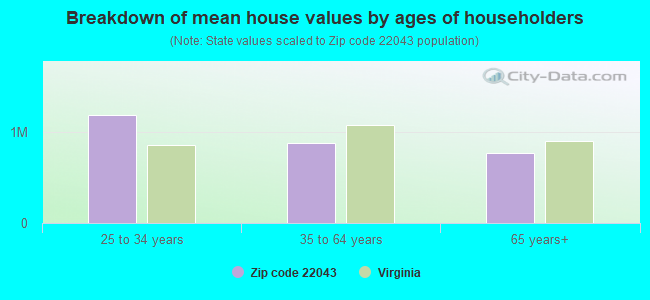
Estimated median house/condo value in 2022: $897,999
22043:
$897,999
Virginia:
$365,700
According to our research of Virginia and other state lists, there were 11 registered sex offenders living in 22043 zip code as of April 26, 2024. The ratio of all residents to sex offenders in zip code 22043 is 2,378 to 1. The ratio of registered sex offenders to all residents in this zip code is much lower than the state average.
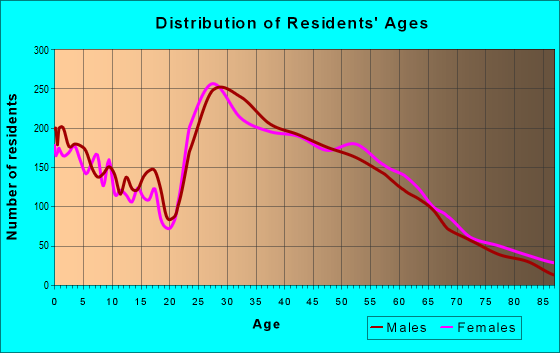
Median resident age:
This zip code:
38.1 years
Virginia median age:
39.0 years
Average household size:
This zip code:
2.6 people
Virginia:
2.5 people
Averages for the 2020 tax year for zip code 22043, filed in 2021:
Average Adjusted Gross Income (AGI) in 2020: $159,195 (Individual Income Tax Returns)
Here:
$159,195
State:
$86,446
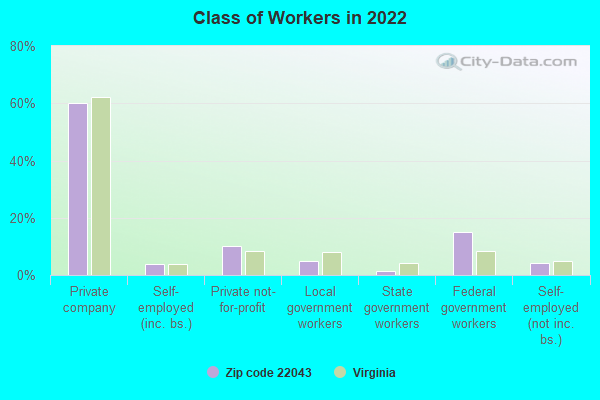
Salary/wage: $118,395 (reported on 82.6% of returns)
Here:
$118,395
State:
$71,185
(% of AGI for various income ranges: 1253.5% for AGIs below $25k, 3865.2% for AGIs $25k-50k, 7086.7% for AGIs $50k-75k, 9857.6% for AGIs $75k-100k, 19614.3% for AGIs $100k-200k, 89793.6% for AGIs over 200k)
Taxable interest for individuals: $1,870 (reported on 46.1% of returns)
This zip code:
$1,870
Virginia:
$1,805
(% of AGI for various income ranges: 24.5% for AGIs below $25k, 32.3% for AGIs $25k-50k, 51.9% for AGIs $50k-75k, 102.3% for AGIs $75k-100k, 177.0% for AGIs $100k-200k, 756.0% for AGIs over 200k)
Ordinary dividends: $8,048 (reported on 36.8% of returns)
Here:
$8,048
State:
$8,327
(% of AGI for various income ranges: 39.3% for AGIs below $25k, 51.9% for AGIs $25k-50k, 112.0% for AGIs $50k-75k, 205.1% for AGIs $75k-100k, 542.4% for AGIs $100k-200k, 3177.9% for AGIs over 200k)
Net capital gain/loss in AGI: +$24,855 (reported on 34.5% of returns)
Here:
+$24,855
State:
+$24,644
(% of AGI for various income ranges: 29.4% for AGIs below $25k, 44.7% for AGIs $25k-50k, 91.3% for AGIs $50k-75k, 217.3% for AGIs $75k-100k, 767.8% for AGIs $100k-200k, 11820.5% for AGIs over 200k)
Profit/loss from business: +$20,007 (reported on 20.7% of returns)
Here:
+$20,007
State:
+$12,836
(% of AGI for various income ranges: 296.2% for AGIs below $25k, 317.8% for AGIs $25k-50k, 332.0% for AGIs $50k-75k, 247.6% for AGIs $75k-100k, 605.8% for AGIs $100k-200k, 3556.4% for AGIs over 200k)
Taxable individual retirement arrangement distribution: $26,760 (reported on 7.4% of returns)
22043:
$26,760
Virginia:
$21,535
(% of AGI for various income ranges: 32.9% for AGIs below $25k, 46.0% for AGIs $25k-50k, 115.2% for AGIs $50k-75k, 291.0% for AGIs $75k-100k, 524.9% for AGIs $100k-200k, 1552.1% for AGIs over 200k)
Self-employed (Keogh) retirement plans: $37,384 (reported on 2.1% of returns)
22043:
$37,384
Virginia:
$31,172
(% of AGI for various income ranges: 15.9% for AGIs $25k-50k, 59.9% for AGIs $100k-200k, 1102.5% for AGIs over 200k)
Total itemized deductions: $33,398 (reported on 25.5% of returns)
Here:
$33,398
State:
$33,287
(% of AGI for various income ranges: 122.5% for AGIs below $25k, 276.2% for AGIs $25k-50k, 556.2% for AGIs $50k-75k, 830.4% for AGIs $75k-100k, 1884.0% for AGIs $100k-200k, 7658.7% for AGIs over 200k)
Charity contributions: $7,607 (reported on 20.9% of returns)
Here:
$7,607
State:
$10,381
(% of AGI for various income ranges: 6.7% for AGIs below $25k, 25.8% for AGIs $25k-50k, 62.2% for AGIs $50k-75k, 110.6% for AGIs $75k-100k, 283.4% for AGIs $100k-200k, 1750.8% for AGIs over 200k)
Taxes paid: $9,225 (reported on 25.4% of returns)
22043:
$9,225
State:
$8,284
(% of AGI for various income ranges: 24.4% for AGIs below $25k, 65.1% for AGIs $25k-50k, 155.4% for AGIs $50k-75k, 276.3% for AGIs $75k-100k, 624.5% for AGIs $100k-200k, 1894.3% for AGIs over 200k)
Earned income credit: $1,947 (reported on 7.5% of returns)
Here:
$1,947
State:
$2,214
(% of AGI for various income ranges: 65.3% for AGIs below $25k, 48.6% for AGIs $25k-50k)
Percentage of individuals using paid preparers for their 2020 taxes: 90.1%
Here:
90%
State:
92%
(% for various income ranges: 86.1% for AGIs below $25k, 89.8% for AGIs $25k-50k, 91.8% for AGIs $50k-75k, 89.8% for AGIs $75k-100k, 90.5% for AGIs $100k-200k, 93.9% for AGIs over 200k)
Averages for the 2012 tax year for zip code 22043, filed in 2013:
Average Adjusted Gross Income (AGI) in 2012: $95,184 (Individual Income Tax Returns)
Here:
$95,184
State:
$71,192
Salary/wage: $85,592 (reported on 85.5% of returns)
Here:
$85,592
State:
$59,229
(% of AGI for various income ranges: 78.2% for AGIs below $25k, 84.9% for AGIs $25k-50k, 81.7% for AGIs $50k-75k, 79.5% for AGIs $75k-100k, 80.2% for AGIs $100k-200k, 71.2% for AGIs over 200k)
Taxable interest for individuals: $1,367 (reported on 46.4% of returns)
This zip code:
$1,367
Virginia:
$1,600
(% of AGI for various income ranges: 1.1% for AGIs below $25k, 0.6% for AGIs $25k-50k, 0.6% for AGIs $50k-75k, 0.8% for AGIs $75k-100k, 0.6% for AGIs $100k-200k, 0.7% for AGIs over 200k)
Ordinary dividends: $6,232 (reported on 31.4% of returns)
Here:
$6,232
State:
$6,959
(% of AGI for various income ranges: 1.9% for AGIs below $25k, 1.0% for AGIs $25k-50k, 1.3% for AGIs $50k-75k, 1.1% for AGIs $75k-100k, 1.9% for AGIs $100k-200k, 2.7% for AGIs over 200k)
Net capital gain/loss in AGI: +$7,439 (reported on 25.7% of returns)
Here:
+$7,439
State:
+$16,672
(% of AGI for various income ranges: 0.3% for AGIs $25k-50k, 0.4% for AGIs $50k-75k, 0.6% for AGIs $75k-100k, 1.1% for AGIs $100k-200k, 3.8% for AGIs over 200k)
Profit/loss from business: +$24,565 (reported on 17.6% of returns)
Here:
+$24,565
State:
+$14,116
(% of AGI for various income ranges: 12.8% for AGIs below $25k, 5.8% for AGIs $25k-50k, 3.5% for AGIs $50k-75k, 3.7% for AGIs $75k-100k, 3.8% for AGIs $100k-200k, 4.6% for AGIs over 200k)
Taxable individual retirement arrangement distribution: $17,653 (reported on 8.3% of returns)
22043:
$17,653
Virginia:
$16,667
(% of AGI for various income ranges: 1.9% for AGIs below $25k, 1.4% for AGIs $25k-50k, 1.6% for AGIs $50k-75k, 1.8% for AGIs $75k-100k, 1.7% for AGIs $100k-200k, 1.4% for AGIs over 200k)
Self-employment retirement plans: $28,904 (reported on 2.0% of returns)
22043:
$28,904
Virginia:
$25,373
(% of AGI for various income ranges: 0.4% for AGIs $50k-75k, 0.4% for AGIs $100k-200k, 1.2% for AGIs over 200k)
Total itemized deductions: $29,730 (19% of AGI, reported on 47.4% of returns)
Here:
$29,730
State:
$26,596
Here:
19.0% of AGI
State:
20.1% of AGI
(% of AGI for various income ranges: 12.0% for AGIs below $25k, 13.4% for AGIs $25k-50k, 13.4% for AGIs $50k-75k, 15.2% for AGIs $75k-100k, 17.0% for AGIs $100k-200k, 13.9% for AGIs over 200k)
Charity contributions: $3,709 (reported on 38.8% of returns)
Here:
$3,709
State:
$4,443
(% of AGI for various income ranges: 0.6% for AGIs below $25k, 1.0% for AGIs $25k-50k, 1.2% for AGIs $50k-75k, 1.4% for AGIs $75k-100k, 1.7% for AGIs $100k-200k, 1.6% for AGIs over 200k)
Taxes paid: $12,931 (reported on 47.3% of returns)
22043:
$12,931
State:
$9,951
(% of AGI for various income ranges: 2.2% for AGIs below $25k, 3.0% for AGIs $25k-50k, 4.1% for AGIs $50k-75k, 5.7% for AGIs $75k-100k, 7.3% for AGIs $100k-200k, 7.4% for AGIs over 200k)
Earned income credit: $1,852 (reported on 8.3% of returns)
Here:
$1,852
State:
$2,211
(% of AGI for various income ranges: 3.6% for AGIs below $25k, 0.6% for AGIs $25k-50k)
Percentage of individuals using paid preparers for their 2012 taxes: 48.1%
Here:
48%
State:
46%
(% for various income ranges: 52.1% for AGIs below $25k, 49.6% for AGIs $25k-50k, 45.4% for AGIs $50k-75k, 44.8% for AGIs $75k-100k, 43.3% for AGIs $100k-200k, 51.9% for AGIs over 200k)
Averages for the 2004 tax year for zip code 22043, filed in 2005:
Average Adjusted Gross Income (AGI) in 2004: $70,532 (Individual Income Tax Returns)
Here:
$70,532
State:
$56,704
Salary/wage: $63,470 (reported on 87.0% of returns)
Here:
$63,470
State:
$48,441
(% of AGI for various income ranges: 116.7% for AGIs below $10k, 81.9% for AGIs $10k-25k, 85.1% for AGIs $25k-50k, 84.1% for AGIs $50k-75k, 81.5% for AGIs $75k-100k, 73.8% for AGIs over 100k)
Taxable interest for individuals: $1,857 (reported on 54.9% of returns)
This zip code:
$1,857
Virginia:
$1,688
(% of AGI for various income ranges: 4.6% for AGIs below $10k, 1.6% for AGIs $10k-25k, 1.2% for AGIs $25k-50k, 1.0% for AGIs $50k-75k, 1.2% for AGIs $75k-100k, 1.6% for AGIs over 100k)
Taxable dividends: $3,200 (reported on 34.2% of returns)
Here:
$3,200
State:
$4,028
(% of AGI for various income ranges: 5.4% for AGIs below $10k, 1.2% for AGIs $10k-25k, 0.9% for AGIs $25k-50k, 1.1% for AGIs $50k-75k, 1.4% for AGIs $75k-100k, 1.8% for AGIs over 100k)
Net capital gain/loss: +$7,790 (reported on 28.0% of returns)
Here:
+$7,790
State:
+$14,375
(% of AGI for various income ranges: -0.3% for AGIs below $10k, -0.2% for AGIs $10k-25k, 0.1% for AGIs $25k-50k, 0.5% for AGIs $50k-75k, 0.7% for AGIs $75k-100k, 5.2% for AGIs over 100k)
Profit/loss from business: +$17,428 (reported on 15.7% of returns)
Here:
+$17,428
State:
+$13,342
(% of AGI for various income ranges: 17.9% for AGIs below $10k, 8.1% for AGIs $10k-25k, 4.4% for AGIs $25k-50k, 2.5% for AGIs $50k-75k, 3.6% for AGIs $75k-100k, 3.7% for AGIs over 100k)
IRA payment deduction: $3,211 (reported on 3.2% of returns)
22043:
$3,211
Virginia:
$2,943
(% of AGI for various income ranges: 0.3% for AGIs $10k-25k, 0.3% for AGIs $25k-50k, 0.2% for AGIs $50k-75k, 0.2% for AGIs $75k-100k, 0.1% for AGIs over 100k)
Self-employed pension: $16,077 (reported on 2.2% of returns)
Here:
$16,077
Virginia:
$17,430
(% of AGI for various income ranges: 0.2% for AGIs $25k-50k, 0.2% for AGIs $50k-75k, 0.3% for AGIs $75k-100k, 0.7% for AGIs over 100k)
Total itemized deductions: $22,804 (21% of AGI, reported on 50.0% of returns)
Here:
$22,804
State:
$21,492
Here:
20.8% of AGI
State:
21.0% of AGI
(% of AGI for various income ranges: 16.8% for AGIs below $10k, 14.5% for AGIs $10k-25k, 15.6% for AGIs $25k-50k, 16.2% for AGIs $50k-75k, 18.6% for AGIs $75k-100k, 15.8% for AGIs over 100k)
Charity contributions deductions: $3,072 (3% of AGI, reported on 43.6% of returns)
Here:
$3,072
State:
$3,794
Here:
2.6% of AGI
State:
3.5% of AGI
(% of AGI for various income ranges: 0.6% for AGIs below $10k, 1.0% for AGIs $10k-25k, 1.5% for AGIs $25k-50k, 1.7% for AGIs $50k-75k, 2.4% for AGIs $75k-100k, 2.0% for AGIs over 100k)
Total tax: $12,410 (reported on 86.1% of returns)
22043:
$12,410
State:
$9,537
(% of AGI for various income ranges: 4.8% for AGIs below $10k, 5.1% for AGIs $10k-25k, 8.5% for AGIs $25k-50k, 11.3% for AGIs $50k-75k, 12.5% for AGIs $75k-100k, 19.1% for AGIs over 100k)
Earned income credit: $1,480 (reported on 6.4% of returns)
Here:
$1,480
State:
$1,734
Percentage of individuals using paid preparers for their 2004 taxes: 47.6%
Here:
48%
State:
52%
(% for various income ranges: 43.8% for AGIs below $10k, 55.5% for AGIs $10k-25k, 48.7% for AGIs $25k-50k, 44.9% for AGIs $50k-75k, 44.7% for AGIs $75k-100k, 46.3% for AGIs over 100k)
Likely homosexual households (counted as self-reported same-sex unmarried-partner households)
Lesbian couples: 0.1% of all households
Gay men: 0.2% of all households
Household received Food Stamps/SNAP in the past 12 months: 457 Household did not receive Food Stamps/SNAP in the past 12 months: 9,532
Women who had a birth in the past 12 months: 216 (200 now married, 19 unmarried) Women who did not have a birth in the past 12 months: 6,711 (3,342 now married, 3,350 unmarried)
Housing units in zip code 22043 with a mortgage: 4,263 (399 second mortgage, 17 home equity loan, 359 both second mortgage and home equity loan) Houses without a mortgage: 88
Median monthly owner costs for units with a mortgage: $3,332 Median monthly owner costs for units without a mortgage: $1,019
Residents with income below the poverty level in 2022:
This zip code:
5.8%
Whole state:
10.6%
Residents with income below 50% of the poverty level in 2022:
This zip code:
1.7%
Whole state:
5.2%
Median number of rooms in houses and condos:
Here:
7.9
State:
7.0
Median number of rooms in apartments:
Here:
3.8
State:
4.3
Notable locations in this zip code not listed on our city pages
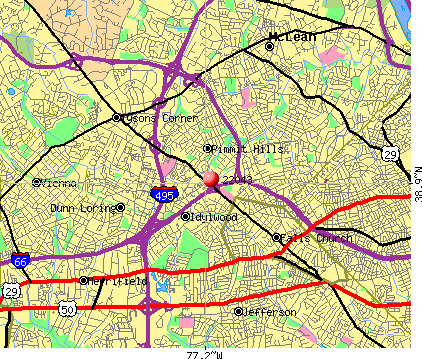
Notable locations in zip code 22043: Jefferson Golf Course (A), West Falls Church-VT/UVA Metro Station (B), Jefferson District Park Golf Course (C), Tysons-Pimmit Regional Library (D). Display/hide their locations on the map
Shopping Centers: Tysons Station Shopping Center (1), Idylwood Plaza Shopping Center (2), Idylwood Shopping Center (3). Display/hide their locations on the map
Churches in zip code 22043 include: Word of Grace Fellowship Church (A), Saint Lukes United Methodist Church (B), Chesterbrook Presbyterian Church (C), The Church of Jesus Christ of Latter Day Saints (D), Temple Rodef Shalom Synagogue (E), Saint Lukes Methodist Church (F), Idylwood Presbyterian Church (G), Saint Pauls Lutheran Church (H). Display/hide their locations on the map
Parks in zip code 22043 include: Mount Royal Park (1), Jefferson District Park (2), Falls Church City Park (3), Powhatan Hills Park (4), Pimmit View Park (5), Olney Park (6), Lemon Road Park (7), Idylwood Park (8), Haycock Longfellow Park (9). Display/hide their locations on the map
4,570 married couples with children.
1,063 single-parent households (278 men, 785 women).
59.0% of residents of 22043 zip code speak English at home.
10.5% of residents speak Spanish at home (58% very well, 26% well, 9% not well, 7% not at all).
11.8% of residents speak other Indo-European language at home (66% very well, 23% well, 7% not well, 4% not at all).
15.8% of residents speak Asian or Pacific Island language at home (65% very well, 24% well, 10% not well, 1% not at all).
3.6% of residents speak other language at home (74% very well, 26% well).
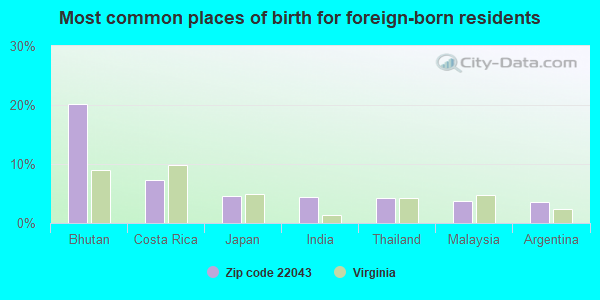
Foreign born population: 10,037 (38.6%) (60.7% of them are naturalized citizens)
This zip code:
38.6%
Whole state:
12.7%
20%Bhutan
7%Costa Rica
5%Japan
4%India
4%Thailand
4%Malaysia
4%Argentina
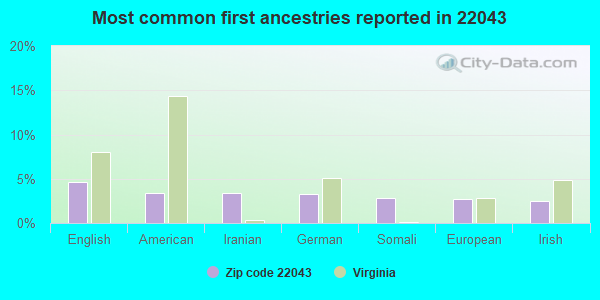
5%English
3%American
3%Iranian
3%German
3%Somali
3%European
2%Irish
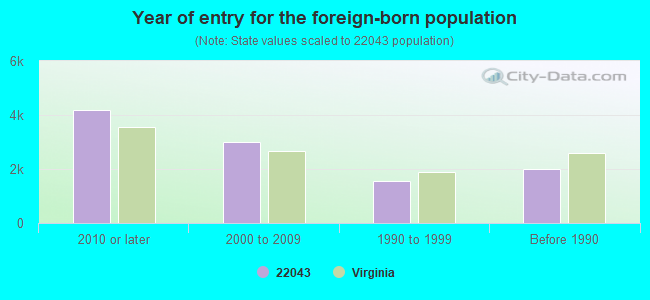
Year of entry for the foreign-born population
4,1792010 or later
3,0012000 to 2009
1,5661990 to 1999
1,996Before 1990
Facilities with environmental interests located in this zip code:
AREA 1 MANAGEMENT (1929 PIMMIT DR in FALLS CHURCH, VA)
Conditionally Exempt Small Quantity Generators, less than 100 kg/month of hazardous waste (Resource Conservation and Recovery Act (tracking hazardous waste)) - notification Organizations: OPERNAME (CONTACT/OPERATOR)
, FAIRFAX COUNTY PARK AUTHORITY (CONTACT/OWNER)
COGAN KIBLER INC (2929 ESKRIDGE RD PIA in FAIRFAX, VA)
Small Quantity Generators, between 100 kg and 1000 kg of hazardous waste/month (Resource Conservation and Recovery Act (tracking hazardous waste)) - notification Organizations: OPERNAME (CONTACT/OPERATOR)
, COGAN DAVID K KIBLER A (CONTACT/OWNER)
Housing units lacking complete plumbing facilities: 0.3%
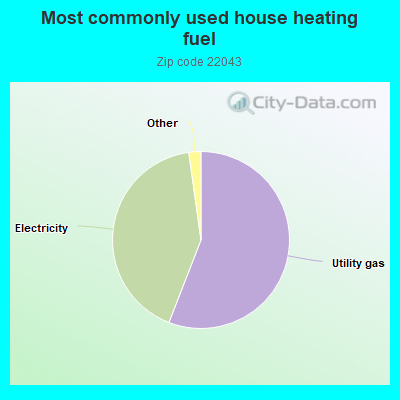
55.9%Utility gas
41.9%Electricity
1.0%Fuel oil, kerosene, etc.
0.7%Bottled, tank, or LP gas
Population in 1990: 20,928. Population change in the 1990s: +1,887 (+9.0%).
Place of birth for U.S.-born residents:
This state: 6,152
Northeast: 3,379
Midwest: 1,402
South: 3,281
West: 1,332
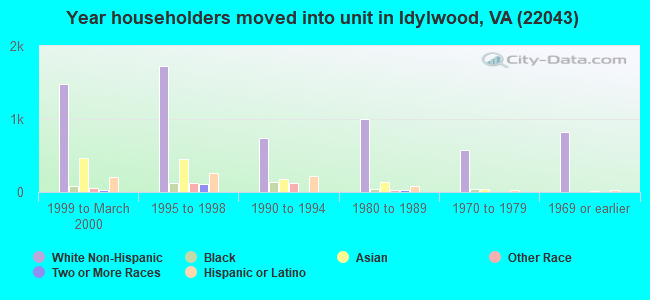
53% of the 22043 zip code residents lived in the same house 5 years ago. Out of people who lived in different houses, 40% lived in this county. Out of people who lived in different counties, 50% lived in Virginia.
86% of the 22043 zip code residents lived in the same house 1 year ago. Out of people who lived in different houses, 35% moved from this county. Out of people who lived in different houses, 18% moved from different county within same state. Out of people who lived in different houses, 38% moved from different state. Out of people who lived in different houses, 8% moved from abroad.
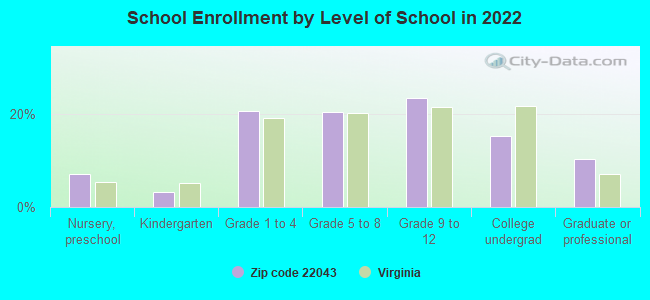
Private vs. public school enrollment:
Students in private schools in grades 1 to 8 (elementary and middle school): 352
Here:
11.9%
Virginia:
13.2%
Students in private schools in grades 9 to 12 (high school): 215
Here:
12.6%
Virginia:
10.2%
Students in private undergraduate colleges: 286
Here:
26.1%
Virginia:
18.7%
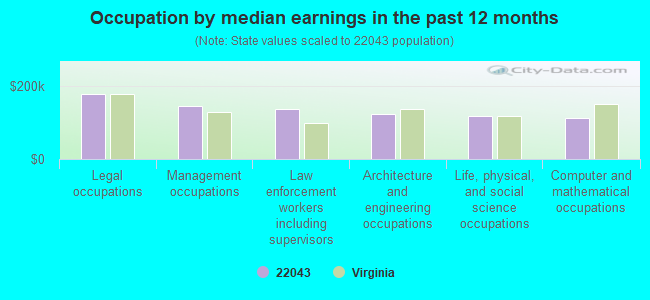
Occupation by median earnings in the past 12 months ($)
178,788Legal occupations
145,899Management occupations
138,907Law enforcement workers including supervisors
122,648Architecture and engineering occupations
117,286Life, physical, and social science occupations
112,562Computer and mathematical occupations
Companies with biggest federal contracts located in this zip code (FALLS CHURCH, VA):
DYNAMIC SYSTEMS, INC (7600 LEESBURG PIKE; small business) : $41,375,310 in 214 contractsfrom 1999 to 2006
Contracts for Other Management Support Services, Other Professional Services, Engineering and Technical Services, Other Administrative Support Services, and moreby Navy, Federal Technology Service, Offices, Boards and Divisions (includes Attorney General, Deputy Attorney General, etc.), Defense Information Systems Agency, and others Signed by year:2000: $5,968,230; 2001: $5,886,307; 2002: $6,077,258; 2003: $3,391,458; 2004: $12,349,667; 2005: $6,121,334; 2006: -$8,129.
Biggest contracts:
$2,836,981 with Navy for Other Management Support Services. Signed on 2004-09-14. Completion date: 2004-09-30.
$1,499,564, same as above.Signed on 2004-05-19. Completion date: 2004-11-30.
$1,392,371 with Navy for Other Professional Services. Signed on 2005-12-05. Completion date: 2006-09-30.
$1,368,419 with Navy for Other Management Support Services. Taking place in DC. Signed on 2005-12-01. Completion date: 2006-10-31.
CONDOR TECHNOLOGY SOLUTIONS, I (2745 HARTLAND ROAD; small business) : $33,036,545 in 40 contractsfrom 2000 to 2005
Contracts for Advertising Services, Communications Services, Operations Research and Quantitative Analysis Services, Program Review/Development Services, and moreby Army, Department of Veterans Affairs Signed by year:2000: $140,000; 2001: $450,000; 2002: $10,533,141; 2003: $0; 2004: $4,296,976; 2005: $17,616,428; 2006: $0.
Biggest contracts:
$6,356,693 with Army for Advertising Services. Signed on 2005-12-28. Completion date: 2007-03-31.
$4,500,000, same as above.Signed on 2005-09-30. Completion date: 2006-04-30.
$4,296,976, same as above.Signed on 2004-12-27. Completion date: 2006-03-31.
$4,232,000 with Department of Veterans Affairs for Communications Services. Taking place in PA. Signed on 2002-06-15. Completion date: 2003-05-15.
AIMPOINT USA (7702 LEESBURG PIKE FL 3; small business) : $21,609,202 in 46 contractsfrom 2000 to 2006
Contracts for Optical Sighting and Ranging Equipment, Optical Instruments, Test Equipment, Components and Accessories, Fire Control Computing Sights and Devices, Bushings, Rings, Shims, and Spacers, and moreby Army, Navy, Department of Defense, Defense Logistics Agency, and others Signed by year:2000: $86,384; 2001: $285,200; 2002: $1,151,697; 2003: $3,974,792; 2004: $24,867; 2005: $8,925,780; 2006: $7,160,482.
Biggest contracts:
$6,661,200 with Army for Optical Sighting and Ranging Equipment. Signed on 2006-01-13. Completion date: 2007-01-31.
$4,757,000 with Army for Optical Sighting and Ranging Equipment. Taking place in AR. Signed on 2005-01-24. Completion date: 2007-01-31.
$2,532,600, same as above.Signed on 2005-01-31. Completion date: 2007-01-31.
$1,642,520, same as above.Signed on 2003-12-09. Completion date: 2007-01-31.
HARLAN LEE & ASSOCIATES (7700 LEESBURG PIKE; small business) : $7,271,127 in 101 contractsfrom 2002 to 2006
Contracts for Logistics Support Services, Program Management/Support Services, Other Professional Services, Other ADP and Telecommunications Services (includes data storage on tapes, compact disks, etc.), and moreby Under Secretary for Export Administration/Bureau of Industry and Security, Navy, National Oceanic and Atmospheric Administration/Under Secretary for Oceans and Atmosphere, Department of State, and others Signed by year:2000: $0; 2001: $0; 2002: $344,149; 2003: $2,381,350; 2004: $1,947,898; 2005: $1,760,464; 2006: $837,266.
Biggest contracts:
$875,020 with Under Secretary for Export Administration/Bureau of Industry and Security for Logistics Support Services. Signed on 2003-06-15. Completion date: 2005-07-15.
$401,262 with Navy for Program Management/Support Services. Signed on 2003-02-11. Completion date: 2003-11-18.
$349,000 with National Oceanic and Atmospheric Administration/Under Secretary for Oceans and Atmosphere for Other Professional Services. Taking place in HI. Signed on 2006-09-05. Effective on 2006-09-15. Completion date: 2008-12-31.
$346,679 with Navy for Program Management/Support Services. Signed on 2004-11-19. Completion date: 2005-11-18.
APPLIED TECHNO-MANAGEMENT SYST (7700 LEESBURG PIKE STE 405; small business) : $6,925,039 in 86 contractsfrom 1999 to 2006
Contracts for Program Evaluation Services, Logistics Support Services, Services -- Engineering Development (R&D), Program Management/Support Services, and moreby Occupational Safety and Health Administration, Navy Signed by year:2000: $1,307,022; 2001: $533,510; 2002: $1,327,045; 2003: $818,742; 2004: $625,787; 2005: $1,146,827; 2006: $360,768.
Biggest contracts:
$752,000 with Occupational Safety and Health Administration for Program Evaluation Services. Signed on 2000-04-15. Completion date: 2000-09-15.
$557,981 with Navy for Logistics Support Services. Signed on 1999-11-09. Completion date: 2000-09-30.
$317,443 with Navy for Services -- Engineering Development (R&D). Taking place in IN. Signed on 2005-10-21. Completion date: 2006-10-20.
$248,998, same as above.Signed on 2006-03-23. Completion date: 2007-10-20.
JETFORM CORPORATION (7600 LEESBURG PIKE; small business) : $5,122,396 in 18 contractsfrom 1999 to 2004
Contracts for ADP Software, Other ADP and Telecommunications Services (includes data storage on tapes, compact disks, etc.), Maintenance, Repair and Rebuilding of Equipment -- Automatic Data Processing Equipment (Including Firmware), Software, Supplies and Support Equipment, Automated Information System Design and Integration Services, and moreby Federal Technology Service, SOCIAL SECURITY ADMINISTRATION, Department of State, Navy, and others Signed by year:2000: $1,575,667; 2001: $1,187,298; 2002: $1,063,320; 2003: $0; 2004: $596,111; 2005: $0; 2006: $0.
Biggest contracts:
$700,000 with Federal Technology Service for ADP Software. Signed on 1999-10-15. Completion date: 2000-09-15.
$596,111 with SOCIAL SECURITY ADMINISTRATION for Other ADP and Telecommunications Services (includes data storage on tapes, compact disks, etc.). Taking place in MD. Signed on 2004-05-10. Completion date: 2005-04-25.
$580,000 with Department of State for ADP Software. Taking place in DC. Signed on 2000-07-15. Completion date: 2005-07-15.
$517,000 with SOCIAL SECURITY ADMINISTRATION for Maintenance, Repair and Rebuilding of Equipment -- Automatic Data Processing Equipment (Including Firmware), Software, Supplies and Support Equipment. Taking place in MD. Signed on 2002-07-15. Completion date: 2001-04-15.
FOCAL COMMUNICATIONS CORPORATI (7799 LEESBURG PIKE, SUITE) : $3,058,042 in 21 contractsfrom 2001 to 2006
Contracts for Telephone and/or Communications Services (includes Telegraph, Telex, and Cablevision Services), ADP Telecommunications and Transmission Services, Gas Services by Air Force, Army Signed by year:2000: $0; 2001: $200,006; 2002: $247,749; 2003: $1,447,293; 2004: $264,951; 2005: $813,043; 2006: $85,000.
Biggest contracts:
$867,422 with Air Force for Telephone and/or Communications Services (includes Telegraph, Telex, and Cablevision Services). Taking place in MD. Signed on 2003-09-11. Completion date: 2009-02-01.
$374,500 with Air Force for ADP Telecommunications and Transmission Services. Taking place in OK. Signed on 2005-09-23. Completion date: 2005-09-30.
$234,410 with Army for Telephone and/or Communications Services (includes Telegraph, Telex, and Cablevision Services). Taking place in NJ. Signed on 2005-10-04. Completion date: 2001-10-05.
$231,124, same as above.Signed on 2003-10-03. Completion date: 2001-10-05.
MOUNTAIN WAVE, INC (7115 LEESBURG PIKE; small business) : $2,698,310 in 17 contractsfrom 2000 to 2003
Contracts for Other Defense -- Applied Research and Exploratory Development (R&D), Defense Ships -- Basic Research (R&D), ADPE System Configuration, ADP Software by Air Force, Navy, Immigration and Naturalization Service Signed by year:2000: $525,000; 2001: $1,360,745; 2002: $772,600; 2003: $39,965; 2004: $0; 2005: $0; 2006: $0.
Biggest contracts:
$400,000 with Air Force for Other Defense -- Applied Research and Exploratory Development (R&D). Signed on 2001-08-30. Completion date: 2003-01-31.
$375,000, same as above.Signed on 2000-02-02. Completion date: 2002-06-30.
$368,765, same as above.Signed on 2001-02-23. Completion date: 2002-06-30.
$250,000 with Navy for Defense Ships -- Basic Research (R&D). Signed on 2001-01-30. Completion date: 2002-08-07.
WORLDPORT COMMUNICATIONS, L L (7777 LEESBURG PIKE STE 315; small business) : $535,350 in 4 contractsfrom 2002 to 2004
$149,400 with Navy for Telephone and/or Communications Services (includes Telegraph, Telex, and Cablevision Services). Signed on 2004-10-01. Completion date: 2005-09-30.
$149,400, same as above.Signed on 2003-10-01. Completion date: 2004-09-30.
$149,400, same as above.Signed on 2002-10-01. Completion date: 2003-09-30.
$87,150, same as above.Signed on 2002-03-12. Completion date: 2002-09-30.
ACCORD NETWORKS, INC (7799 LEESBURG PIKE; small business) : $522,772 in 2 contractsfrom 2000 to 2002
$344,000 with United States Mint for ADP Systems Analysis Services. Taking place in DC. Signed on 2000-10-15. Completion date: 2001-09-15.
$178,772 with Air Force for ADP Support Equipment. Signed on 2002-09-30. Completion date: 2003-10-30.
Top industries in this zip code by the number of employees in 2005:
Administrative and Support and Waste Management and Remediation Services: Security Guards and Patrol Services (over 1000 employees: 1 establishment, 100-249 employees: 1 establishment)
Management of Companies and Enterprises: Corporate, Subsidiary, and Regional Managing Offices (250-499: 1, 50-99: 1, 10-19: 1, 5-9: 1, 1-4: 2)
2004 - 2018 National Fire Incident Reporting System (NFIRS) incidents
Based on the data from the years 2004 - 2018 the average number of fire incidents per year is 40. The highest number of fire incidents - 58 took place in 2005, and the least - 10 in 2004. The data has a growing trend.
When looking into fire subcategories, the most reports belonged to: Structure Fires (42.6%), and Outside Fires (34.9%).
Fire incident types reported to NFIRS in Zip Code 22043


 Nearest zip codes: 22046, 22027, 22213, 22042, 22101, 22044.
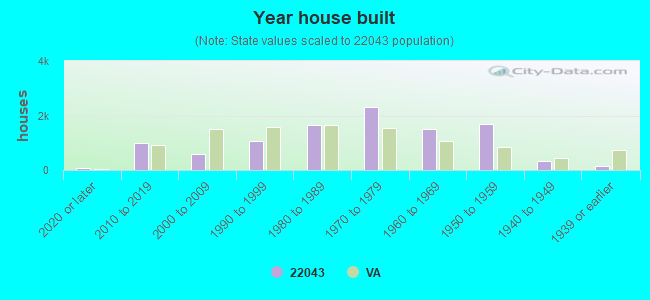


 Based on the data from the years 2004 - 2018 the average number of fire incidents per year is 40. The highest number of fire incidents - 58 took place in 2005, and the least - 10 in 2004. The data has a growing trend.
 When looking into fire subcategories, the most reports belonged to: Structure Fires (42.6%), and Outside Fires (34.9%).