Estimated zip code population in 2022: 4,178 Zip code population in 2010: 2,936 Zip code population in 2000: 2,469
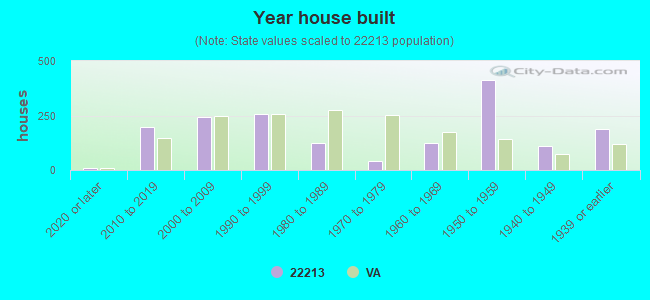
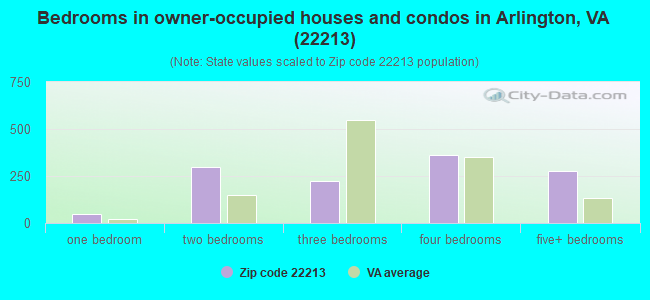
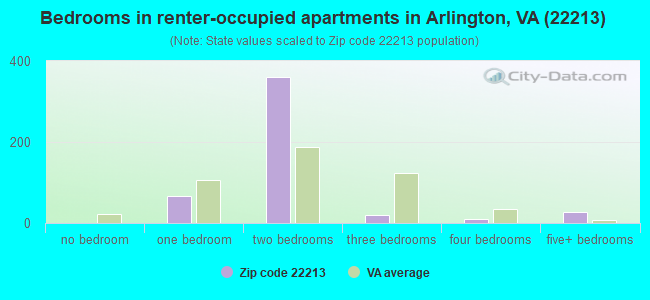
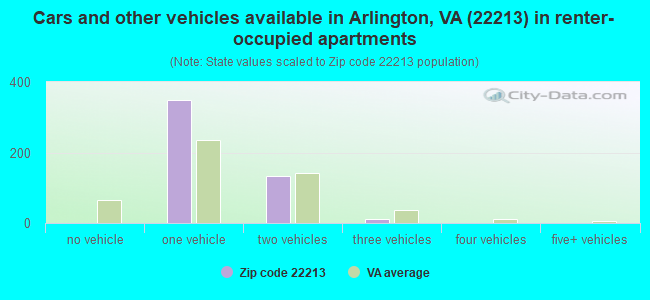
Houses and condos: 1,707 Renter-occupied apartments: 489
% of renters here:
29%
State:
33%
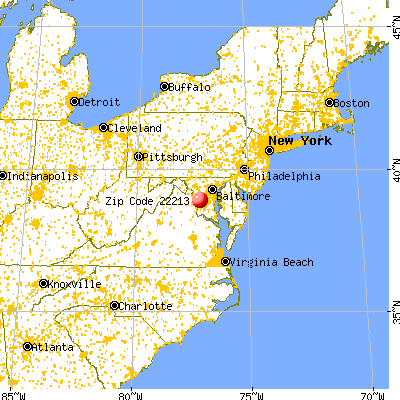
March 2022 cost of living index in zip code 22213: 172.8 (very high, U.S. average is 100)
Land area: 0.6 sq. mi. Water area: 0.0 sq. mi.
Population density: 7,328 people per square mile
(high).
OSM Map
General Map
Google Map
MSN Map
OSM Map
General Map
Google Map
MSN Map
OSM Map
General Map
Google Map
MSN Map
OSM Map
General Map
Google Map
MSN Map
Please wait while loading the map...
Real estate property taxes paid for housing units in 2022:
This zip code:
0.8% ($8,891)
Virginia:
0.7% ($2,617)
Median real estate property taxes paid for housing units with mortgages in 2022: $8,628 (0.8%) Median real estate property taxes paid for housing units with no mortgage in 2022: $10,355 (1.0%)
Business Search- 14 Million verified businesses
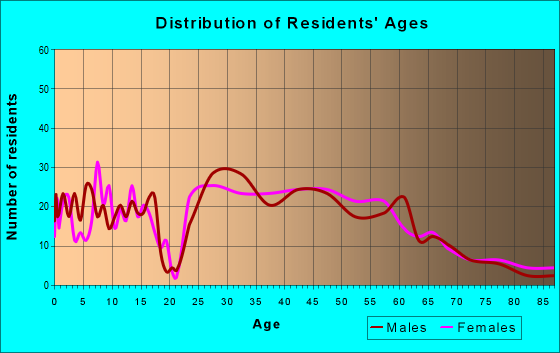
Males: 2,080
(49.8%)
Females: 2,097
(50.2%)
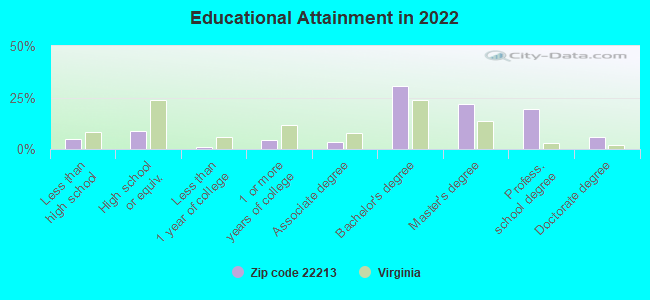
For population 25 years and over in 22213:
High school or higher: 95.7%
Bachelor's degree or higher: 78.1%
Graduate or professional degree: 47.3%
Unemployed: 1.5%
Mean travel time to work (commute): 29.7 minutes
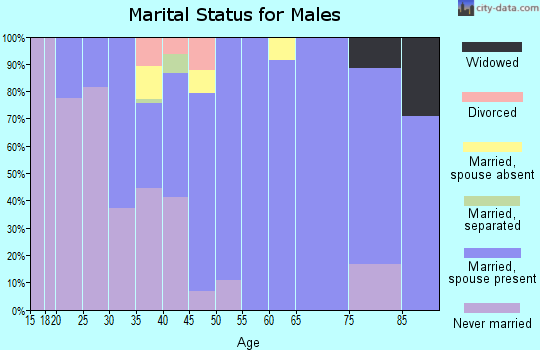
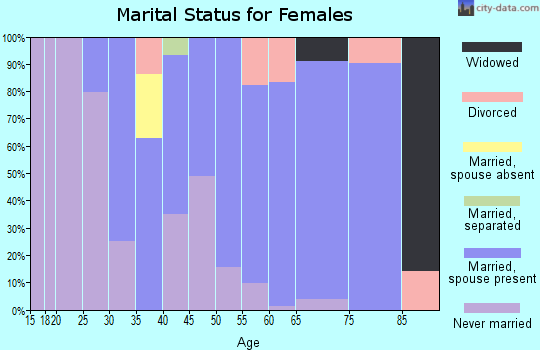
For population 15 years and over in 22213:
Never married: 26.5%
Now married: 62.7%
Separated: 0.9%
Widowed: 1.0%
Divorced: 8.9%
Zip code 22213 compared to state average:
Median household income significantly above state average.
Median house value significantly above state average.
Unemployed percentage below state average.
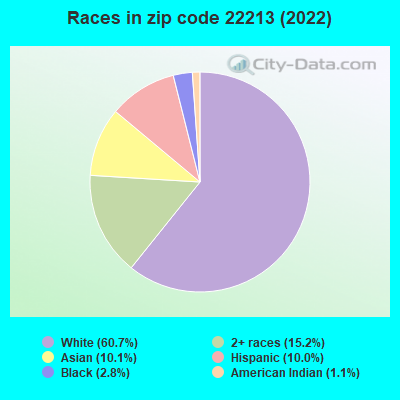
Black race population percentage significantly below state average.
Length of stay since moving in significantly above state average.
Percentage of population with a bachelor's degree or higher above state average.
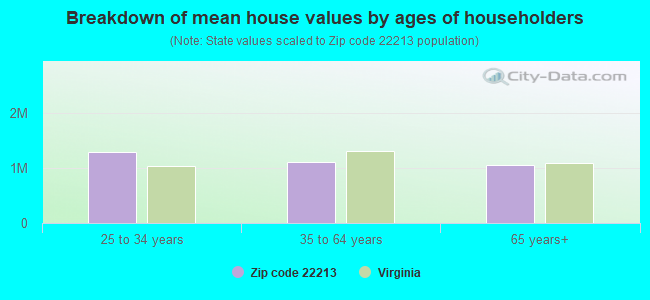
Estimated median house/condo value in 2022: $1,048,455
22213:
$1,048,455
Virginia:
$365,700
Median resident age:
This zip code:
40.6 years
Virginia median age:
39.0 years
Average household size:
This zip code:
2.5 people
Virginia:
2.5 people
Averages for the 2020 tax year for zip code 22213, filed in 2021:
Average Adjusted Gross Income (AGI) in 2020: $220,495 (Individual Income Tax Returns)
Here:
$220,495
State:
$86,446
Salary/wage: $165,181 (reported on 82.3% of returns)
Here:
$165,181
State:
$71,185
(% of AGI for various income ranges: 1351.5% for AGIs below $25k, 3496.4% for AGIs $25k-50k, 7847.8% for AGIs $50k-75k, 9647.0% for AGIs $75k-100k, 20888.6% for AGIs $100k-200k, 98009.4% for AGIs over 200k)
Taxable interest for individuals: $2,359 (reported on 61.0% of returns)
This zip code:
$2,359
Virginia:
$1,805
(% of AGI for various income ranges: 20.8% for AGIs below $25k, 57.3% for AGIs $25k-50k, 46.7% for AGIs $50k-75k, 105.0% for AGIs $75k-100k, 336.2% for AGIs $100k-200k, 885.0% for AGIs over 200k)
Ordinary dividends: $9,604 (reported on 56.1% of returns)
Here:
$9,604
State:
$8,327
(% of AGI for various income ranges: 66.2% for AGIs below $25k, 147.3% for AGIs $25k-50k, 246.7% for AGIs $50k-75k, 288.0% for AGIs $75k-100k, 866.7% for AGIs $100k-200k, 3911.2% for AGIs over 200k)
Net capital gain/loss in AGI: +$30,766 (reported on 50.6% of returns)
Here:
+$30,766
State:
+$24,644
(% of AGI for various income ranges: 68.5% for AGIs below $25k, 60.9% for AGIs $25k-50k, 336.7% for AGIs $50k-75k, 196.0% for AGIs $75k-100k, 910.0% for AGIs $100k-200k, 14356.2% for AGIs over 200k)
Profit/loss from business: +$40,245 (reported on 17.7% of returns)
Here:
+$40,245
State:
+$12,836
(% of AGI for various income ranges: 245.4% for AGIs below $25k, 872.2% for AGIs $50k-75k, 1138.1% for AGIs $100k-200k, 5110.6% for AGIs over 200k)
Taxable individual retirement arrangement distribution: $27,600 (reported on 10.4% of returns)
22213:
$27,600
Virginia:
$21,535
(% of AGI for various income ranges: 134.6% for AGIs below $25k, 447.8% for AGIs $50k-75k, 590.5% for AGIs $100k-200k, 1796.2% for AGIs over 200k)
Self-employed (Keogh) retirement plans: $44,180 (reported on 6.1% of returns)
22213:
$44,180
Virginia:
$31,172
(% of AGI for various income ranges: 2761.2% for AGIs over 200k)
Total itemized deductions: $38,839 (reported on 39.0% of returns)
Here:
$38,839
State:
$33,287
(% of AGI for various income ranges: 466.9% for AGIs below $25k, 878.9% for AGIs $50k-75k, 895.0% for AGIs $75k-100k, 2617.1% for AGIs $100k-200k, 10667.5% for AGIs over 200k)
Charity contributions: $10,986 (reported on 34.8% of returns)
Here:
$10,986
State:
$10,381
(% of AGI for various income ranges: 212.2% for AGIs $50k-75k, 92.0% for AGIs $75k-100k, 474.3% for AGIs $100k-200k, 3114.4% for AGIs over 200k)
Taxes paid: $9,487 (reported on 38.4% of returns)
22213:
$9,487
State:
$8,284
(% of AGI for various income ranges: 95.4% for AGIs below $25k, 190.0% for AGIs $50k-75k, 280.0% for AGIs $75k-100k, 763.3% for AGIs $100k-200k, 2374.4% for AGIs over 200k)
Earned income credit: $1,025 (reported on 2.4% of returns)
Here:
$1,025
State:
$2,214
(% of AGI for various income ranges: 31.5% for AGIs below $25k)
Percentage of individuals using paid preparers for their 2020 taxes: 91.5%
Here:
91%
State:
92%
(% for various income ranges: 78.3% for AGIs below $25k, 92.9% for AGIs $25k-50k, 93.8% for AGIs $50k-75k, 86.7% for AGIs $75k-100k, 95.2% for AGIs $100k-200k, 94.4% for AGIs over 200k)
Averages for the 2012 tax year for zip code 22213, filed in 2013:
Average Adjusted Gross Income (AGI) in 2012: $149,746 (Individual Income Tax Returns)
Here:
$149,746
State:
$71,192
Salary/wage: $133,711 (reported on 84.6% of returns)
Here:
$133,711
State:
$59,229
(% of AGI for various income ranges: 72.9% for AGIs below $25k, 77.5% for AGIs $25k-50k, 74.1% for AGIs $50k-75k, 80.3% for AGIs $75k-100k, 79.4% for AGIs $100k-200k, 73.4% for AGIs over 200k)
Taxable interest for individuals: $1,262 (reported on 60.4% of returns)
This zip code:
$1,262
Virginia:
$1,600
(% of AGI for various income ranges: 3.1% for AGIs below $25k, 0.9% for AGIs $25k-50k, 0.9% for AGIs $50k-75k, 0.5% for AGIs $75k-100k, 0.7% for AGIs $100k-200k, 0.3% for AGIs over 200k)
Ordinary dividends: $6,312 (reported on 49.1% of returns)
Here:
$6,312
State:
$6,959
(% of AGI for various income ranges: 6.9% for AGIs below $25k, 2.1% for AGIs $25k-50k, 2.2% for AGIs $50k-75k, 1.6% for AGIs $75k-100k, 2.2% for AGIs $100k-200k, 2.0% for AGIs over 200k)
Net capital gain/loss in AGI: +$7,057 (reported on 38.5% of returns)
Here:
+$7,057
State:
+$16,672
(% of AGI for various income ranges: 0.4% for AGIs $50k-75k, 0.4% for AGIs $75k-100k, 1.1% for AGIs $100k-200k, 2.5% for AGIs over 200k)
Profit/loss from business: +$35,246 (reported on 15.4% of returns)
Here:
+$35,246
State:
+$14,116
(% of AGI for various income ranges: 7.7% for AGIs below $25k, 5.8% for AGIs $25k-50k, 4.9% for AGIs $50k-75k, 1.9% for AGIs $75k-100k, 3.7% for AGIs $100k-200k, 3.5% for AGIs over 200k)
Taxable individual retirement arrangement distribution: $18,862 (reported on 12.4% of returns)
22213:
$18,862
Virginia:
$16,667
(% of AGI for various income ranges: 4.4% for AGIs below $25k, 2.6% for AGIs $50k-75k, 3.1% for AGIs $75k-100k, 1.9% for AGIs $100k-200k, 1.2% for AGIs over 200k)
Self-employment retirement plans: $31,343 (reported on 4.1% of returns)
22213:
$31,343
Virginia:
$25,373
(% of AGI for various income ranges: 1.7% for AGIs $50k-75k, 1.3% for AGIs over 200k)
Total itemized deductions: $37,957 (17% of AGI, reported on 59.8% of returns)
Here:
$37,957
State:
$26,596
Here:
17.4% of AGI
State:
20.1% of AGI
(% of AGI for various income ranges: 15.3% for AGIs below $25k, 10.9% for AGIs $25k-50k, 15.4% for AGIs $50k-75k, 14.6% for AGIs $75k-100k, 17.2% for AGIs $100k-200k, 14.4% for AGIs over 200k)
Charity contributions: $5,259 (reported on 50.9% of returns)
Here:
$5,259
State:
$4,443
(% of AGI for various income ranges: 1.0% for AGIs $25k-50k, 1.7% for AGIs $50k-75k, 1.5% for AGIs $75k-100k, 1.8% for AGIs $100k-200k, 1.9% for AGIs over 200k)
Taxes paid: $17,545 (reported on 59.8% of returns)
22213:
$17,545
State:
$9,951
(% of AGI for various income ranges: 2.3% for AGIs below $25k, 3.3% for AGIs $25k-50k, 5.0% for AGIs $50k-75k, 5.6% for AGIs $75k-100k, 7.5% for AGIs $100k-200k, 7.4% for AGIs over 200k)
Earned income credit: $1,300 (reported on 2.4% of returns)
Here:
$1,300
State:
$2,211
(% of AGI for various income ranges: 1.9% for AGIs below $25k)
Percentage of individuals using paid preparers for their 2012 taxes: 40.8%
Here:
41%
State:
46%
(% for various income ranges: 40.7% for AGIs below $25k, 42.1% for AGIs $25k-50k, 31.8% for AGIs $50k-75k, 33.3% for AGIs $75k-100k, 40.4% for AGIs $100k-200k, 50.0% for AGIs over 200k)
Averages for the 2004 tax year for zip code 22213, filed in 2005:
Average Adjusted Gross Income (AGI) in 2004: $95,369 (Individual Income Tax Returns)
Here:
$95,369
State:
$56,704
Salary/wage: $86,290 (reported on 82.6% of returns)
Here:
$86,290
State:
$48,441
(% of AGI for various income ranges: 101.2% for AGIs below $10k, 72.5% for AGIs $10k-25k, 73.4% for AGIs $25k-50k, 69.7% for AGIs $50k-75k, 76.8% for AGIs $75k-100k, 75.2% for AGIs over 100k)
Taxable interest for individuals: $1,550 (reported on 69.6% of returns)
This zip code:
$1,550
Virginia:
$1,688
(% of AGI for various income ranges: 2.3% for AGIs below $10k, 3.0% for AGIs $10k-25k, 2.0% for AGIs $25k-50k, 1.7% for AGIs $50k-75k, 1.9% for AGIs $75k-100k, 0.8% for AGIs over 100k)
Taxable dividends: $3,501 (reported on 52.0% of returns)
Here:
$3,501
State:
$4,028
(% of AGI for various income ranges: 7.0% for AGIs below $10k, 2.5% for AGIs $10k-25k, 3.0% for AGIs $25k-50k, 2.0% for AGIs $50k-75k, 2.3% for AGIs $75k-100k, 1.7% for AGIs over 100k)
Net capital gain/loss: +$9,387 (reported on 42.8% of returns)
Here:
+$9,387
State:
+$14,375
(% of AGI for various income ranges: -5.8% for AGIs below $10k, -0.7% for AGIs $10k-25k, -0.4% for AGIs $25k-50k, 0.5% for AGIs $50k-75k, 2.3% for AGIs $75k-100k, 5.7% for AGIs over 100k)
Profit/loss from business: +$29,139 (reported on 15.3% of returns)
Here:
+$29,139
State:
+$13,342
(% of AGI for various income ranges: 9.6% for AGIs $10k-25k, 3.9% for AGIs $25k-50k, 2.7% for AGIs $50k-75k, 4.1% for AGIs $75k-100k, 5.0% for AGIs over 100k)
IRA payment deduction: $3,293 (reported on 3.0% of returns)
22213:
$3,293
Virginia:
$2,943
Self-employed pension: $19,642 (reported on 3.9% of returns)
Here:
$19,642
Virginia:
$17,430
Total itemized deductions: $26,333 (19% of AGI, reported on 59.1% of returns)
Here:
$26,333
State:
$21,492
Here:
19.2% of AGI
State:
21.0% of AGI
(% of AGI for various income ranges: 20.1% for AGIs below $10k, 11.4% for AGIs $10k-25k, 15.0% for AGIs $25k-50k, 16.7% for AGIs $50k-75k, 20.0% for AGIs $75k-100k, 15.9% for AGIs over 100k)
Charity contributions deductions: $3,590 (3% of AGI, reported on 53.8% of returns)
Here:
$3,590
State:
$3,794
Here:
2.5% of AGI
State:
3.5% of AGI
(% of AGI for various income ranges: 0.8% for AGIs $10k-25k, 1.3% for AGIs $25k-50k, 2.4% for AGIs $50k-75k, 1.8% for AGIs $75k-100k, 2.1% for AGIs over 100k)
Total tax: $17,421 (reported on 90.9% of returns)
22213:
$17,421
State:
$9,537
(% of AGI for various income ranges: 6.2% for AGIs below $10k, 6.9% for AGIs $10k-25k, 9.1% for AGIs $25k-50k, 12.2% for AGIs $50k-75k, 11.9% for AGIs $75k-100k, 19.0% for AGIs over 100k)
Earned income credit: $1,049 (reported on 3.0% of returns)
Here:
$1,049
State:
$1,734
Percentage of individuals using paid preparers for their 2004 taxes: 39.8%
Here:
40%
State:
52%
(% for various income ranges: 32.7% for AGIs below $10k, 44.9% for AGIs $10k-25k, 35.9% for AGIs $25k-50k, 41.1% for AGIs $50k-75k, 41.5% for AGIs $75k-100k, 41.6% for AGIs over 100k)
Likely homosexual households (counted as self-reported same-sex unmarried-partner households)
Lesbian couples: 0.0% of all households
Gay men: 0.9% of all households
Household received Food Stamps/SNAP in the past 12 months: 0 Household did not receive Food Stamps/SNAP in the past 12 months: 1,666
Women who had a birth in the past 12 months: 31 (23 now married, 7 unmarried) Women who did not have a birth in the past 12 months: 951 (468 now married, 481 unmarried)
Housing units in zip code 22213 with a mortgage: 1,002 (101 second mortgage, 10 home equity loan, 80 both second mortgage and home equity loan) Houses without a mortgage: 17
Median monthly owner costs for units with a mortgage: $3,573 Median monthly owner costs for units without a mortgage: $1,290
Residents with income below the poverty level in 2022:
This zip code:
2.6%
Whole state:
10.6%
Residents with income below 50% of the poverty level in 2022:
This zip code:
1.0%
Whole state:
5.2%
Median number of rooms in houses and condos:
Here:
8.3
State:
7.0
Median number of rooms in apartments:
Here:
4.4
State:
4.3
Notable locations in this zip code not listed on our city pages
In group quarters: 18 (-1 institutionalized population)
Size of family households: 667 2-persons, 347 3-persons, 251 4-persons, 19 5-persons, 33 6-persons
Size of nonfamily households: 228 1-person, 131 2-persons, 11 3-persons
674 married couples with children.
157 single-parent households (27 men, 130 women).
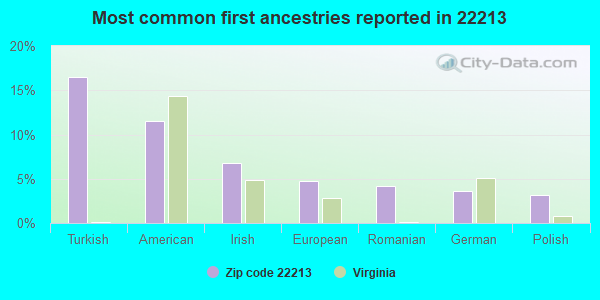
76.8% of residents of 22213 zip code speak English at home.
5.6% of residents speak Spanish at home (93% very well, 3% well, 4% not well).
3.9% of residents speak other Indo-European language at home (86% very well, 14% well).
12.3% of residents speak Asian or Pacific Island language at home (45% very well, 6% well, 49% not well).
1.0% of residents speak other language at home (100% very well).
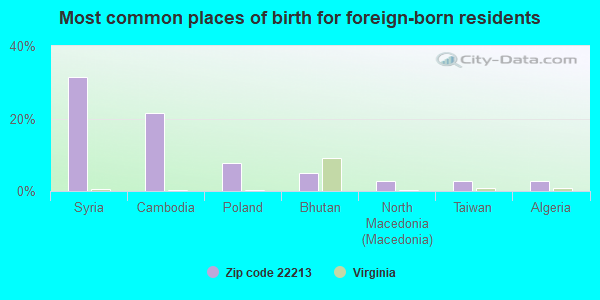
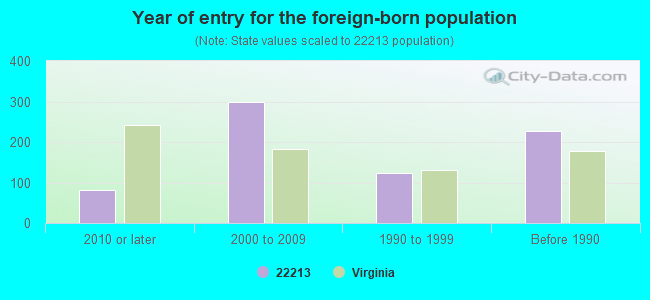
Foreign born population: 702 (16.8%) (81.4% of them are naturalized citizens)
Facilities with environmental interests located in this zip code:
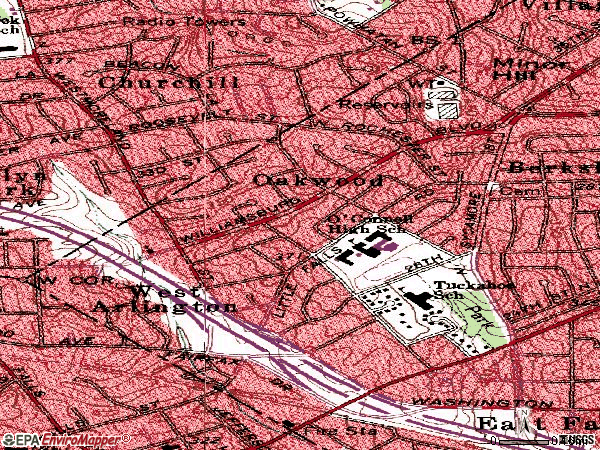
BISHOP DENIS J OCONNELL HIGH SCHOOL (6600 LITTLE FALLS ROAD in ARLINGTON, VA)
AIR MINOR (AIRS/AFS) STATE MASTER (Virginia pollutants databases) - CEDS-70606, AIR PROGRAM Conditionally Exempt Small Quantity Generators, less than 100 kg/month of hazardous waste (Resource Conservation and Recovery Act (tracking hazardous waste)) Business SIC and NAICS classification: ELEMENTARY AND SECONDARY SCHOOLS Organizations: DIOCESE OF ARLINGTON (CONTACT/OPERATOR)
Alternative names: DENIS OCONNELL HIGH SCHOOL
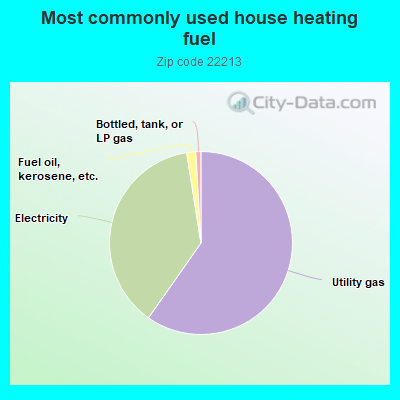
59.8%Utility gas
37.8%Electricity
1.6%Fuel oil, kerosene, etc.
0.9%Bottled, tank, or LP gas
Population in 1990: 2,095. Population change in the 1990s: +374 (+17.9%).
Place of birth for U.S.-born residents:
This state: 918
Northeast: 647
Midwest: 398
South: 1,141
West: 334
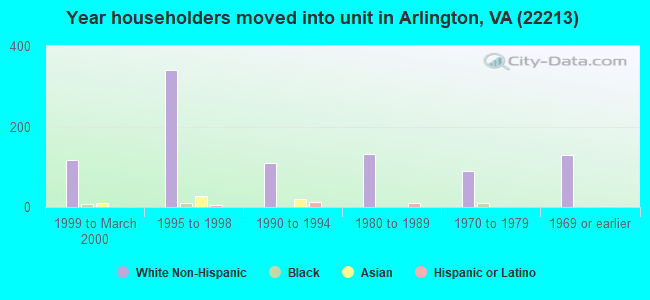
55% of the 22213 zip code residents lived in the same house 5 years ago. Out of people who lived in different houses, 38% lived in this county. Out of people who lived in different counties, 50% lived in Virginia.
87% of the 22213 zip code residents lived in the same house 1 year ago. Out of people who lived in different houses, 32% moved from this county. Out of people who lived in different houses, 33% moved from different county within same state. Out of people who lived in different houses, 31% moved from different state. Out of people who lived in different houses, 3% moved from abroad.
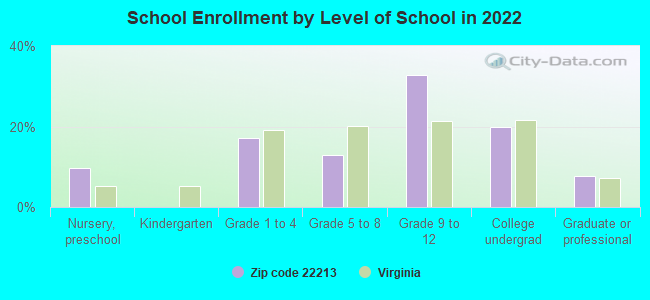
Private vs. public school enrollment:
Students in private schools in grades 1 to 8 (elementary and middle school): 19
Here:
7.0%
Virginia:
13.2%
Students in private schools in grades 9 to 12 (high school): 33
Here:
10.7%
Virginia:
10.2%
Students in private undergraduate colleges: 56
Here:
30.1%
Virginia:
18.7%
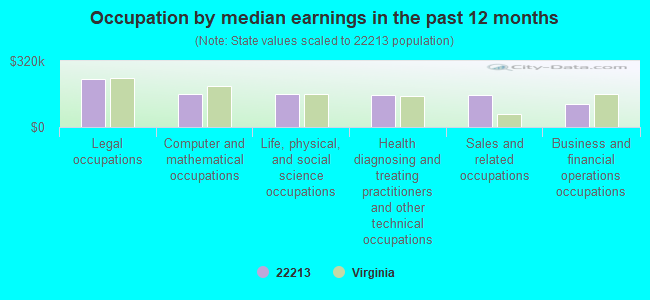
Occupation by median earnings in the past 12 months ($)
230,411Legal occupations
161,505Computer and mathematical occupations
161,137Life, physical, and social science occupations
153,329Health diagnosing and treating practitioners and other technical occupations
152,964Sales and related occupations
110,441Business and financial operations occupations
Companies with federal contracts located in this zip code:
BOLLE, JEFFREY (6705 D WASHINGTON BLVD in ARLINGTON, VA; small business)
$26,445 with Army for Technical Writing Services. Signed on 2003-06-03. Completion date: 2003-09-30.
JCC TECHNOLOGY ASSOCIATES INC (3611 N POCOMOKE ST in ARLINGTON, VA; small business)
$23,800 with Army for Program Management/Support Services. Signed on 2004-07-15. Completion date: 2004-10-11.
Top industries in this zip code by the number of employees in 2005:
Other Services (except Public Administration): Religious Organizations (100-249 employees: 1 establishment)
Educational Services: Elementary and Secondary Schools (100-249: 1)
Construction: Highway, Street, and Bridge Construction (50-99: 1)
Accommodation and Food Services: Full-Service Restaurants (20-49: 1, 5-9: 1)
Administrative and Support and Waste Management and Remediation Services: Carpet and Upholstery Cleaning Services (20-49: 1, 1-4: 1)
Professional, Scientific, and Technical Services: Veterinary Services (20-49: 1)
Administrative and Support and Waste Management and Remediation Services: Landscaping Services (10-19: 1, 1-4: 1)
Accommodation and Food Services: Hotels (except Casino Hotels) and Motels (10-19: 1)
People in group quarters in 2010:
10 people in other noninstitutional facilities
9 people in group homes intended for adults
People in group quarters in 2000:
12 people in religious group quarters
Home Mortgage Disclosure Act Aggregated Statistics For Year 2009 (Based on 2 partial tracts)
A) FHA, FSA/RHS & VA Home Purchase Loans
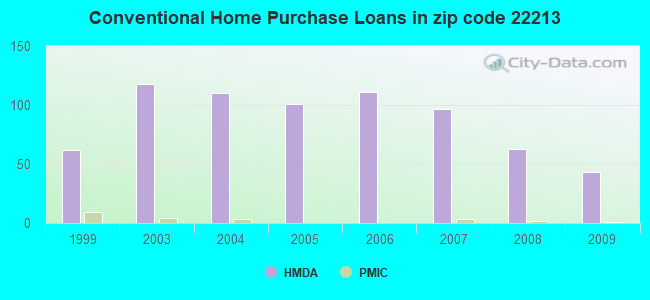
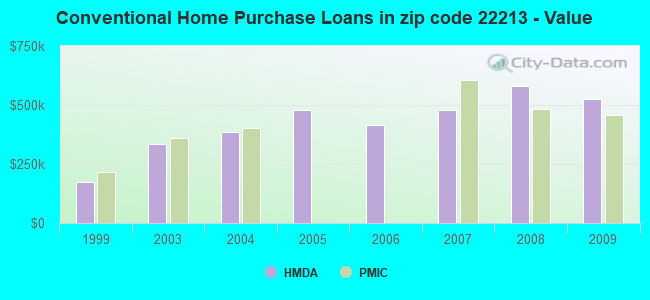
B) Conventional Home Purchase Loans
C) Refinancings
D) Home Improvement Loans
F) Non-occupant Loans on < 5 Family Dwellings (A B C & D)
Number
Average Value
Number
Average Value
Number
Average Value
Number
Average Value
Number
Average Value
LOANS ORIGINATED
16
$568,602
43
$524,601
275
$410,501
12
$192,937
7
$378,973
APPLICATIONS APPROVED, NOT ACCEPTED
0
$0
1
$726,930
17
$409,332
0
$0
0
$0
APPLICATIONS DENIED
1
$535,740
3
$463,047
46
$495,540
1
$373,430
3
$350,190
APPLICATIONS WITHDRAWN
0
$0
10
$448,110
31
$406,447
2
$340,065
3
$277,827
FILES CLOSED FOR INCOMPLETENESS
0
$0
2
$339,570
6
$498,563
1
$398,320
0
$0
Aggregated Statistics For Year 2008 (Based on 2 partial tracts)
A) FHA, FSA/RHS & VA Home Purchase Loans
B) Conventional Home Purchase Loans
C) Refinancings
D) Home Improvement Loans
F) Non-occupant Loans on < 5 Family Dwellings (A B C & D)
Number
Average Value
Number
Average Value
Number
Average Value
Number
Average Value
Number
Average Value
LOANS ORIGINATED
3
$580,883
63
$581,690
74
$419,945
11
$209,208
3
$397,657
APPLICATIONS APPROVED, NOT ACCEPTED
0
$0
2
$262,395
7
$309,267
0
$0
2
$336,580
APPLICATIONS DENIED
0
$0
7
$764,633
16
$494,975
4
$169,285
0
$0
APPLICATIONS WITHDRAWN
0
$0
13
$473,542
17
$407,692
4
$116,260
0
$0
FILES CLOSED FOR INCOMPLETENESS
0
$0
0
$0
2
$444,125
1
$99,580
0
$0
Aggregated Statistics For Year 2007 (Based on 2 partial tracts)
B) Conventional Home Purchase Loans
C) Refinancings
D) Home Improvement Loans
F) Non-occupant Loans on < 5 Family Dwellings (A B C & D)
Number
Average Value
Number
Average Value
Number
Average Value
Number
Average Value
LOANS ORIGINATED
97
$478,497
85
$382,973
16
$165,925
10
$553,864
APPLICATIONS APPROVED, NOT ACCEPTED
8
$511,344
16
$306,084
3
$165,967
1
$211,110
APPLICATIONS DENIED
2
$302,725
20
$626,906
3
$87,300
3
$666,190
APPLICATIONS WITHDRAWN
9
$465,370
13
$313,677
0
$0
1
$234,010
FILES CLOSED FOR INCOMPLETENESS
1
$1,314,460
4
$487,942
0
$0
0
$0
Aggregated Statistics For Year 2006 (Based on 2 partial tracts)
B) Conventional Home Purchase Loans
C) Refinancings
D) Home Improvement Loans
F) Non-occupant Loans on < 5 Family Dwellings (A B C & D)
Number
Average Value
Number
Average Value
Number
Average Value
Number
Average Value
LOANS ORIGINATED
111
$417,061
79
$396,114
25
$190,835
7
$360,196
APPLICATIONS APPROVED, NOT ACCEPTED
3
$579,887
10
$329,211
4
$67,218
0
$0
APPLICATIONS DENIED
3
$363,467
9
$335,142
3
$97,920
1
$434,170
APPLICATIONS WITHDRAWN
4
$379,150
18
$405,788
4
$141,902
0
$0
FILES CLOSED FOR INCOMPLETENESS
0
$0
4
$343,550
0
$0
0
$0
Aggregated Statistics For Year 2005 (Based on 2 partial tracts)
B) Conventional Home Purchase Loans
C) Refinancings
D) Home Improvement Loans
F) Non-occupant Loans on < 5 Family Dwellings (A B C & D)
Number
Average Value
Number
Average Value
Number
Average Value
Number
Average Value
LOANS ORIGINATED
101
$478,398
119
$334,915
18
$207,624
13
$230,872
APPLICATIONS APPROVED, NOT ACCEPTED
6
$474,665
14
$352,726
2
$499,395
0
$0
APPLICATIONS DENIED
11
$372,157
19
$366,402
2
$479,480
3
$410,600
APPLICATIONS WITHDRAWN
2
$338,075
18
$327,563
6
$477,487
1
$219,080
FILES CLOSED FOR INCOMPLETENESS
0
$0
9
$347,202
1
$179,240
0
$0
Aggregated Statistics For Year 2004 (Based on 2 partial tracts)
B) Conventional Home Purchase Loans
C) Refinancings
D) Home Improvement Loans
F) Non-occupant Loans on < 5 Family Dwellings (A B C & D)
G) Loans On Manufactured Home Dwelling (A B C & D)
Number
Average Value
Number
Average Value
Number
Average Value
Number
Average Value
Number
Average Value
LOANS ORIGINATED
110
$385,728
174
$296,514
13
$256,687
14
$364,391
0
$0
APPLICATIONS APPROVED, NOT ACCEPTED
9
$236,669
16
$251,004
4
$141,652
1
$298,740
3
$32,197
APPLICATIONS DENIED
10
$257,116
19
$273,635
2
$42,320
2
$323,135
4
$21,410
APPLICATIONS WITHDRAWN
6
$404,460
21
$337,529
5
$170,680
0
$0
0
$0
FILES CLOSED FOR INCOMPLETENESS
1
$597,480
4
$258,660
0
$0
1
$169,290
0
$0
Aggregated Statistics For Year 2003 (Based on 2 partial tracts)
B) Conventional Home Purchase Loans
C) Refinancings
D) Home Improvement Loans
F) Non-occupant Loans on < 5 Family Dwellings (A B C & D)
Number
Average Value
Number
Average Value
Number
Average Value
Number
Average Value
LOANS ORIGINATED
118
$336,133
539
$260,174
8
$52,030
19
$238,677
APPLICATIONS APPROVED, NOT ACCEPTED
11
$370,256
58
$267,046
1
$49,790
1
$90,620
APPLICATIONS DENIED
6
$305,710
22
$326,260
3
$101,240
2
$176,755
APPLICATIONS WITHDRAWN
5
$353,908
33
$270,164
1
$21,910
1
$764,770
FILES CLOSED FOR INCOMPLETENESS
0
$0
8
$315,544
0
$0
1
$697,060
Aggregated Statistics For Year 1999 (Based on 1 partial tract)
A) FHA, FSA/RHS & VA Home Purchase Loans
B) Conventional Home Purchase Loans
C) Refinancings
D) Home Improvement Loans
F) Non-occupant Loans on < 5 Family Dwellings (A B C & D)


 Nearest zip codes: 22046, 22205, 22043, 22044, 22207, 22101.