Estimated zip code population in 2022: 14,138 Zip code population in 2010: 14,092 Zip code population in 2000: 13,109
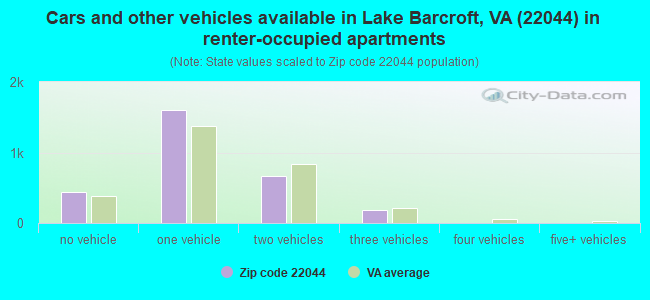
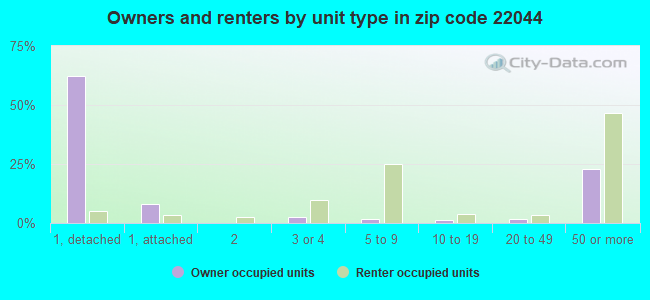
Houses and condos: 5,684 Renter-occupied apartments: 2,868
% of renters here:
52%
State:
33%
March 2022 cost of living index in zip code 22044: 170.3 (very high, U.S. average is 100)
Land area: 2.2 sq. mi. Water area: 0.1 sq. mi.
Population density: 6,461 people per square mile
(high).
OSM Map
General Map
Google Map
MSN Map
OSM Map
General Map
Google Map
MSN Map
OSM Map
General Map
Google Map
MSN Map
OSM Map
General Map
Google Map
MSN Map
Please wait while loading the map...
Real estate property taxes paid for housing units in 2022:
This zip code:
1.0% ($7,291)
Virginia:
0.7% ($2,617)
Median real estate property taxes paid for housing units with mortgages in 2022: $7,558 (1.0%) Median real estate property taxes paid for housing units with no mortgage in 2022: $6,833 (1.0%)
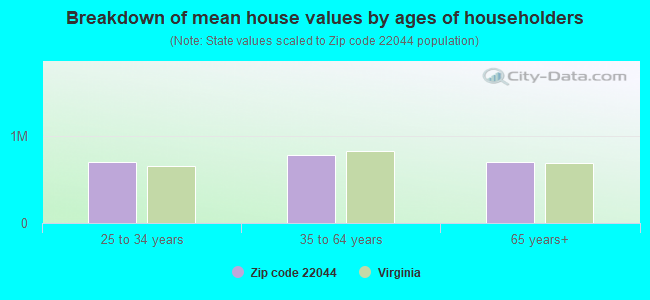
Estimated median house/condo value in 2022: $766,485
22044:
$766,485
Virginia:
$365,700
According to our research of Virginia and other state lists, there were 7 registered sex offenders living in 22044 zip code as of April 27, 2024. The ratio of all residents to sex offenders in zip code 22044 is 1,932 to 1. The ratio of registered sex offenders to all residents in this zip code is much lower than the state average.
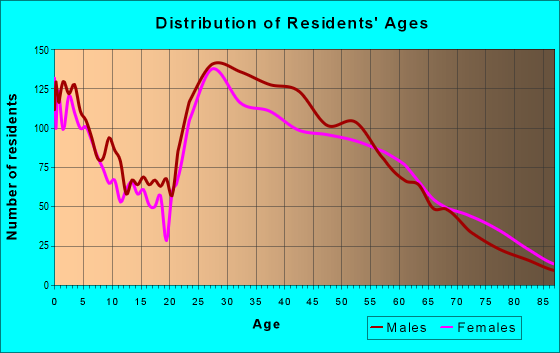
Median resident age:
This zip code:
36.8 years
Virginia median age:
39.0 years
Average household size:
This zip code:
2.5 people
Virginia:
2.5 people
Averages for the 2020 tax year for zip code 22044, filed in 2021:
Average Adjusted Gross Income (AGI) in 2020: $91,027 (Individual Income Tax Returns)
Here:
$91,027
State:
$86,446
Salary/wage: $79,406 (reported on 76.7% of returns)
Here:
$79,406
State:
$71,185
(% of AGI for various income ranges: 1288.7% for AGIs below $25k, 3960.0% for AGIs $25k-50k, 7209.5% for AGIs $50k-75k, 10043.1% for AGIs $75k-100k, 17739.8% for AGIs $100k-200k, 81054.6% for AGIs over 200k)
Taxable interest for individuals: $1,729 (reported on 31.1% of returns)
This zip code:
$1,729
Virginia:
$1,805
(% of AGI for various income ranges: 10.0% for AGIs below $25k, 17.4% for AGIs $25k-50k, 35.1% for AGIs $50k-75k, 90.0% for AGIs $75k-100k, 172.5% for AGIs $100k-200k, 835.8% for AGIs over 200k)
Ordinary dividends: $10,042 (reported on 24.5% of returns)
Here:
$10,042
State:
$8,327
(% of AGI for various income ranges: 22.7% for AGIs below $25k, 37.4% for AGIs $25k-50k, 96.6% for AGIs $50k-75k, 250.6% for AGIs $75k-100k, 766.7% for AGIs $100k-200k, 4566.2% for AGIs over 200k)
Net capital gain/loss in AGI: +$18,859 (reported on 23.1% of returns)
Here:
+$18,859
State:
+$24,644
(% of AGI for various income ranges: 26.6% for AGIs below $25k, 30.6% for AGIs $25k-50k, 81.8% for AGIs $50k-75k, 156.6% for AGIs $75k-100k, 865.0% for AGIs $100k-200k, 9900.4% for AGIs over 200k)
Profit/loss from business: +$13,843 (reported on 28.2% of returns)
Here:
+$13,843
State:
+$12,836
(% of AGI for various income ranges: 488.5% for AGIs below $25k, 355.9% for AGIs $25k-50k, 230.2% for AGIs $50k-75k, 241.4% for AGIs $75k-100k, 964.6% for AGIs $100k-200k, 4088.3% for AGIs over 200k)
Taxable individual retirement arrangement distribution: $28,245 (reported on 6.2% of returns)
22044:
$28,245
Virginia:
$21,535
(% of AGI for various income ranges: 26.9% for AGIs below $25k, 43.5% for AGIs $25k-50k, 84.8% for AGIs $50k-75k, 234.6% for AGIs $75k-100k, 767.3% for AGIs $100k-200k, 2526.2% for AGIs over 200k)
Self-employed (Keogh) retirement plans: $35,380 (reported on 1.5% of returns)
22044:
$35,380
Virginia:
$31,172
(% of AGI for various income ranges: 91.9% for AGIs $100k-200k, 1290.4% for AGIs over 200k)
Total itemized deductions: $33,877 (reported on 16.6% of returns)
Here:
$33,877
State:
$33,287
(% of AGI for various income ranges: 61.8% for AGIs below $25k, 133.6% for AGIs $25k-50k, 419.2% for AGIs $50k-75k, 916.3% for AGIs $75k-100k, 2101.9% for AGIs $100k-200k, 8462.1% for AGIs over 200k)
Charity contributions: $8,923 (reported on 13.7% of returns)
Here:
$8,923
State:
$10,381
(% of AGI for various income ranges: 24.5% for AGIs $25k-50k, 52.5% for AGIs $50k-75k, 104.6% for AGIs $75k-100k, 353.5% for AGIs $100k-200k, 2364.6% for AGIs over 200k)
Taxes paid: $8,849 (reported on 16.6% of returns)
22044:
$8,849
State:
$8,284
(% of AGI for various income ranges: 14.0% for AGIs below $25k, 30.1% for AGIs $25k-50k, 112.3% for AGIs $50k-75k, 271.4% for AGIs $75k-100k, 645.2% for AGIs $100k-200k, 1995.4% for AGIs over 200k)
Earned income credit: $2,133 (reported on 14.1% of returns)
Here:
$2,133
State:
$2,214
(% of AGI for various income ranges: 106.0% for AGIs below $25k, 67.3% for AGIs $25k-50k)
Percentage of individuals using paid preparers for their 2020 taxes: 88.4%
Here:
88%
State:
92%
(% for various income ranges: 83.8% for AGIs below $25k, 91.1% for AGIs $25k-50k, 91.8% for AGIs $50k-75k, 90.7% for AGIs $75k-100k, 89.8% for AGIs $100k-200k, 91.0% for AGIs over 200k)
Averages for the 2012 tax year for zip code 22044, filed in 2013:
Average Adjusted Gross Income (AGI) in 2012: $79,402 (Individual Income Tax Returns)
Here:
$79,402
State:
$71,192
Salary/wage: $68,090 (reported on 82.1% of returns)
Here:
$68,090
State:
$59,229
(% of AGI for various income ranges: 76.2% for AGIs below $25k, 86.5% for AGIs $25k-50k, 81.7% for AGIs $50k-75k, 74.1% for AGIs $75k-100k, 74.5% for AGIs $100k-200k, 61.0% for AGIs over 200k)
Taxable interest for individuals: $1,819 (reported on 34.6% of returns)
This zip code:
$1,819
Virginia:
$1,600
(% of AGI for various income ranges: 0.7% for AGIs below $25k, 0.5% for AGIs $25k-50k, 0.7% for AGIs $50k-75k, 0.8% for AGIs $75k-100k, 1.0% for AGIs $100k-200k, 0.8% for AGIs over 200k)
Ordinary dividends: $7,897 (reported on 23.0% of returns)
Here:
$7,897
State:
$6,959
(% of AGI for various income ranges: 0.8% for AGIs below $25k, 0.6% for AGIs $25k-50k, 1.6% for AGIs $50k-75k, 2.0% for AGIs $75k-100k, 2.7% for AGIs $100k-200k, 2.8% for AGIs over 200k)
Net capital gain/loss in AGI: +$10,310 (reported on 19.5% of returns)
Here:
+$10,310
State:
+$16,672
(% of AGI for various income ranges: 0.3% for AGIs below $25k, 0.3% for AGIs $25k-50k, 0.5% for AGIs $50k-75k, 0.2% for AGIs $75k-100k, 1.2% for AGIs $100k-200k, 4.9% for AGIs over 200k)
Profit/loss from business: +$19,438 (reported on 22.2% of returns)
Here:
+$19,438
State:
+$14,116
(% of AGI for various income ranges: 19.9% for AGIs below $25k, 4.9% for AGIs $25k-50k, 3.2% for AGIs $50k-75k, 3.6% for AGIs $75k-100k, 3.4% for AGIs $100k-200k, 5.5% for AGIs over 200k)
Taxable individual retirement arrangement distribution: $26,606 (reported on 7.5% of returns)
22044:
$26,606
Virginia:
$16,667
(% of AGI for various income ranges: 0.9% for AGIs below $25k, 1.2% for AGIs $25k-50k, 1.5% for AGIs $50k-75k, 2.1% for AGIs $75k-100k, 2.3% for AGIs $100k-200k, 3.4% for AGIs over 200k)
Self-employment retirement plans: $28,142 (reported on 1.8% of returns)
22044:
$28,142
Virginia:
$25,373
Total itemized deductions: $29,930 (19% of AGI, reported on 39.2% of returns)
Here:
$29,930
State:
$26,596
Here:
19.3% of AGI
State:
20.1% of AGI
(% of AGI for various income ranges: 9.7% for AGIs below $25k, 13.9% for AGIs $25k-50k, 13.5% for AGIs $50k-75k, 14.5% for AGIs $75k-100k, 17.8% for AGIs $100k-200k, 14.3% for AGIs over 200k)
Charity contributions: $4,453 (reported on 30.8% of returns)
Here:
$4,453
State:
$4,443
(% of AGI for various income ranges: 0.4% for AGIs below $25k, 1.0% for AGIs $25k-50k, 1.3% for AGIs $50k-75k, 1.6% for AGIs $75k-100k, 1.9% for AGIs $100k-200k, 2.1% for AGIs over 200k)
Taxes paid: $12,739 (reported on 38.9% of returns)
22044:
$12,739
State:
$9,951
(% of AGI for various income ranges: 1.4% for AGIs below $25k, 2.5% for AGIs $25k-50k, 4.0% for AGIs $50k-75k, 5.2% for AGIs $75k-100k, 7.5% for AGIs $100k-200k, 7.7% for AGIs over 200k)
Earned income credit: $2,163 (reported on 15.6% of returns)
Here:
$2,163
State:
$2,211
(% of AGI for various income ranges: 5.7% for AGIs below $25k, 0.9% for AGIs $25k-50k)
Percentage of individuals using paid preparers for their 2012 taxes: 54.7%
Here:
55%
State:
46%
(% for various income ranges: 58.1% for AGIs below $25k, 56.9% for AGIs $25k-50k, 48.0% for AGIs $50k-75k, 51.1% for AGIs $75k-100k, 47.3% for AGIs $100k-200k, 57.1% for AGIs over 200k)
Averages for the 2004 tax year for zip code 22044, filed in 2005:
Average Adjusted Gross Income (AGI) in 2004: $65,007 (Individual Income Tax Returns)
Here:
$65,007
State:
$56,704
Salary/wage: $56,784 (reported on 83.2% of returns)
Here:
$56,784
State:
$48,441
(% of AGI for various income ranges: 98.6% for AGIs below $10k, 79.3% for AGIs $10k-25k, 88.3% for AGIs $25k-50k, 79.3% for AGIs $50k-75k, 73.8% for AGIs $75k-100k, 66.2% for AGIs over 100k)
Taxable interest for individuals: $2,221 (reported on 45.3% of returns)
This zip code:
$2,221
Virginia:
$1,688
(% of AGI for various income ranges: 2.6% for AGIs below $10k, 1.0% for AGIs $10k-25k, 1.0% for AGIs $25k-50k, 1.5% for AGIs $50k-75k, 2.4% for AGIs $75k-100k, 1.6% for AGIs over 100k)
Taxable dividends: $5,277 (reported on 29.2% of returns)
Here:
$5,277
State:
$4,028
(% of AGI for various income ranges: 3.7% for AGIs below $10k, 1.1% for AGIs $10k-25k, 0.8% for AGIs $25k-50k, 1.7% for AGIs $50k-75k, 2.1% for AGIs $75k-100k, 3.0% for AGIs over 100k)
Net capital gain/loss: +$10,517 (reported on 24.6% of returns)
Here:
+$10,517
State:
+$14,375
(% of AGI for various income ranges: -1.2% for AGIs below $10k, -0.0% for AGIs $10k-25k, 0.5% for AGIs $25k-50k, 0.6% for AGIs $50k-75k, 1.1% for AGIs $75k-100k, 6.5% for AGIs over 100k)
Profit/loss from business: +$17,128 (reported on 18.2% of returns)
Here:
+$17,128
State:
+$13,342
(% of AGI for various income ranges: 28.6% for AGIs below $10k, 13.2% for AGIs $10k-25k, 2.8% for AGIs $25k-50k, 3.0% for AGIs $50k-75k, 3.4% for AGIs $75k-100k, 4.6% for AGIs over 100k)
IRA payment deduction: $2,817 (reported on 2.3% of returns)
22044:
$2,817
Virginia:
$2,943
(% of AGI for various income ranges: 0.3% for AGIs $10k-25k, 0.2% for AGIs $25k-50k, 0.2% for AGIs $50k-75k, 0.1% for AGIs $75k-100k, 0.0% for AGIs over 100k)
Self-employed pension: $21,927 (reported on 2.0% of returns)
Here:
$21,927
Virginia:
$17,430
Total itemized deductions: $23,174 (21% of AGI, reported on 44.8% of returns)
Here:
$23,174
State:
$21,492
Here:
20.8% of AGI
State:
21.0% of AGI
(% of AGI for various income ranges: 11.6% for AGIs below $10k, 13.3% for AGIs $10k-25k, 15.3% for AGIs $25k-50k, 16.3% for AGIs $50k-75k, 17.4% for AGIs $75k-100k, 16.2% for AGIs over 100k)
Charity contributions deductions: $3,578 (3% of AGI, reported on 38.5% of returns)
Here:
$3,578
State:
$3,794
Here:
3.0% of AGI
State:
3.5% of AGI
(% of AGI for various income ranges: 0.6% for AGIs below $10k, 1.3% for AGIs $10k-25k, 1.6% for AGIs $25k-50k, 1.8% for AGIs $50k-75k, 2.2% for AGIs $75k-100k, 2.4% for AGIs over 100k)
Total tax: $12,195 (reported on 82.5% of returns)
22044:
$12,195
State:
$9,537
(% of AGI for various income ranges: 6.7% for AGIs below $10k, 5.2% for AGIs $10k-25k, 7.8% for AGIs $25k-50k, 11.4% for AGIs $50k-75k, 13.0% for AGIs $75k-100k, 19.8% for AGIs over 100k)
Earned income credit: $1,754 (reported on 12.5% of returns)
Here:
$1,754
State:
$1,734
Percentage of individuals using paid preparers for their 2004 taxes: 58.7%
Here:
59%
State:
52%
(% for various income ranges: 60.1% for AGIs below $10k, 69.6% for AGIs $10k-25k, 58.9% for AGIs $25k-50k, 54.5% for AGIs $50k-75k, 49.2% for AGIs $75k-100k, 50.3% for AGIs over 100k)
Likely homosexual households (counted as self-reported same-sex unmarried-partner households)
Lesbian couples: 0.0% of all households
Gay men: 0.2% of all households
Household received Food Stamps/SNAP in the past 12 months: 855 Household did not receive Food Stamps/SNAP in the past 12 months: 4,689
Women who had a birth in the past 12 months: 237 (216 now married, 24 unmarried) Women who did not have a birth in the past 12 months: 2,848 (1,126 now married, 1,725 unmarried)
Housing units in zip code 22044 with a mortgage: 1,687 (222 second mortgage, 178 both second mortgage and home equity loan) Houses without a mortgage: 22
Median monthly owner costs for units with a mortgage: $2,951 Median monthly owner costs for units without a mortgage: $1,069
Residents with income below the poverty level in 2022:
This zip code:
16.1%
Whole state:
10.6%
Residents with income below 50% of the poverty level in 2022:
This zip code:
11.5%
Whole state:
5.2%
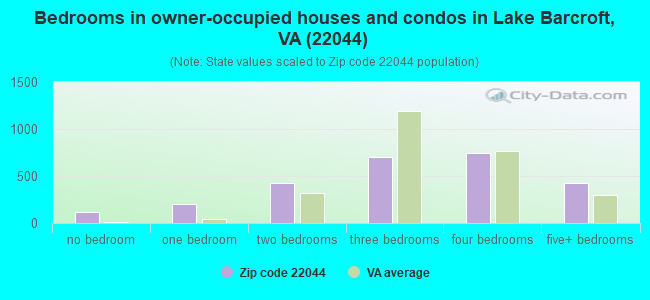
Median number of rooms in houses and condos:
Here:
7.8
State:
7.0
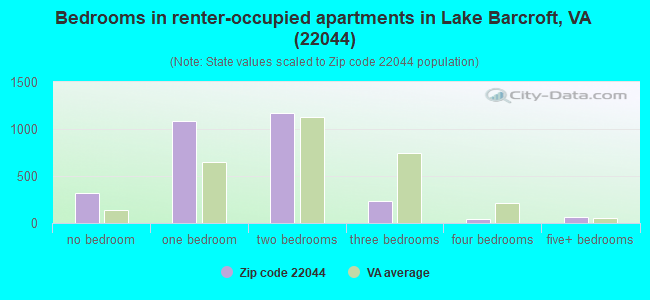
Median number of rooms in apartments:
Here:
3.4
State:
4.3
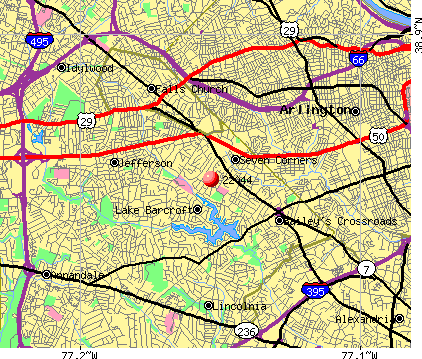
Notable locations in this zip code not listed on our city pages
Notable locations in zip code 22044: Fairfax County Fire and Rescue Department Station 28 Seven Corners (A), Shelter House (B). Display/hide their locations on the map
Shopping Centers: Seven Corners Shopping Center (1), The Corners at Seven Corners Shopping Center (2), Plaza Seven Shopping Center (3). Display/hide their locations on the map
Churches in zip code 22044 include: Iglesia Methodist United (A), Falls Church First Christian Church (B), Epworth Methodist Church (C). Display/hide their locations on the map
2,137 married couples with children.
879 single-parent households (147 men, 732 women).
52.7% of residents of 22044 zip code speak English at home.
24.0% of residents speak Spanish at home (56% very well, 16% well, 20% not well, 7% not at all).
4.8% of residents speak other Indo-European language at home (69% very well, 29% well, 2% not well).
13.4% of residents speak Asian or Pacific Island language at home (41% very well, 21% well, 31% not well, 6% not at all).
5.3% of residents speak other language at home (90% very well, 7% well, 3% not well).
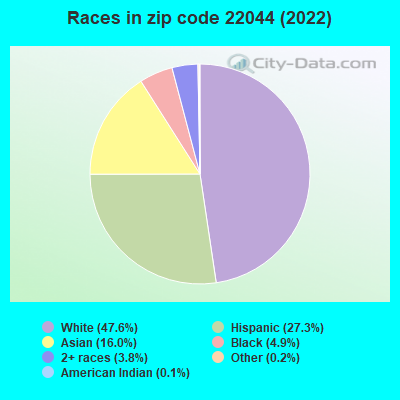
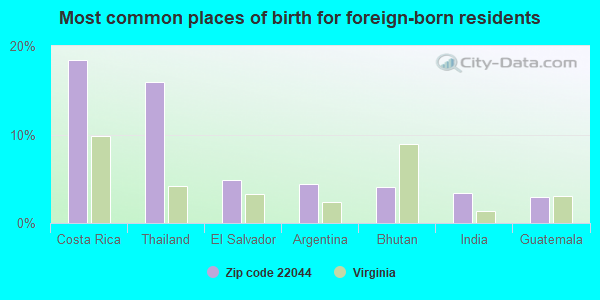
Foreign born population: 5,064 (35.8%) (57.7% of them are naturalized citizens)
This zip code:
35.8%
Whole state:
12.7%
18%Costa Rica
16%Thailand
5%El Salvador
4%Argentina
4%Bhutan
3%India
3%Guatemala
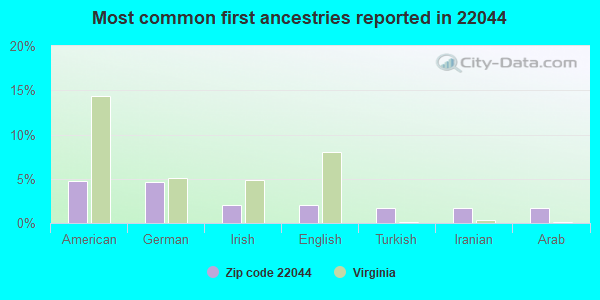
5%American
5%German
2%Irish
2%English
2%Turkish
2%Iranian
2%Arab
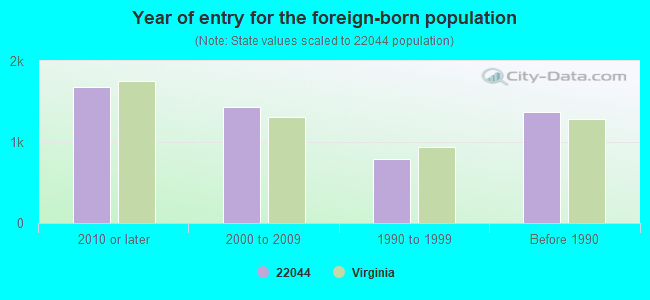
Year of entry for the foreign-born population
1,6842010 or later
1,4292000 to 2009
7921990 to 1999
1,371Before 1990
Facilities with environmental interests located in this zip code:
AMERICAN SECURITY & CONTROL, INC. (ASC) (450 W. BROAD ST., SUITE 116 in FALLS CHURCH, VA)
(Integrated Compliance Information System) - ICIS-HQ-2002-5058, FORMAL ENFORCEMENT ACTION
CARDIOVASCULAR CENTER OF NO VA (6045 ARLINGTON BLVD in FALLS CHURCH, VA)
Small Quantity Generators, between 100 kg and 1000 kg of hazardous waste/month (Resource Conservation and Recovery Act (tracking hazardous waste)) - notification Organizations: OPERNAME (CONTACT/OPERATOR)
7 CORNERS AUTO BODY (6307 ARLINGTON BOULEVARD in FALLS CHURCH, VA)
Small Quantity Generators, between 100 kg and 1000 kg of hazardous waste/month (Resource Conservation and Recovery Act (tracking hazardous waste)) - notification Organizations: DOUG SORENSEN (CONTACT/OWNER)
Housing units lacking complete plumbing facilities: 0.5% Housing units lacking complete kitchen facilities: 0.6%
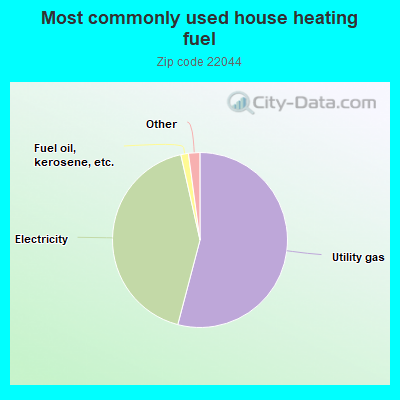
54.1%Utility gas
42.4%Electricity
1.4%Fuel oil, kerosene, etc.
1.0%Bottled, tank, or LP gas
0.7%Other fuel
Population in 1990: 10,100. Population change in the 1990s: +3,009 (+29.8%).
Place of birth for U.S.-born residents:
This state: 3,486
Northeast: 1,282
Midwest: 834
South: 2,634
West: 687
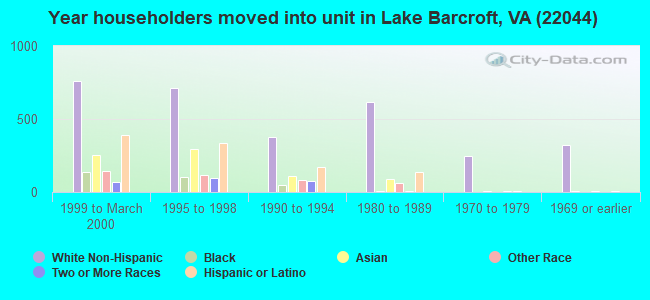
50% of the 22044 zip code residents lived in the same house 5 years ago. Out of people who lived in different houses, 37% lived in this county. Out of people who lived in different counties, 50% lived in Virginia.
84% of the 22044 zip code residents lived in the same house 1 year ago. Out of people who lived in different houses, 28% moved from this county. Out of people who lived in different houses, 28% moved from different county within same state. Out of people who lived in different houses, 29% moved from different state. Out of people who lived in different houses, 15% moved from abroad.
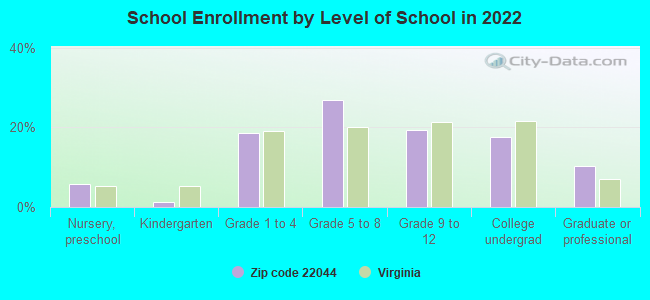
Private vs. public school enrollment:
Students in private schools in grades 1 to 8 (elementary and middle school): 330
Here:
22.7%
Virginia:
13.2%
Students in private schools in grades 9 to 12 (high school): 157
Here:
25.5%
Virginia:
10.2%
Students in private undergraduate colleges: 111
Here:
19.8%
Virginia:
18.7%
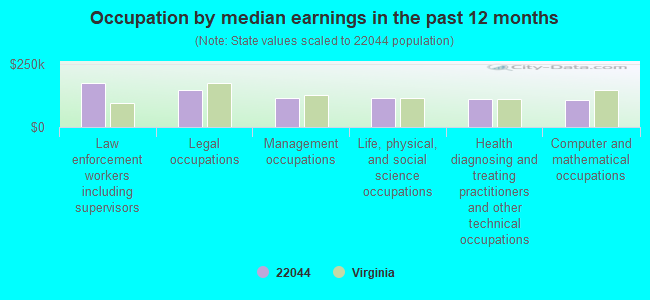
Occupation by median earnings in the past 12 months ($)
171,974Law enforcement workers including supervisors
146,179Legal occupations
115,938Management occupations
114,734Life, physical, and social science occupations
111,481Health diagnosing and treating practitioners and other technical occupations
106,617Computer and mathematical occupations
Companies with federal contracts located in this zip code (FALLS CHURCH, VA):
ARMSTAR CORPORATION (3122 PATRICK HENRY DR; small business) : $735,396 in 37 contractsfrom 2002 to 2006
Contracts for Guns, through 30 mm, Bushings, Rings, Shims, and Spacers, O-Ring, Bolts, and moreby Defense Logistics Agency Signed by year:2000: $0; 2001: $0; 2002: $59,219; 2003: $61,501; 2004: $243,940; 2005: $281,898; 2006: $88,838.
Biggest contracts:
$68,843 with Defense Logistics Agency for Guns, through 30 mm. Signed on 2004-11-29. Completion date: 2005-03-01.
$61,501, same as above.Signed on 2003-12-23. Completion date: 2004-01-27.
$58,448, same as above.Signed on 2005-03-04. Completion date: 2005-06-01.
$51,434, same as above.Signed on 2004-11-01. Completion date: 2005-02-02.
ADVANCED CONCEPTS ANALYSIS, IN (6353 CROSSWOODS DRIVE; small business) : $249,851 in 3 contractsfrom 2000 to 2003
$200,000 with Navy for Other Defense -- Applied Research and Exploratory Development (R&D). Signed on 2002-03-07. Completion date: 2004-03-14.
$29,851 with Army for Other Research and Development -- Basic Research (R&D). Signed on 2000-05-24. Completion date: 2000-09-30.
$20,000 with Navy for Other Defense -- Advanced Development (R&D). Signed on 2003-07-10. Completion date: 2004-03-14.
ALAMO FLAG COMPANY INC (6134-R ARLINGTON BLVD; small business) : $246,044 in 10 contractsfrom 2002 to 2006
Contracts for Training/Curriculum Development, Flags and Pennants, Miscellaneous Items, Maintenance, Repair or Alteration of Real Property -- Family Housing Facilities by Army, Department of State, Department of Veterans Affairs, Assistant Secretary for Administration, and others Signed by year:2000: $0; 2001: $0; 2002: $52,000; 2003: $3; 2004: $22,250; 2005: $141,913; 2006: $29,878.
Biggest contracts:
$137,663 with Army for Training/Curriculum Development. Signed on 2005-09-26. Effective on 2005-09-27. Completion date: 2006-09-26.
$34,000 with Department of State for Flags and Pennants. Taking place in DC. Signed on 2002-08-15. Completion date: 2002-09-15.
$27,035 with Army for Training/Curriculum Development. Signed on 2006-06-05. Effective on 2006-06-02. Completion date: 2006-09-26.
$18,000 with Department of Veterans Affairs for Flags and Pennants. Signed on 2002-09-15. Completion date: 2002-11-15.
JAIN, PRAVIN C (3134 JUNIPER LN; small business) : $148,000 in 3 contractsin 2005
$73,500 with Department of Defense for Other ADP and Telecommunications Services (includes data storage on tapes, compact disks, etc.). Signed on 2005-08-19. Completion date: 2006-02-17.
$50,000 with Department of Defense for Other Management Support Services. Signed on 2005-09-14. Completion date: 2005-11-15.
$24,500 with Department of Defense for Other ADP and Telecommunications Services (includes data storage on tapes, compact disks, etc.). Signed on 2005-06-13. Completion date: 2005-08-13.
VERTECH INC (6111 WOOTEN DRIVE; small business) : $60,000 in 2 contractsin 2004
$50,000 with Army for Defense Studies. Signed on 2004-09-02. Completion date: 2005-09-01.
$10,000 with Minerals Management Service for ADP Systems Development Services. Taking place in DC. Signed on 2004-03-23. Completion date: 2004-04-23.
SECURITY CORP OF VIRGINIA (6269 LEESBURG PIKE, SUITE; small business)
$57,510 with Army for Safety and Rescue Equipment. Signed on 2002-09-30. Completion date: 2002-12-02.
SUPER SUPPLIER LLC (6404 SEVEN CORNERS PL STE; small business)
$12,528 with Army for ADPE System Configuration. Signed on 2003-04-11. Completion date: 2003-04-18.
WALKER, ANNE GRAFFAM PHD (6404 CAVALIER CORRIDOR; small business) : $2,563 in 2 contractsin 2004
$3,000 with Army for Lectures For Training. Signed on 2004-01-09. Completion date: 2004-01-13.
-$437, same as above.Signed on 2004-03-02. Completion date: 2004-01-13.
Top industries in this zip code by the number of employees in 2005:
Professional, Scientific, and Technical Services: Human Resources and Executive Search Consulting Services (500-999 employees: 1 establishment)
Administrative and Support and Waste Management and Remediation Services: Janitorial Services (250-499: 1, 100-249: 1, 50-99: 1, 5-9: 1, 1-4: 3)
Health Care and Social Assistance: Offices of Physicians (except Mental Health Specialists) (20-49: 4, 10-19: 7, 5-9: 16, 1-4: 22)
2004 - 2018 National Fire Incident Reporting System (NFIRS) incidents
Based on the data from the years 2004 - 2018 the average number of fire incidents per year is 34. The highest number of fire incidents - 49 took place in 2010, and the least - 2 in 2004. The data has a growing trend.
When looking into fire subcategories, the most reports belonged to: Structure Fires (56.6%), and Outside Fires (28.8%).
Fire incident types reported to NFIRS in Zip Code 22044


 Nearest zip codes: 22041, 22205, 22213, 22046, 22203, 22311.
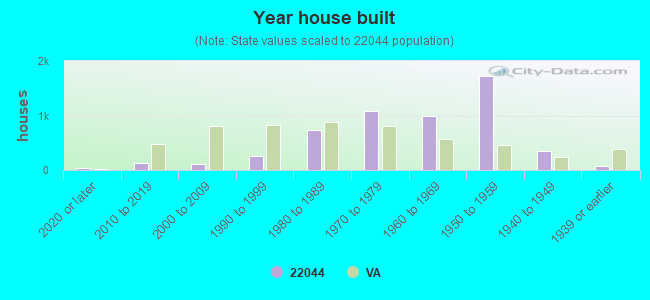


 Based on the data from the years 2004 - 2018 the average number of fire incidents per year is 34. The highest number of fire incidents - 49 took place in 2010, and the least - 2 in 2004. The data has a growing trend.
 When looking into fire subcategories, the most reports belonged to: Structure Fires (56.6%), and Outside Fires (28.8%).