Estimated zip code population in 2022: 29,331 Zip code population in 2010: 27,989 Zip code population in 2000: 26,966
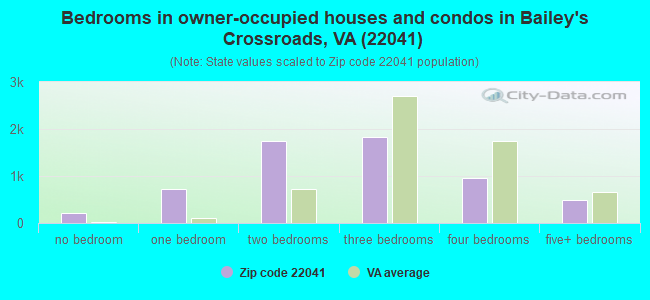
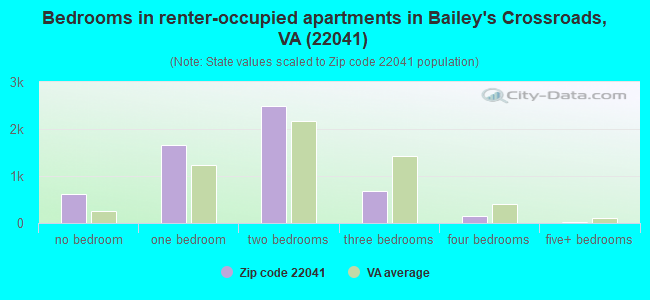
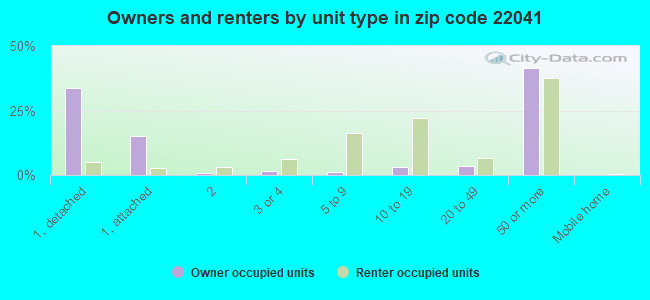
Houses and condos: 11,863 Renter-occupied apartments: 5,554
% of renters here:
48%
State:
33%
March 2022 cost of living index in zip code 22041: 164.8 (very high, U.S. average is 100)
Land area: 2.8 sq. mi. Water area: 0.1 sq. mi.
Population density: 10,512 people per square mile
(high).
OSM Map
General Map
Google Map
MSN Map
OSM Map
General Map
Google Map
MSN Map
OSM Map
General Map
Google Map
MSN Map
OSM Map
General Map
Google Map
MSN Map
Please wait while loading the map...
Real estate property taxes paid for housing units in 2022:
This zip code:
1.0% ($4,458)
Virginia:
0.7% ($2,617)
Median real estate property taxes paid for housing units with mortgages in 2022: $4,387 (0.9%) Median real estate property taxes paid for housing units with no mortgage in 2022: $4,645 (1.1%)
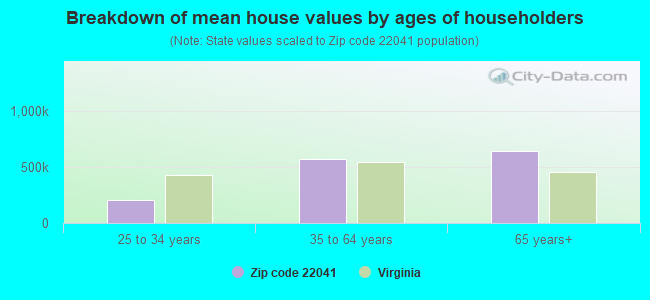
Estimated median house/condo value in 2022: $450,506
22041:
$450,506
Virginia:
$365,700
According to our research of Virginia and other state lists, there were 29 registered sex offenders living in 22041 zip code as of April 26, 2024. The ratio of all residents to sex offenders in zip code 22041 is 1,010 to 1. The ratio of registered sex offenders to all residents in this zip code is much lower than the state average.
Median resident age:
This zip code:
36.0 years
Virginia median age:
39.0 years
Average household size:
This zip code:
2.5 people
Virginia:
2.5 people
Averages for the 2020 tax year for zip code 22041, filed in 2021:
Average Adjusted Gross Income (AGI) in 2020: $72,073 (Individual Income Tax Returns)
Here:
$72,073
State:
$86,446
Salary/wage: $66,687 (reported on 70.9% of returns)
Here:
$66,687
State:
$71,185
(% of AGI for various income ranges: 1154.2% for AGIs below $25k, 3594.5% for AGIs $25k-50k, 7035.3% for AGIs $50k-75k, 9548.4% for AGIs $75k-100k, 16394.6% for AGIs $100k-200k, 65220.9% for AGIs over 200k)
Taxable interest for individuals: $1,697 (reported on 27.3% of returns)
This zip code:
$1,697
Virginia:
$1,805
(% of AGI for various income ranges: 11.6% for AGIs below $25k, 16.2% for AGIs $25k-50k, 45.1% for AGIs $50k-75k, 81.0% for AGIs $75k-100k, 216.1% for AGIs $100k-200k, 675.8% for AGIs over 200k)
Ordinary dividends: $9,357 (reported on 19.2% of returns)
Here:
$9,357
State:
$8,327
(% of AGI for various income ranges: 19.8% for AGIs below $25k, 42.2% for AGIs $25k-50k, 113.9% for AGIs $50k-75k, 261.7% for AGIs $75k-100k, 646.3% for AGIs $100k-200k, 3997.0% for AGIs over 200k)
Net capital gain/loss in AGI: +$20,662 (reported on 19.3% of returns)
Here:
+$20,662
State:
+$24,644
(% of AGI for various income ranges: 14.8% for AGIs below $25k, 24.8% for AGIs $25k-50k, 97.8% for AGIs $50k-75k, 194.0% for AGIs $75k-100k, 787.8% for AGIs $100k-200k, 13221.2% for AGIs over 200k)
Profit/loss from business: +$10,619 (reported on 32.6% of returns)
Here:
+$10,619
State:
+$12,836
(% of AGI for various income ranges: 641.3% for AGIs below $25k, 477.6% for AGIs $25k-50k, 321.3% for AGIs $50k-75k, 162.7% for AGIs $75k-100k, 601.5% for AGIs $100k-200k, 2697.6% for AGIs over 200k)
Taxable individual retirement arrangement distribution: $21,595 (reported on 6.7% of returns)
22041:
$21,595
Virginia:
$21,535
(% of AGI for various income ranges: 23.7% for AGIs below $25k, 63.7% for AGIs $25k-50k, 133.0% for AGIs $50k-75k, 276.6% for AGIs $75k-100k, 660.3% for AGIs $100k-200k, 2143.9% for AGIs over 200k)
Self-employed (Keogh) retirement plans: $32,370 (reported on 0.7% of returns)
22041:
$32,370
Virginia:
$31,172
(% of AGI for various income ranges: 78.1% for AGIs $100k-200k, 711.2% for AGIs over 200k)
Total itemized deductions: $31,391 (reported on 16.7% of returns)
Here:
$31,391
State:
$33,287
(% of AGI for various income ranges: 64.2% for AGIs below $25k, 238.4% for AGIs $25k-50k, 514.6% for AGIs $50k-75k, 1191.9% for AGIs $75k-100k, 2286.8% for AGIs $100k-200k, 7870.0% for AGIs over 200k)
Charity contributions: $7,258 (reported on 13.3% of returns)
Here:
$7,258
State:
$10,381
(% of AGI for various income ranges: 4.1% for AGIs below $25k, 28.8% for AGIs $25k-50k, 76.5% for AGIs $50k-75k, 167.4% for AGIs $75k-100k, 378.9% for AGIs $100k-200k, 1944.2% for AGIs over 200k)
Taxes paid: $8,137 (reported on 16.6% of returns)
22041:
$8,137
State:
$8,284
(% of AGI for various income ranges: 11.9% for AGIs below $25k, 49.2% for AGIs $25k-50k, 131.3% for AGIs $50k-75k, 338.7% for AGIs $75k-100k, 670.2% for AGIs $100k-200k, 1781.2% for AGIs over 200k)
Earned income credit: $2,291 (reported on 16.7% of returns)
Here:
$2,291
State:
$2,214
(% of AGI for various income ranges: 126.5% for AGIs below $25k, 88.8% for AGIs $25k-50k, 1.1% for AGIs $50k-75k)
Percentage of individuals using paid preparers for their 2020 taxes: 86.7%
Here:
87%
State:
92%
(% for various income ranges: 80.9% for AGIs below $25k, 90.6% for AGIs $25k-50k, 89.2% for AGIs $50k-75k, 90.5% for AGIs $75k-100k, 90.5% for AGIs $100k-200k, 89.6% for AGIs over 200k)
Averages for the 2012 tax year for zip code 22041, filed in 2013:
Average Adjusted Gross Income (AGI) in 2012: $60,626 (Individual Income Tax Returns)
Here:
$60,626
State:
$71,192
Salary/wage: $54,246 (reported on 78.1% of returns)
Here:
$54,246
State:
$59,229
(% of AGI for various income ranges: 71.5% for AGIs below $25k, 84.5% for AGIs $25k-50k, 80.4% for AGIs $50k-75k, 74.8% for AGIs $75k-100k, 69.8% for AGIs $100k-200k, 53.7% for AGIs over 200k)
Taxable interest for individuals: $1,638 (reported on 30.4% of returns)
This zip code:
$1,638
Virginia:
$1,600
(% of AGI for various income ranges: 0.7% for AGIs below $25k, 0.5% for AGIs $25k-50k, 0.6% for AGIs $50k-75k, 0.9% for AGIs $75k-100k, 0.9% for AGIs $100k-200k, 1.1% for AGIs over 200k)
Ordinary dividends: $8,703 (reported on 18.3% of returns)
Here:
$8,703
State:
$6,959
(% of AGI for various income ranges: 1.0% for AGIs below $25k, 0.8% for AGIs $25k-50k, 1.3% for AGIs $50k-75k, 2.4% for AGIs $75k-100k, 2.8% for AGIs $100k-200k, 4.7% for AGIs over 200k)
Net capital gain/loss in AGI: +$10,754 (reported on 15.1% of returns)
Here:
+$10,754
State:
+$16,672
(% of AGI for various income ranges: 0.3% for AGIs $50k-75k, 0.5% for AGIs $75k-100k, 1.7% for AGIs $100k-200k, 8.3% for AGIs over 200k)
Profit/loss from business: +$13,236 (reported on 23.9% of returns)
Here:
+$13,236
State:
+$14,116
(% of AGI for various income ranges: 24.1% for AGIs below $25k, 5.9% for AGIs $25k-50k, 2.7% for AGIs $50k-75k, 2.2% for AGIs $75k-100k, 2.8% for AGIs $100k-200k, 4.4% for AGIs over 200k)
Taxable individual retirement arrangement distribution: $18,719 (reported on 7.7% of returns)
22041:
$18,719
Virginia:
$16,667
(% of AGI for various income ranges: 1.0% for AGIs below $25k, 1.1% for AGIs $25k-50k, 1.3% for AGIs $50k-75k, 2.4% for AGIs $75k-100k, 2.9% for AGIs $100k-200k, 3.4% for AGIs over 200k)
Self-employment retirement plans: $22,608 (reported on 0.9% of returns)
22041:
$22,608
Virginia:
$25,373
(% of AGI for various income ranges: 0.3% for AGIs $25k-50k, 0.2% for AGIs $100k-200k, 0.9% for AGIs over 200k)
Total itemized deductions: $24,654 (22% of AGI, reported on 38.6% of returns)
Here:
$24,654
State:
$26,596
Here:
22.3% of AGI
State:
20.1% of AGI
(% of AGI for various income ranges: 9.6% for AGIs below $25k, 14.6% for AGIs $25k-50k, 15.5% for AGIs $50k-75k, 17.3% for AGIs $75k-100k, 17.8% for AGIs $100k-200k, 15.3% for AGIs over 200k)
Charity contributions: $3,623 (reported on 30.2% of returns)
Here:
$3,623
State:
$4,443
(% of AGI for various income ranges: 0.5% for AGIs below $25k, 1.1% for AGIs $25k-50k, 1.5% for AGIs $50k-75k, 2.2% for AGIs $75k-100k, 2.2% for AGIs $100k-200k, 2.1% for AGIs over 200k)
Taxes paid: $8,695 (reported on 38.4% of returns)
22041:
$8,695
State:
$9,951
(% of AGI for various income ranges: 1.4% for AGIs below $25k, 2.7% for AGIs $25k-50k, 4.3% for AGIs $50k-75k, 5.7% for AGIs $75k-100k, 6.9% for AGIs $100k-200k, 7.3% for AGIs over 200k)
Earned income credit: $2,368 (reported on 17.6% of returns)
Here:
$2,368
State:
$2,211
(% of AGI for various income ranges: 6.8% for AGIs below $25k, 1.1% for AGIs $25k-50k)
Percentage of individuals using paid preparers for their 2012 taxes: 59.1%
Here:
59%
State:
46%
(% for various income ranges: 64.9% for AGIs below $25k, 61.8% for AGIs $25k-50k, 54.6% for AGIs $50k-75k, 50.4% for AGIs $75k-100k, 47.4% for AGIs $100k-200k, 56.7% for AGIs over 200k)
Averages for the 2004 tax year for zip code 22041, filed in 2005:
Average Adjusted Gross Income (AGI) in 2004: $51,728 (Individual Income Tax Returns)
Here:
$51,728
State:
$56,704
Salary/wage: $46,052 (reported on 80.0% of returns)
Here:
$46,052
State:
$48,441
(% of AGI for various income ranges: 96.0% for AGIs below $10k, 79.5% for AGIs $10k-25k, 83.7% for AGIs $25k-50k, 74.9% for AGIs $50k-75k, 74.5% for AGIs $75k-100k, 61.1% for AGIs over 100k)
Taxable interest for individuals: $2,090 (reported on 40.5% of returns)
This zip code:
$2,090
Virginia:
$1,688
(% of AGI for various income ranges: 2.8% for AGIs below $10k, 1.0% for AGIs $10k-25k, 1.0% for AGIs $25k-50k, 1.8% for AGIs $50k-75k, 1.6% for AGIs $75k-100k, 2.0% for AGIs over 100k)
Taxable dividends: $5,021 (reported on 23.3% of returns)
Here:
$5,021
State:
$4,028
(% of AGI for various income ranges: 2.6% for AGIs below $10k, 1.2% for AGIs $10k-25k, 1.0% for AGIs $25k-50k, 1.6% for AGIs $50k-75k, 2.5% for AGIs $75k-100k, 3.2% for AGIs over 100k)
Net capital gain/loss: +$11,767 (reported on 20.3% of returns)
Here:
+$11,767
State:
+$14,375
(% of AGI for various income ranges: -1.6% for AGIs below $10k, -0.2% for AGIs $10k-25k, 0.1% for AGIs $25k-50k, 0.8% for AGIs $50k-75k, 1.5% for AGIs $75k-100k, 10.0% for AGIs over 100k)
Profit/loss from business: +$13,588 (reported on 18.9% of returns)
Here:
+$13,588
State:
+$13,342
(% of AGI for various income ranges: 30.1% for AGIs below $10k, 14.4% for AGIs $10k-25k, 3.7% for AGIs $25k-50k, 2.4% for AGIs $50k-75k, 3.0% for AGIs $75k-100k, 4.5% for AGIs over 100k)
IRA payment deduction: $3,060 (reported on 2.1% of returns)
22041:
$3,060
Virginia:
$2,943
(% of AGI for various income ranges: 0.2% for AGIs $10k-25k, 0.2% for AGIs $25k-50k, 0.1% for AGIs $50k-75k, 0.1% for AGIs $75k-100k, 0.1% for AGIs over 100k)
Self-employed pension: $16,374 (reported on 1.1% of returns)
Here:
$16,374
Virginia:
$17,430
(% of AGI for various income ranges: 0.1% for AGIs $10k-25k, 0.1% for AGIs $50k-75k, 0.3% for AGIs $75k-100k, 0.7% for AGIs over 100k)
Total itemized deductions: $19,848 (23% of AGI, reported on 45.0% of returns)
Here:
$19,848
State:
$21,492
Here:
23.5% of AGI
State:
21.0% of AGI
(% of AGI for various income ranges: 15.7% for AGIs below $10k, 15.2% for AGIs $10k-25k, 18.7% for AGIs $25k-50k, 18.9% for AGIs $50k-75k, 18.9% for AGIs $75k-100k, 15.9% for AGIs over 100k)
Charity contributions deductions: $3,220 (4% of AGI, reported on 38.2% of returns)
Here:
$3,220
State:
$3,794
Here:
3.6% of AGI
State:
3.5% of AGI
(% of AGI for various income ranges: 0.7% for AGIs below $10k, 1.3% for AGIs $10k-25k, 1.8% for AGIs $25k-50k, 2.2% for AGIs $50k-75k, 2.5% for AGIs $75k-100k, 2.9% for AGIs over 100k)
Total tax: $8,636 (reported on 79.8% of returns)
22041:
$8,636
State:
$9,537
(% of AGI for various income ranges: 6.1% for AGIs below $10k, 4.9% for AGIs $10k-25k, 7.2% for AGIs $25k-50k, 11.1% for AGIs $50k-75k, 13.2% for AGIs $75k-100k, 18.7% for AGIs over 100k)
Earned income credit: $1,687 (reported on 15.9% of returns)
Here:
$1,687
State:
$1,734
Percentage of individuals using paid preparers for their 2004 taxes: 61.9%
Here:
62%
State:
52%
(% for various income ranges: 61.4% for AGIs below $10k, 71.9% for AGIs $10k-25k, 64.8% for AGIs $25k-50k, 55.9% for AGIs $50k-75k, 50.9% for AGIs $75k-100k, 50.1% for AGIs over 100k)
Likely homosexual households (counted as self-reported same-sex unmarried-partner households)
Lesbian couples: 0.0% of all households
Gay men: 0.2% of all households
Household received Food Stamps/SNAP in the past 12 months: 1,342 Household did not receive Food Stamps/SNAP in the past 12 months: 10,224
Women who had a birth in the past 12 months: 653 (508 now married, 148 unmarried) Women who did not have a birth in the past 12 months: 5,751 (2,411 now married, 3,342 unmarried)
Housing units in zip code 22041 with a mortgage: 3,865 (452 second mortgage, 58 home equity loan, 312 both second mortgage and home equity loan) Houses without a mortgage: 54
Median monthly owner costs for units with a mortgage: $2,525 Median monthly owner costs for units without a mortgage: $956
Residents with income below the poverty level in 2022:
This zip code:
18.0%
Whole state:
10.6%
Residents with income below 50% of the poverty level in 2022:
This zip code:
8.5%
Whole state:
5.2%
Median number of rooms in houses and condos:
Here:
5.6
State:
7.0
Median number of rooms in apartments:
Here:
3.7
State:
4.3
Notable locations in this zip code not listed on our city pages
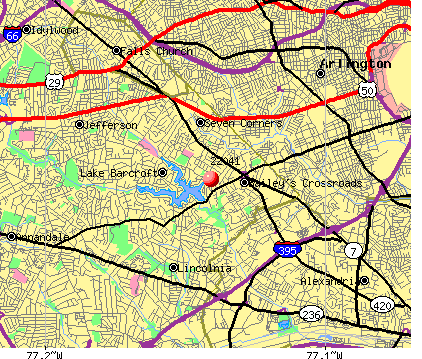
Notable locations in zip code 22041: Woodrow Wilson Library (A), Fairfax County Fire and Rescue Department Station 10 Baileys Crossroads (B), Barcroft Recreation Center (C), Department of Motor Vehicles Baileys Crossroads (D), Bailey's Crossroads Community Shelter (E). Display/hide their locations on the map
Shopping Centers: Baileys Crossroads Shopping Center (1), Culmore Shopping Center (2), Barcroft Plaza Shopping Center (3), Crossroads Center Shopping Center (4), Skyline Mall Shopping Center (5), Leesburg Pike Plaza Shopping Center (6). Display/hide their locations on the map
Churches in zip code 22041 include: Kingdom Hall of Jehovahs Witnesses Baileys Crossroads Congregation (A), Chinese Christian Church of Virginia (B), Crossroads Baptist Church (C), God Is Love First Baptist Church (D), Saint Anthonys Catholic Church (E), Scripture Church of Christ (F), Warner Baptist Church (G), Community Church of God (H), Church of Christ (I). Display/hide their locations on the map
4,333 married couples with children.
1,738 single-parent households (649 men, 1,089 women).
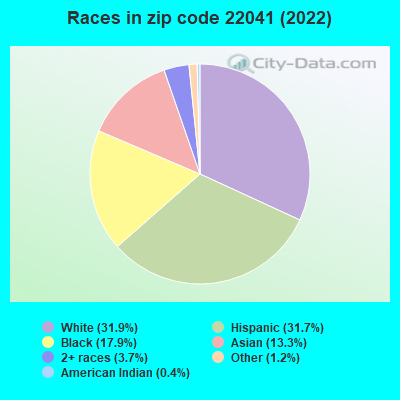
40.2% of residents of 22041 zip code speak English at home.
27.9% of residents speak Spanish at home (45% very well, 21% well, 24% not well, 10% not at all).
10.5% of residents speak other Indo-European language at home (59% very well, 24% well, 12% not well, 5% not at all).
4.7% of residents speak Asian or Pacific Island language at home (49% very well, 30% well, 18% not well, 2% not at all).
18.3% of residents speak other language at home (56% very well, 32% well, 10% not well, 2% not at all).
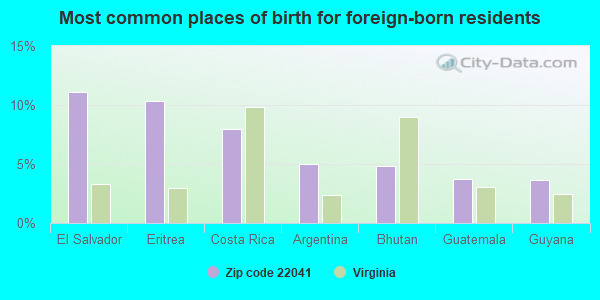
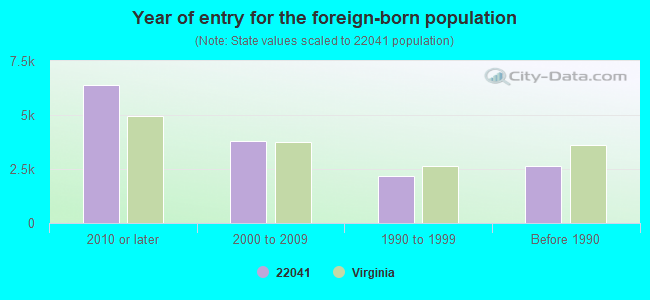
Foreign born population: 13,943 (47.5%) (45.4% of them are naturalized citizens)
Facilities with environmental interests located in this zip code:
CHESAPEAKE CLEANERS (5507 LEESBURG PIKE in BAILEYS CROSSROADS, VA)
AIR MINOR (AIRS/AFS) STATE MASTER (Virginia pollutants databases) - CEDS-72226, AIR PROGRAM Small Quantity Generators, between 100 kg and 1000 kg of hazardous waste/month (Resource Conservation and Recovery Act (tracking hazardous waste)) - notification Business SIC classification: DRYCLEANING PLANTS, EXCEPT RUG CLEANING Business NAICS classification: DRYCLEANING AND LAUNDRY SERVICES (EXCEPT COIN-OPERATED). Organizations: OPERNAME (CONTACT/OPERATOR)
, LEE, JAE OK (CONTACT/OWNER)
BELVEDERE ELEMENTARY SCHOOL (6540 COLUMBIA PIKE in FALLS CHURCH, VA)
AIR MONITORING SITE (Airborne pollution emission tracking) (Geographic Names Information System) (National Center for Education Statistics) - STATE ID-0290720 Conditionally Exempt Small Quantity Generators, less than 100 kg/month of hazardous waste (Resource Conservation and Recovery Act (tracking hazardous waste)) - notification Organizations: FAIRFAX COUNTY PUBLIC SCHOOLS (CONTACT/OWNER)
Alternative names: BELEDERE ELEM SCH, BELVEDERE ELEM., BELVEDERE SCHOOL
CHANTILLY COLLISION CTR T A ROSSLYN A (6123 COLUMBIA PIKE in BAILEYS CROSSROADS, VA)
AIR MINOR (AIRS/AFS) Small Quantity Generators, between 100 kg and 1000 kg of hazardous waste/month (Resource Conservation and Recovery Act (tracking hazardous waste)) - notification Business SIC classification: TOP, BODY, AND UPHOLSTERY REPAIR SHOPS AND PAINT SHOPS Organizations: OPERNAME (CONTACT/OPERATOR)
, CHANTILLY COLLISION CTR T/A ROSSLYN AUTO (CONTACT/OWNER)
Alternative names: CHANTILLY COLLISION CTR T/A ROSSLYN AUT
ARISTO VALET (3533 SOUTH JEFFERSON STREET in FALLS CHURCH, VA)
(Resource Conservation and Recovery Act (tracking hazardous waste)) Organizations: OPERNAME (CONTACT/OPERATOR)
, EARL, ROBERT ENTERPRISE INC (CONTACT/OWNER)
CHESAPEAKE & POTOMAC TELEPHONE CO (5815 SEMINARY RD in BAILEYS CROSSROADS, VA)
AMOCO #2135-TANKS (5865 LEESBURG PK in FALLS CHURCH, VA)
Small Quantity Generators, between 100 kg and 1000 kg of hazardous waste/month (Resource Conservation and Recovery Act (tracking hazardous waste)) - notification Organizations: OPERNAME (CONTACT/OPERATOR)
, AMOCO OIL COMPANY (CONTACT/OWNER)
Housing units lacking complete plumbing facilities: 0.9% Housing units lacking complete kitchen facilities: 0.8%
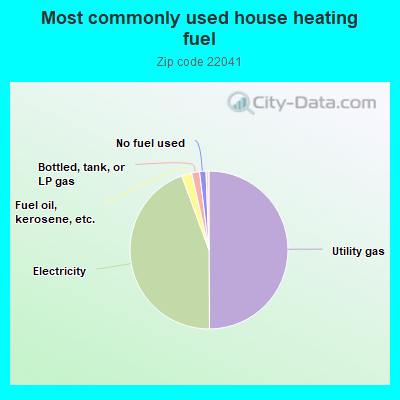
49.9%Utility gas
44.5%Electricity
2.1%Fuel oil, kerosene, etc.
1.6%Bottled, tank, or LP gas
1.3%No fuel used
Population in 1990: 21,801. Population change in the 1990s: +5,165 (+23.7%).
Place of birth for U.S.-born residents:
This state: 6,797
Northeast: 2,304
Midwest: 1,391
South: 3,048
West: 1,221
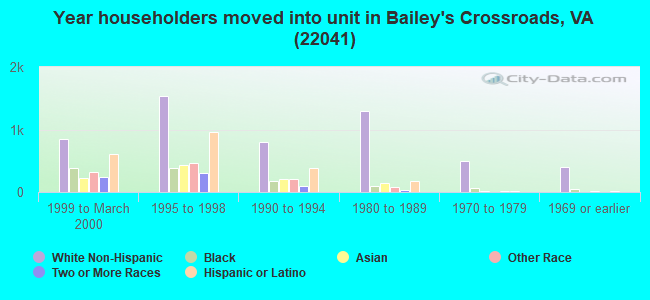
53% of the 22041 zip code residents lived in the same house 5 years ago. Out of people who lived in different houses, 40% lived in this county. Out of people who lived in different counties, 50% lived in Virginia.
86% of the 22041 zip code residents lived in the same house 1 year ago. Out of people who lived in different houses, 37% moved from this county. Out of people who lived in different houses, 31% moved from different county within same state. Out of people who lived in different houses, 13% moved from different state. Out of people who lived in different houses, 18% moved from abroad.
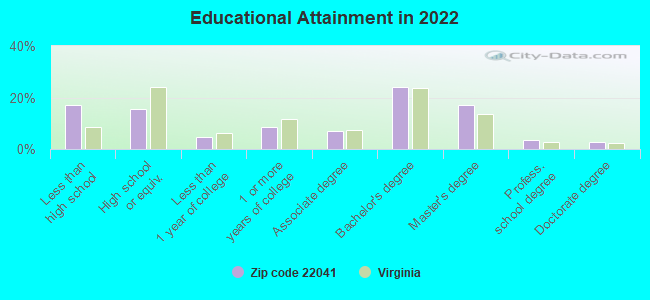
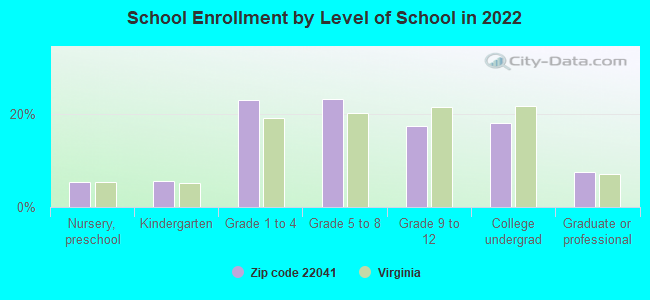
Private vs. public school enrollment:
Students in private schools in grades 1 to 8 (elementary and middle school): 261
Here:
9.5%
Virginia:
13.2%
Students in private schools in grades 9 to 12 (high school): 136
Here:
13.1%
Virginia:
10.2%
Students in private undergraduate colleges: 160
Here:
14.9%
Virginia:
18.7%
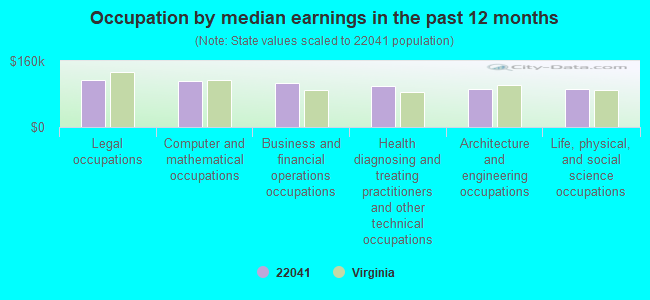
Occupation by median earnings in the past 12 months ($)
114,901Legal occupations
110,750Computer and mathematical occupations
106,422Business and financial operations occupations
98,261Health diagnosing and treating practitioners and other technical occupations
92,494Architecture and engineering occupations
91,093Life, physical, and social science occupations
Companies with biggest federal contracts located in this zip code (FALLS CHURCH, VA):
LOCKHEED MARTIN SERVICES INC (5203 LSBURG PIKE STE 1500) : $638,383,491 in 621 contractsfrom 1999 to 2006
Contracts for Other ADP and Telecommunications Services (includes data storage on tapes, compact disks, etc.), ADP Systems Analysis Services, Automated Information System Design and Integration Services, ADP Facility Operation and Maintenance Services, and moreby Federal Technology Service, Navy, Army, Virginia Contracting Activity, and others Signed by year:2000: $49,681,459; 2001: $58,595,619; 2002: $77,212,221; 2003: $80,583,601; 2004: $136,321,598; 2005: $137,651,072; 2006: $78,921,014.
Biggest contracts:
$40,212,000 with Federal Technology Service for Other ADP and Telecommunications Services (includes data storage on tapes, compact disks, etc.). Taking place in DC. Signed on 2001-10-15. Completion date: 2010-12-15.
$38,238,647, same as above.Signed on 2006-01-13. Completion date: 2010-12-04.
$29,349,909, same as above.Signed on 2004-08-23. Completion date: 2010-12-03.
$29,055,424, same as above.Signed on 2005-09-30. Completion date: 2010-12-04.
ELECTRONIC DATA SYSTEMS CORPOR (5201 LEESBURG PIKE, SUITE) : $136,329,421 in 197 contractsfrom 1999 to 2005
Contracts for Other ADP and Telecommunications Services (includes data storage on tapes, compact disks, etc.), Training Aids, ADPE System Configuration by Department of Defense, Army, Air Force Signed by year:2000: $112,517,759; 2001: $9,634,691; 2002: $366,532; 2003: -$1,720; 2004: $365,972; 2005: $759,187; 2006: $0.
Biggest contracts:
$69,607,988 with Department of Defense for Other ADP and Telecommunications Services (includes data storage on tapes, compact disks, etc.). Signed on 2000-09-12. Completion date: 2001-05-30.
$20,499,998, same as above.Signed on 2000-05-25. Completion date: 2001-12-31.
$5,282,009, same as above.Signed on 2000-02-07. Completion date: 2001-01-31.
$2,626,822, same as above.Signed on 1999-12-16. Completion date: 2002-12-01.
TRIUMPH TECHNOLOGIES INC (5203 LSBURG PIKE STE 1100; small business) 220 employees, $13300000 revenue. 8A Firm, Small Disadvantaged Business, Woman Owned Business, Service Disabled Veteran Owned Firm: $86,601,453 in 327 contractsfrom 1999 to 2006
Contracts for Other Management Support Services, Other Professional Services, Other Administrative Support Services, Personal Services Contracts, and moreby Minerals Management Service, NATIONAL SCIENCE FOUNDATION, Department of Defense, Department of State, and others Signed by year:2000: $8,432,259; 2001: $10,357,885; 2002: $7,411,232; 2003: $13,010,038; 2004: $22,872,227; 2005: $16,020,582; 2006: $11,013,159.
Biggest contracts:
$4,532,056 with Minerals Management Service for Other Management Support Services. Taking place in DC. Signed on 2004-12-13. Completion date: 2006-02-16.
$3,192,855 with NATIONAL SCIENCE FOUNDATION for Other Professional Services. Signed on 2004-10-27. Completion date: 2005-11-14.
$3,003,002 with Department of Defense for Other Administrative Support Services. Signed on 2000-12-26. Completion date: 2000-12-26.
$2,809,112 with Department of State for Personal Services Contracts. Signed on 2005-07-14. Completion date: 2006-06-09.
SCIENCE APPLICATIONS INTERNATI (5107 LSBURG PIKE STE 2200) : $38,237,675 in 198 contractsfrom 1999 to 2006
Contracts for ADP Systems Development Services, Automated Information System Design and Integration Services, ADP System Acquisition Support Services. Includes preparation of statement of work, benchmarks, specifications, etc., ADP Facility Operation and Maintenance Services, and moreby National Institutes of Health, Army, NASA, Department of Veterans Affairs, and others Signed by year:2000: $13,212,204; 2001: $7,995,418; 2002: $8,288,823; 2003: $4,475,880; 2004: $1,489,563; 2005: $899,868; 2006: $0.
Biggest contracts:
$4,070,069 with National Institutes of Health for ADP Systems Development Services. Signed on 2003-04-15. Completion date: 2003-08-15.
$3,266,078 with Army for Automated Information System Design and Integration Services. Taking place in DC. Signed on 2002-11-29. Completion date: 2003-09-30.
$2,731,776, same as above.Signed on 2002-11-26. Completion date: 2003-09-30.
$2,481,745 with Army for ADP System Acquisition Support Services. Includes preparation of statement of work, benchmarks, specifications, etc.. Taking place in DC. Signed on 2002-02-09. Completion date: 2002-09-30.
NORTHROP GRUMMAN SPACE & MISSI (5113 LEESBURG PIKE STE 706) : $28,990,007 in 20 contractsfrom 2004 to 2006
Contracts for Services -- Management and Support (R&D), Medical and Health Studies, Services -- Engineering Development (R&D) by ENERGY, Department of, Army Signed by year:2000: $0; 2001: $0; 2002: $0; 2003: $0; 2004: $21,543,881; 2005: $8,226,342; 2006: -$780,216.
Biggest contracts:
$5,768,067 with ENERGY, Department of for Services -- Management and Support (R&D). Signed on 2004-03-29. Completion date: 2005-03-28.
$4,393,585 with Army for Medical and Health Studies. Taking place in DC. Signed on 2004-12-30. Effective on 2005-01-01. Completion date: 2005-07-31.
$4,127,113, same as above.Signed on 2004-08-20. Completion date: 2005-07-31.
$3,081,342 with ENERGY, Department of for Services -- Management and Support (R&D). Signed on 2005-03-16. Completion date: 2005-03-28.
TEAM PLACEMENT SERVICE INC BIO (5113 LEESBURG PIKE; small business) : $5,025,005 in 111 contractsfrom 2000 to 2006
Contracts for Other Defense -- Basic Research (R&D), Miscellaneous Items, Personal Care Services (includes such services as barber and beauty shop, shoe repairs, tailoring, etc.), Other Professional Services, and moreby Army, National Institutes of Health Signed by year:2000: $868,617; 2001: $1,101,240; 2002: $902,570; 2003: $757,080; 2004: $687,677; 2005: $494,834; 2006: $212,987.
Biggest contracts:
$100,000 with Army for Other Defense -- Basic Research (R&D). Taking place in MD. Signed on 2005-09-20. Completion date: 2004-10-31.
$97,011 with Army for Miscellaneous Items. Taking place in MD. Signed on 2001-02-04. Completion date: 2002-01-15.
$97,011 with Army for Personal Care Services (includes such services as barber and beauty shop, shoe repairs, tailoring, etc.). Taking place in MD. Signed on 2002-01-24. Completion date: 2003-01-27.
$91,686 with Army for Other Professional Services. Taking place in MD. Signed on 2003-08-05. Completion date: 2004-08-25.
STERLING SOFTWARE /US/ INC (5205 LEESBURG PIKE) : $4,664,716 in 8 contractsfrom 2000 to 2001
Contracts for Other ADP and Telecommunications Services (includes data storage on tapes, compact disks, etc.) by Army Signed by year:2000: $2,558,026; 2001: $2,106,690; 2002: $0; 2003: $0; 2004: $0; 2005: $0; 2006: $0.
Biggest contracts:
$2,558,026 with Army for Other ADP and Telecommunications Services (includes data storage on tapes, compact disks, etc.). Taking place in CT. Signed on 2000-12-18. Completion date: 1998-09-30.
$917,854 with Army for Other ADP and Telecommunications Services (includes data storage on tapes, compact disks, etc.). Signed on 2001-06-01. Completion date: 2001-09-30.
$465,500, same as above.Signed on 2001-07-25. Completion date: 2001-09-30.
$300,000 with Army for Other ADP and Telecommunications Services (includes data storage on tapes, compact disks, etc.). Taking place in CT. Signed on 2001-01-19. Completion date: 2001-09-30.
SCIENCE APPLICATIONS INTERNATI (5109 LEESBURG PIKE) : $3,441,703 in 8 contractsfrom 2003 to 2006
Contracts for Automated Information System Design and Integration Services, Other Professional Services, ADP Systems Development Services by NASA, Army, EPA Signed by year:2000: $0; 2001: $0; 2002: $0; 2003: $0; 2004: $3,001,524; 2005: $34,977; 2006: $405,202.
Biggest contracts:
$3,001,524 with NASA for Automated Information System Design and Integration Services. Taking place in TX. Signed on 2004-01-15. Completion date: 2004-08-31.
$225,202 with Army for Other Professional Services. Taking place in MD. Signed on 2006-04-13. Completion date: 2006-09-11.
$145,000, same as above.Signed on 2006-04-13. Completion date: 2006-09-11.
$35,000, same as above.Signed on 2006-04-13. Completion date: 2006-09-11.
S P F INC (5881 LEESBURG PIKE; small business) : $3,273,795 in 2 contractsfrom 1999 to 2000
$3,143,445 with Air Force for Other Professional Services. Signed on 1999-12-28. Completion date: 2000-12-31.
$130,350, same as above.Signed on 2000-04-03. Completion date: 2000-12-31.
PROFESSNAL HEALTHCARE RESOURCE (6066 LEESBURG PIKE SUITE 9; small business) : $1,510,883 in 20 contractsfrom 2000 to 2006
Contracts for Other Medical Services, Radiology Services by Navy, Department of Veterans Affairs Signed by year:2000: $364,272; 2001: $494,359; 2002: $0; 2003: $331,500; 2004: $169,379; 2005: $60,970; 2006: $90,403.
Biggest contracts:
$324,990 with Navy for Other Medical Services. Taking place in MD. Signed on 2001-10-01. Completion date: 2002-09-30.
$245,232, same as above.Signed on 2003-10-20. Completion date: 2004-09-30.
$197,371, same as above.Signed on 2000-10-01. Completion date: 2001-09-30.
$170,028, same as above.Signed on 2004-10-01. Completion date: 2005-09-30.
Top industries in this zip code by the number of employees in 2005:
Administrative and Support and Waste Management and Remediation Services: Janitorial Services (over 1000 employees: 1 establishment, 10-19 employees: 2 establishments, 5-9 employees: 1 establishment, 1-4 employees: 6 establishments)
Professional, Scientific, and Technical Services: Administrative Management and General Management Consulting Services (250-499: 1, 100-249: 3, 50-99: 1, 20-49: 3, 10-19: 1, 1-4: 6)
Professional, Scientific, and Technical Services: Research and Development in the Physical, Engineering, and Life Sciences (500-999: 1, 50-99: 2, 20-49: 1, 5-9: 1, 1-4: 1)
2004 - 2018 National Fire Incident Reporting System (NFIRS) incidents
Based on the data from the years 2004 - 2018 the average number of fire incidents per year is 79. The highest number of fire incidents - 118 took place in 2015, and the least - 6 in 2004. The data has a growing trend.
When looking into fire subcategories, the most reports belonged to: Structure Fires (50.8%), and Outside Fires (33.5%).
Fire incident types reported to NFIRS in Zip Code 22041


 Nearest zip codes: 22044, 22311, 22312, 22203, 22205, 22304.


 Based on the data from the years 2004 - 2018 the average number of fire incidents per year is 79. The highest number of fire incidents - 118 took place in 2015, and the least - 6 in 2004. The data has a growing trend.
 When looking into fire subcategories, the most reports belonged to: Structure Fires (50.8%), and Outside Fires (33.5%).