Estimated zip code population in 2022: 26,755 Zip code population in 2010: 30,614 Zip code population in 2000: 28,370
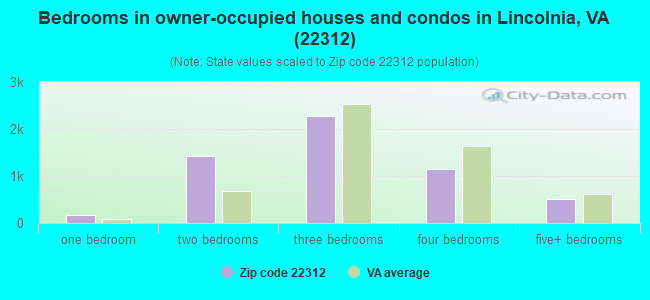
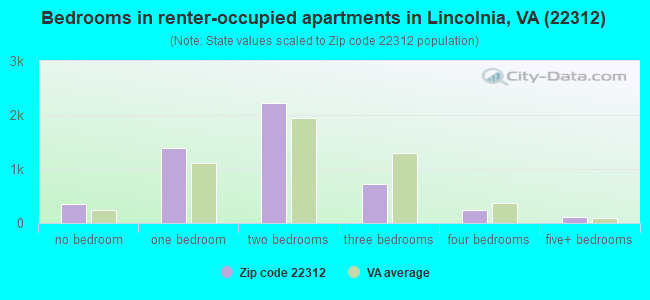
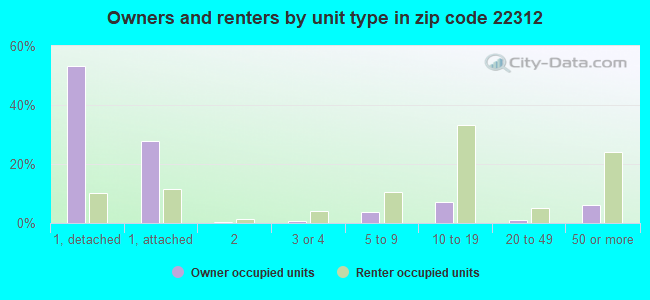
Houses and condos: 11,532 Renter-occupied apartments: 5,012
% of renters here:
47%
State:
33%
March 2022 cost of living index in zip code 22312: 166.6 (very high, U.S. average is 100)
Land area: 5.4 sq. mi. Water area: 0.0 sq. mi.
Population density: 4,986 people per square mile
(average).
OSM Map
General Map
Google Map
MSN Map
OSM Map
General Map
Google Map
MSN Map
OSM Map
General Map
Google Map
MSN Map
OSM Map
General Map
Google Map
MSN Map
Please wait while loading the map...
Real estate property taxes paid for housing units in 2022:
This zip code:
1.0% ($5,806)
Virginia:
0.7% ($2,617)
Median real estate property taxes paid for housing units with mortgages in 2022: $5,755 (1.0%) Median real estate property taxes paid for housing units with no mortgage in 2022: $6,061 (1.1%)
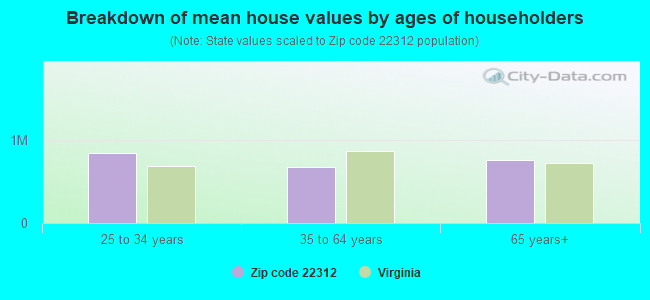
Estimated median house/condo value in 2022: $596,119
22312:
$596,119
Virginia:
$365,700
According to our research of Virginia and other state lists, there were 17 registered sex offenders living in 22312 zip code as of April 26, 2024. The ratio of all residents to sex offenders in zip code 22312 is 2,024 to 1. The ratio of registered sex offenders to all residents in this zip code is much lower than the state average.
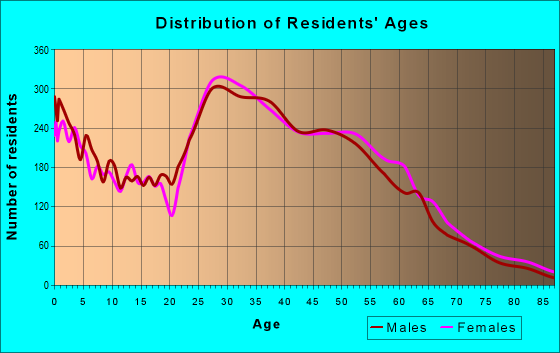
Median resident age:
This zip code:
38.5 years
Virginia median age:
39.0 years
Average household size:
This zip code:
2.5 people
Virginia:
2.5 people
Averages for the 2020 tax year for zip code 22312, filed in 2021:
Average Adjusted Gross Income (AGI) in 2020: $75,503 (Individual Income Tax Returns)
Here:
$75,503
State:
$86,446
Salary/wage: $67,847 (reported on 80.0% of returns)
Here:
$67,847
State:
$71,185
(% of AGI for various income ranges: 1216.7% for AGIs below $25k, 3892.8% for AGIs $25k-50k, 7251.0% for AGIs $50k-75k, 10211.1% for AGIs $75k-100k, 19012.8% for AGIs $100k-200k, 65792.2% for AGIs over 200k)
Taxable interest for individuals: $1,505 (reported on 26.9% of returns)
This zip code:
$1,505
Virginia:
$1,805
(% of AGI for various income ranges: 10.6% for AGIs below $25k, 13.6% for AGIs $25k-50k, 26.6% for AGIs $50k-75k, 55.3% for AGIs $75k-100k, 130.5% for AGIs $100k-200k, 823.3% for AGIs over 200k)
Ordinary dividends: $6,170 (reported on 18.0% of returns)
Here:
$6,170
State:
$8,327
(% of AGI for various income ranges: 12.2% for AGIs below $25k, 18.2% for AGIs $25k-50k, 50.8% for AGIs $50k-75k, 140.0% for AGIs $75k-100k, 332.7% for AGIs $100k-200k, 2803.1% for AGIs over 200k)
Net capital gain/loss in AGI: +$19,154 (reported on 17.8% of returns)
Here:
+$19,154
State:
+$24,644
(% of AGI for various income ranges: 7.6% for AGIs below $25k, 33.2% for AGIs $25k-50k, 66.3% for AGIs $50k-75k, 127.4% for AGIs $75k-100k, 492.1% for AGIs $100k-200k, 12521.1% for AGIs over 200k)
Profit/loss from business: +$9,636 (reported on 28.0% of returns)
Here:
+$9,636
State:
+$12,836
(% of AGI for various income ranges: 378.9% for AGIs below $25k, 252.0% for AGIs $25k-50k, 213.9% for AGIs $50k-75k, 325.5% for AGIs $75k-100k, 410.8% for AGIs $100k-200k, 3340.0% for AGIs over 200k)
Taxable individual retirement arrangement distribution: $22,830 (reported on 4.5% of returns)
22312:
$22,830
Virginia:
$21,535
(% of AGI for various income ranges: 18.9% for AGIs below $25k, 25.5% for AGIs $25k-50k, 71.9% for AGIs $50k-75k, 189.2% for AGIs $75k-100k, 368.4% for AGIs $100k-200k, 1875.8% for AGIs over 200k)
Self-employed (Keogh) retirement plans: $36,425 (reported on 0.5% of returns)
22312:
$36,425
Virginia:
$31,172
(% of AGI for various income ranges: 31.4% for AGIs $100k-200k, 680.6% for AGIs over 200k)
Total itemized deductions: $30,877 (reported on 17.7% of returns)
Here:
$30,877
State:
$33,287
(% of AGI for various income ranges: 57.9% for AGIs below $25k, 254.2% for AGIs $25k-50k, 574.3% for AGIs $50k-75k, 1029.7% for AGIs $75k-100k, 2026.7% for AGIs $100k-200k, 8489.7% for AGIs over 200k)
Charity contributions: $7,104 (reported on 14.1% of returns)
Here:
$7,104
State:
$10,381
(% of AGI for various income ranges: 4.9% for AGIs below $25k, 47.2% for AGIs $25k-50k, 98.9% for AGIs $50k-75k, 163.7% for AGIs $75k-100k, 343.2% for AGIs $100k-200k, 1819.7% for AGIs over 200k)
Taxes paid: $8,274 (reported on 17.7% of returns)
22312:
$8,274
State:
$8,284
(% of AGI for various income ranges: 13.8% for AGIs below $25k, 50.1% for AGIs $25k-50k, 155.7% for AGIs $50k-75k, 315.8% for AGIs $75k-100k, 694.6% for AGIs $100k-200k, 1682.5% for AGIs over 200k)
Earned income credit: $2,103 (reported on 15.9% of returns)
Here:
$2,103
State:
$2,214
(% of AGI for various income ranges: 108.2% for AGIs below $25k, 71.9% for AGIs $25k-50k, 1.1% for AGIs $50k-75k)
Percentage of individuals using paid preparers for their 2020 taxes: 89.4%
Here:
89%
State:
92%
(% for various income ranges: 86.3% for AGIs below $25k, 91.1% for AGIs $25k-50k, 90.3% for AGIs $50k-75k, 90.3% for AGIs $75k-100k, 90.6% for AGIs $100k-200k, 92.6% for AGIs over 200k)
Averages for the 2012 tax year for zip code 22312, filed in 2013:
Average Adjusted Gross Income (AGI) in 2012: $63,176 (Individual Income Tax Returns)
Here:
$63,176
State:
$71,192
Salary/wage: $57,412 (reported on 85.2% of returns)
Here:
$57,412
State:
$59,229
(% of AGI for various income ranges: 78.2% for AGIs below $25k, 89.3% for AGIs $25k-50k, 84.8% for AGIs $50k-75k, 82.7% for AGIs $75k-100k, 79.1% for AGIs $100k-200k, 60.9% for AGIs over 200k)
Taxable interest for individuals: $1,086 (reported on 30.6% of returns)
This zip code:
$1,086
Virginia:
$1,600
(% of AGI for various income ranges: 0.5% for AGIs below $25k, 0.3% for AGIs $25k-50k, 0.4% for AGIs $50k-75k, 0.6% for AGIs $75k-100k, 0.6% for AGIs $100k-200k, 0.7% for AGIs over 200k)
Ordinary dividends: $5,917 (reported on 17.3% of returns)
Here:
$5,917
State:
$6,959
(% of AGI for various income ranges: 0.6% for AGIs below $25k, 0.4% for AGIs $25k-50k, 1.0% for AGIs $50k-75k, 1.2% for AGIs $75k-100k, 1.5% for AGIs $100k-200k, 3.4% for AGIs over 200k)
Net capital gain/loss in AGI: +$5,127 (reported on 14.0% of returns)
Here:
+$5,127
State:
+$16,672
(% of AGI for various income ranges: 0.1% for AGIs $25k-50k, 0.3% for AGIs $50k-75k, 0.4% for AGIs $75k-100k, 1.1% for AGIs $100k-200k, 3.0% for AGIs over 200k)
Profit/loss from business: +$11,270 (reported on 21.6% of returns)
Here:
+$11,270
State:
+$14,116
(% of AGI for various income ranges: 18.7% for AGIs below $25k, 4.1% for AGIs $25k-50k, 2.0% for AGIs $50k-75k, 2.0% for AGIs $75k-100k, 2.6% for AGIs $100k-200k, 2.8% for AGIs over 200k)
Taxable individual retirement arrangement distribution: $15,490 (reported on 5.2% of returns)
22312:
$15,490
Virginia:
$16,667
(% of AGI for various income ranges: 0.7% for AGIs below $25k, 0.6% for AGIs $25k-50k, 1.0% for AGIs $50k-75k, 0.9% for AGIs $75k-100k, 1.5% for AGIs $100k-200k, 2.0% for AGIs over 200k)
Self-employment retirement plans: $22,570 (reported on 0.6% of returns)
22312:
$22,570
Virginia:
$25,373
(% of AGI for various income ranges: 0.2% for AGIs below $25k, 0.2% for AGIs $100k-200k, 0.6% for AGIs over 200k)
Total itemized deductions: $23,818 (22% of AGI, reported on 42.0% of returns)
Here:
$23,818
State:
$26,596
Here:
22.2% of AGI
State:
20.1% of AGI
(% of AGI for various income ranges: 10.3% for AGIs below $25k, 16.2% for AGIs $25k-50k, 16.7% for AGIs $50k-75k, 17.4% for AGIs $75k-100k, 17.6% for AGIs $100k-200k, 13.7% for AGIs over 200k)
Charity contributions: $3,440 (reported on 33.2% of returns)
Here:
$3,440
State:
$4,443
(% of AGI for various income ranges: 0.8% for AGIs below $25k, 1.6% for AGIs $25k-50k, 1.8% for AGIs $50k-75k, 1.8% for AGIs $75k-100k, 2.0% for AGIs $100k-200k, 2.0% for AGIs over 200k)
Taxes paid: $8,302 (reported on 41.8% of returns)
22312:
$8,302
State:
$9,951
(% of AGI for various income ranges: 1.5% for AGIs below $25k, 2.9% for AGIs $25k-50k, 4.6% for AGIs $50k-75k, 5.7% for AGIs $75k-100k, 7.0% for AGIs $100k-200k, 6.8% for AGIs over 200k)
Earned income credit: $2,176 (reported on 18.9% of returns)
Here:
$2,176
State:
$2,211
(% of AGI for various income ranges: 7.1% for AGIs below $25k, 1.1% for AGIs $25k-50k)
Percentage of individuals using paid preparers for their 2012 taxes: 56.7%
Here:
57%
State:
46%
(% for various income ranges: 63.4% for AGIs below $25k, 59.2% for AGIs $25k-50k, 51.3% for AGIs $50k-75k, 48.6% for AGIs $75k-100k, 46.8% for AGIs $100k-200k, 53.6% for AGIs over 200k)
Averages for the 2004 tax year for zip code 22312, filed in 2005:
Average Adjusted Gross Income (AGI) in 2004: $51,411 (Individual Income Tax Returns)
Here:
$51,411
State:
$56,704
Salary/wage: $47,296 (reported on 87.0% of returns)
Here:
$47,296
State:
$48,441
(% of AGI for various income ranges: 136.6% for AGIs below $10k, 84.6% for AGIs $10k-25k, 88.8% for AGIs $25k-50k, 82.5% for AGIs $50k-75k, 83.1% for AGIs $75k-100k, 72.2% for AGIs over 100k)
Taxable interest for individuals: $1,432 (reported on 38.8% of returns)
This zip code:
$1,432
Virginia:
$1,688
(% of AGI for various income ranges: 3.2% for AGIs below $10k, 0.8% for AGIs $10k-25k, 0.5% for AGIs $25k-50k, 1.1% for AGIs $50k-75k, 0.9% for AGIs $75k-100k, 1.4% for AGIs over 100k)
Taxable dividends: $3,154 (reported on 21.1% of returns)
Here:
$3,154
State:
$4,028
(% of AGI for various income ranges: 2.9% for AGIs below $10k, 0.6% for AGIs $10k-25k, 0.6% for AGIs $25k-50k, 1.0% for AGIs $50k-75k, 1.3% for AGIs $75k-100k, 1.8% for AGIs over 100k)
Net capital gain/loss: +$7,365 (reported on 17.8% of returns)
Here:
+$7,365
State:
+$14,375
(% of AGI for various income ranges: -0.7% for AGIs below $10k, 0.0% for AGIs $10k-25k, 0.2% for AGIs $25k-50k, 0.9% for AGIs $50k-75k, 1.1% for AGIs $75k-100k, 5.2% for AGIs over 100k)
Profit/loss from business: +$11,615 (reported on 17.6% of returns)
Here:
+$11,615
State:
+$13,342
(% of AGI for various income ranges: 38.8% for AGIs below $10k, 10.5% for AGIs $10k-25k, 3.1% for AGIs $25k-50k, 2.3% for AGIs $50k-75k, 2.6% for AGIs $75k-100k, 3.4% for AGIs over 100k)
IRA payment deduction: $2,916 (reported on 2.0% of returns)
22312:
$2,916
Virginia:
$2,943
(% of AGI for various income ranges: 0.2% for AGIs $10k-25k, 0.2% for AGIs $25k-50k, 0.1% for AGIs $50k-75k, 0.1% for AGIs $75k-100k, 0.1% for AGIs over 100k)
Self-employed pension: $13,607 (reported on 1.0% of returns)
Here:
$13,607
Virginia:
$17,430
Total itemized deductions: $20,465 (25% of AGI, reported on 46.0% of returns)
Here:
$20,465
State:
$21,492
Here:
24.8% of AGI
State:
21.0% of AGI
(% of AGI for various income ranges: 14.9% for AGIs below $10k, 16.8% for AGIs $10k-25k, 19.4% for AGIs $25k-50k, 20.0% for AGIs $50k-75k, 20.2% for AGIs $75k-100k, 17.0% for AGIs over 100k)
Charity contributions deductions: $2,967 (3% of AGI, reported on 39.1% of returns)
Here:
$2,967
State:
$3,794
Here:
3.4% of AGI
State:
3.5% of AGI
(% of AGI for various income ranges: 0.6% for AGIs below $10k, 1.4% for AGIs $10k-25k, 2.3% for AGIs $25k-50k, 2.3% for AGIs $50k-75k, 2.5% for AGIs $75k-100k, 2.3% for AGIs over 100k)
Total tax: $8,124 (reported on 79.9% of returns)
22312:
$8,124
State:
$9,537
(% of AGI for various income ranges: 7.5% for AGIs below $10k, 4.6% for AGIs $10k-25k, 6.7% for AGIs $25k-50k, 10.3% for AGIs $50k-75k, 12.6% for AGIs $75k-100k, 17.7% for AGIs over 100k)
Earned income credit: $1,733 (reported on 15.6% of returns)
Here:
$1,733
State:
$1,734
Percentage of individuals using paid preparers for their 2004 taxes: 59.8%
Here:
60%
State:
52%
(% for various income ranges: 59.7% for AGIs below $10k, 70.4% for AGIs $10k-25k, 62.6% for AGIs $25k-50k, 55.5% for AGIs $50k-75k, 45.9% for AGIs $75k-100k, 47.6% for AGIs over 100k)
Likely homosexual households (counted as self-reported same-sex unmarried-partner households)
Lesbian couples: 0.0% of all households
Gay men: 0.6% of all households
Household received Food Stamps/SNAP in the past 12 months: 682 Household did not receive Food Stamps/SNAP in the past 12 months: 9,908
Women who had a birth in the past 12 months: 428 (375 now married, 58 unmarried) Women who did not have a birth in the past 12 months: 6,843 (2,796 now married, 4,053 unmarried)
Housing units in zip code 22312 with a mortgage: 3,909 (299 second mortgage, 47 home equity loan, 228 both second mortgage and home equity loan) Houses without a mortgage: 109
Median monthly owner costs for units with a mortgage: $2,605 Median monthly owner costs for units without a mortgage: $853
Residents with income below the poverty level in 2022:
This zip code:
9.7%
Whole state:
10.6%
Residents with income below 50% of the poverty level in 2022:
This zip code:
4.7%
Whole state:
5.2%
Median number of rooms in houses and condos:
Here:
6.2
State:
7.0
Median number of rooms in apartments:
Here:
3.8
State:
4.3
Notable locations in this zip code not listed on our city pages
Notable locations in zip code 22312: Pinecrest Golf Course (A), Shirley Edsall Industrial Park (B), Shirley-Edsall Industrial Park (C), Lincolnia Senior Center (D), National Organization of Black Law Enforcement Executives (E). Display/hide their locations on the map
Shopping Centers: Plaza at Landmark Shopping Center (1), Pinecrest Plaza Shopping Center (2), Ames Plaza Shopping Center (3). Display/hide their locations on the map
Churches in zip code 22312 include: Antioch Korean Baptist Church (A), Full Gospel Church of Washington (B), Peace Lutheran Church (C), Queen of Apostles Catholic Church (D), Hemere Noah Kidanemeheheret Church (E), Braddock Baptist Church (F), Columbia Church (G), Grace Baptist Church (H), Mount Pleasant Baptist Church (I). Display/hide their locations on the map
3,363 married couples with children.
1,149 single-parent households (391 men, 758 women).
52.7% of residents of 22312 zip code speak English at home.
19.0% of residents speak Spanish at home (61% very well, 20% well, 15% not well, 4% not at all).
8.0% of residents speak other Indo-European language at home (60% very well, 31% well, 6% not well, 3% not at all).
6.8% of residents speak Asian or Pacific Island language at home (45% very well, 30% well, 23% not well, 3% not at all).
14.9% of residents speak other language at home (67% very well, 27% well, 6% not well).
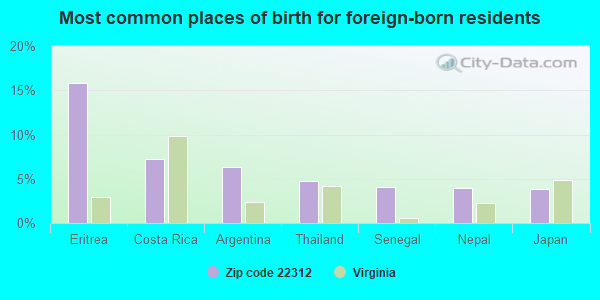
Foreign born population: 10,515 (39.3%) (56.6% of them are naturalized citizens)
This zip code:
39.3%
Whole state:
12.7%
16%Eritrea
7%Costa Rica
6%Argentina
5%Thailand
4%Senegal
4%Nepal
4%Japan
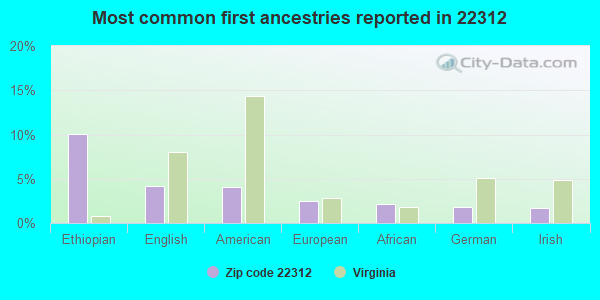
10%Ethiopian
4%English
4%American
2%European
2%African
2%German
2%Irish
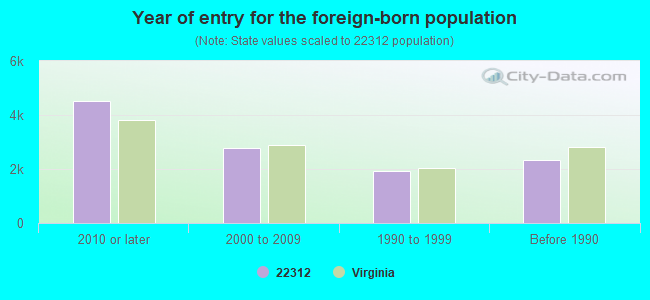
Year of entry for the foreign-born population
4,5172010 or later
2,7832000 to 2009
1,9231990 to 1999
2,323Before 1990
Facilities with environmental interests located in this zip code:
BREN MAR PARK ELEMENTARY SCHOOL (6344 BERYL RD in ALEXANDRIA, VA)
AIR MINOR (AIRS/AFS) STATE MASTER (Virginia pollutants databases) - CEDS-70468, AIR PROGRAM (National Center for Education Statistics) - STATE ID-0290940 Business SIC and NAICS classification: ELEMENTARY AND SECONDARY SCHOOLS Organizations: FAIRFAX COUNTY PUBLIC SCHOOLS (SCHOOL DISTRICT)
Alternative names: BREN MAR PK ELEM SCH
A PLUS DRY CLEANERS (6550A LITTLE RIVER TNPK in ALEXANDRIA, VA)
STATE MASTER (Virginia pollutants databases) - CEDS-72113, AIR PROGRAM Conditionally Exempt Small Quantity Generators, less than 100 kg/month of hazardous waste (Resource Conservation and Recovery Act (tracking hazardous waste)) Business SIC classification: DRYCLEANING PLANTS, EXCEPT RUG CLEANING Business NAICS classification: DRYCLEANING AND LAUNDRY SERVICES (EXCEPT COIN-OPERATED). Organizations: OPERNAME (CONTACT/OPERATOR)
Alternative names: A PLUS CLNR
CHESAPEAKE & POTOMAC TELEPHONE COMPANY (6538 LITTLE RIVER TURNPIKE in ALEXANDRIA, VA)
A+ DRY CLEANERS (6550A LITTLE RIVER TNPK in ALEXANDRIA, VA)
AIR MINOR (AIRS/AFS) Business SIC classification: DRYCLEANING PLANTS, EXCEPT RUG CLEANING Alternative names: TWO 36 CLEANERS INCORPORATED
AIR FORCE WAREHOUSE (5741 GENERAL WASHINGTON DR in ALEXANDRIA, VA)
Small Quantity Generators, between 100 kg and 1000 kg of hazardous waste/month (Resource Conservation and Recovery Act (tracking hazardous waste)) - notification Organizations: OPERNAME (CONTACT/OPERATOR)
, RUBLOFF REAL ESTATE SERVICES (CONTACT/OWNER)
AMOCO #60174-TANKS (6540 EDSALL RD in ALEXANDRIA, VA)
Small Quantity Generators, between 100 kg and 1000 kg of hazardous waste/month (Resource Conservation and Recovery Act (tracking hazardous waste)) - notification Organizations: OPERNAME (CONTACT/OPERATOR)
, AMOCO OIL COMPANY (CONTACT/OWNER)
BRADDOCK CLEANER HECHINGER PLAZA (6555B LITTLE RIVER TURN PIKE in ALEXANDRIA, VA)
Small Quantity Generators, between 100 kg and 1000 kg of hazardous waste/month (Resource Conservation and Recovery Act (tracking hazardous waste)) - notification Organizations: OPERNAME (CONTACT/OPERATOR)
, SUNG JIN KIM (CONTACT/OWNER)
BLAIR INC (5751-A GENERAL WASHINGTON DR in ALEXANDRIA, VA)
Small Quantity Generators, between 100 kg and 1000 kg of hazardous waste/month (Resource Conservation and Recovery Act (tracking hazardous waste)) Organizations: OPERNAME (CONTACT/OPERATOR)
Housing units lacking complete plumbing facilities: 0.4% Housing units lacking complete kitchen facilities: 0.5%
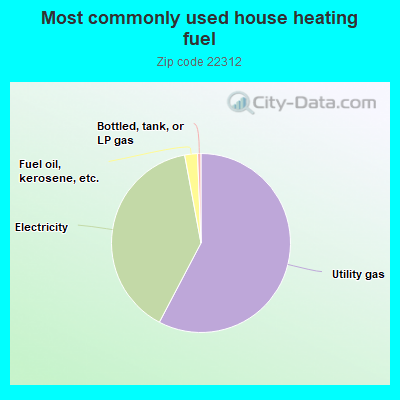
57.3%Utility gas
39.1%Electricity
2.3%Fuel oil, kerosene, etc.
0.6%Bottled, tank, or LP gas
Population in 1990: 23,848. Population change in the 1990s: +4,522 (+19.0%).
Place of birth for U.S.-born residents:
This state: 7,336
Northeast: 1,789
Midwest: 1,429
South: 3,736
West: 1,170
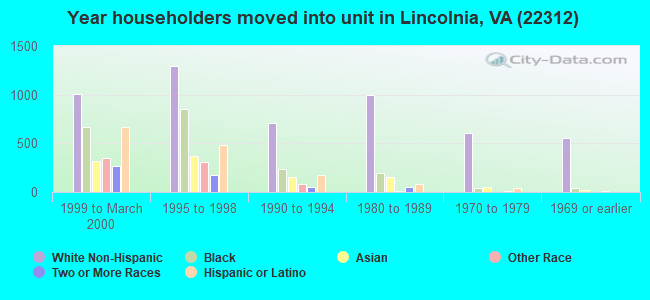
46% of the 22312 zip code residents lived in the same house 5 years ago. Out of people who lived in different houses, 38% lived in this county. Out of people who lived in different counties, 50% lived in Virginia.
89% of the 22312 zip code residents lived in the same house 1 year ago. Out of people who lived in different houses, 25% moved from this county. Out of people who lived in different houses, 31% moved from different county within same state. Out of people who lived in different houses, 32% moved from different state. Out of people who lived in different houses, 14% moved from abroad.
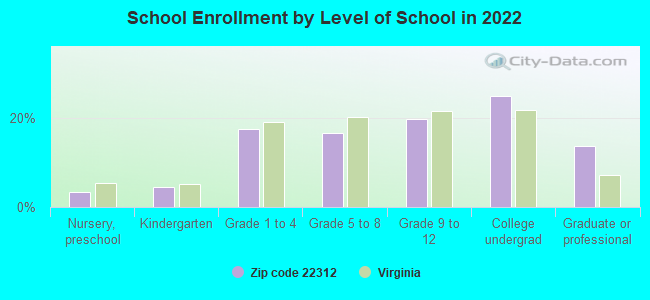
Private vs. public school enrollment:
Students in private schools in grades 1 to 8 (elementary and middle school): 281
Here:
12.9%
Virginia:
13.2%
Students in private schools in grades 9 to 12 (high school): 80
Here:
6.4%
Virginia:
10.2%
Students in private undergraduate colleges: 320
Here:
20.2%
Virginia:
18.7%
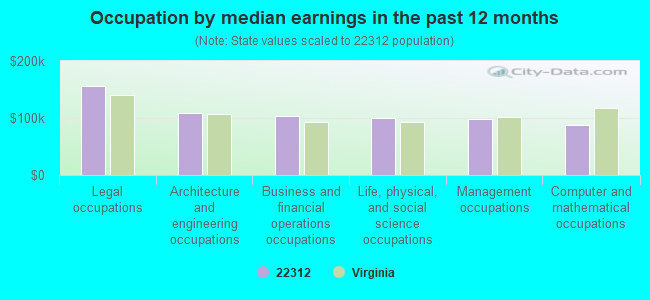
Occupation by median earnings in the past 12 months ($)
156,236Legal occupations
108,680Architecture and engineering occupations
103,688Business and financial operations occupations
99,289Life, physical, and social science occupations
99,105Management occupations
87,689Computer and mathematical occupations
Companies with biggest federal contracts located in this zip code (ALEXANDRIA, VA):
NATIONAL TECHNOLOGIES ASSOCIAT (6601 LITTLE RIVER TURN PIK; small business) : $252,771,930 in 1171 contractsfrom 1999 to 2006
Contracts for Engineering and Technical Services, Logistics Support Services, Systems Engineering Services, Other Professional Services, and moreby Navy, Federal Technology Service, Federal Supply Service, Army, and others Signed by year:2000: $27,432,966; 2001: $38,657,710; 2002: $37,201,096; 2003: $42,623,551; 2004: $45,845,014; 2005: $42,388,457; 2006: $13,986,016.
Biggest contracts:
$7,875,085 with Navy for Engineering and Technical Services. Taking place in MD. Signed on 2005-07-22. Completion date: 2006-07-31.
$6,067,857 with Navy for Logistics Support Services. Taking place in CA. Signed on 2001-05-17. Completion date: 2005-05-31.
$5,404,910 with Navy for Systems Engineering Services. Taking place in FL. Signed on 2002-04-01. Completion date: 2003-03-31.
$4,330,342 with Navy for Other Professional Services. Taking place in FL. Signed on 2001-04-01. Completion date: 2002-09-30.
SYSTEM ENGINEERING TECHNOLOGIE (6121 LINCOLNIA RD SUITE #2; small business) : $80,918,444 in 156 contractsfrom 1999 to 2006
Contracts for Programming Services, Engineering and Technical Services, Policy Review/Development Services, Systems Engineering Services, and moreby Navy, Office of the Secretary, Army, Department of State, and others Signed by year:2000: $53,770,104; 2001: $8,250,716; 2002: $6,142,815; 2003: $4,672,765; 2004: $5,811,012; 2005: $1,036,414; 2006: $188,429.
Biggest contracts:
$47,600,000 with Navy for Programming Services. Signed on 2000-01-21. Completion date: 2000-02-23.
$3,368,812 with Office of the Secretary for Engineering and Technical Services. Taking place in DC. Signed on 2004-12-30. Completion date: 2005-09-30.
$2,919,689 with Navy for Policy Review/Development Services. Taking place in MD. Signed on 2001-02-01. Completion date: 2002-01-31.
$980,000 with Navy for Systems Engineering Services. Signed on 2002-02-26. Completion date: 2002-09-30.
MATERIALS, COMMUNICATION & COM (5285 SHAWNEE ROAD; small business) : $75,695,051 in 378 contractsfrom 1999 to 2006
Contracts for ADP Facility Operation and Maintenance Services, Other Professional Services, Engineering and Technical Services, ADP Systems Development Services, and moreby Financial Crimes Enforcement Network, National Institutes of Health, Air Force, Federal Technology Service, and others Signed by year:2000: $12,577,278; 2001: $16,626,540; 2002: $11,986,783; 2003: $22,621,832; 2004: $5,490,521; 2005: $3,277,763; 2006: $982,277.
Biggest contracts:
$4,998,536 with Financial Crimes Enforcement Network for ADP Facility Operation and Maintenance Services. Signed on 2003-02-15. Completion date: 2003-10-15.
$1,923,013 with National Institutes of Health for ADP Facility Operation and Maintenance Services. Taking place in MD. Signed on 2002-11-15. Completion date: 2003-09-15.
$1,850,212 with Air Force for Other Professional Services. Taking place in MA. Signed on 2001-03-29. Completion date: 2002-03-31.
$1,584,000 with Federal Technology Service for Engineering and Technical Services. Taking place in MA. Signed on 2001-10-15. Completion date: 2002-10-15.
BETAC CORPORATION (5290 SHAWNEE ROAD) : $56,348,057 in 140 contractsfrom 1999 to 2006
Contracts for Other Research and Development -- Management and Support (R&D), Other Defense -- Engineering Development (R&D), Engineering and Technical Services, Program Management/Support Services, and moreby Army, Air Force, Federal Technology Service Signed by year:2000: $33,393,185; 2001: $5,196,058; 2002: $2,726,036; 2003: $298,353; 2004: -$92,192; 2005: $0; 2006: -$982.
Biggest contracts:
$5,938,063 with Army for Other Research and Development -- Management and Support (R&D). Taking place in HI. Signed on 2000-12-29. Completion date: 2001-12-31.
$3,185,582, same as above.Signed on 2000-07-19. Completion date: 2000-12-31.
$3,000,000, same as above.Signed on 1999-12-31. Completion date: 2000-12-31.
$2,750,000 with Air Force for Other Defense -- Engineering Development (R&D). Signed on 2000-10-27. Completion date: 2001-12-31.
INTECS INTERNATIONAL, INC (5252 CHEROKEE AVENUE; small business) : $35,502,738 in 190 contractsfrom 1999 to 2006
Contracts for Automated Information System Design and Integration Services, ADP Systems Development Services, ADP Facility Operation and Maintenance Services, Other Professional Services, and moreby Federal Technology Service, Forest Service (disused code: now 12C2), Navy, Minerals Management Service, and others Signed by year:2000: $11,237,765; 2001: $9,707,259; 2002: $7,934,668; 2003: $5,437,136; 2004: $1,484,157; 2005: $225,592; 2006: -$725,839.
Biggest contracts:
$2,778,000 with Federal Technology Service for Automated Information System Design and Integration Services. Taking place in DC. Signed on 2000-06-15. Completion date: 2003-03-15.
$1,769,000 with Forest Service (disused code: now 12C2) for ADP Systems Development Services. Taking place in CO. Signed on 2001-09-15. Completion date: 2003-12-15.
$1,183,000 with Navy for ADP Facility Operation and Maintenance Services. Signed on 2001-11-07. Completion date: 2002-09-30.
$1,065,784 with Minerals Management Service for Other Professional Services. Signed on 2002-12-15. Completion date: 2004-11-15.
RAVEN, INC (5510 CHEROKEE AVENUE; small business) : $18,521,760 in 103 contractsfrom 1999 to 2006
Contracts for Defense Electronics and Communication Equipment -- Applied Research and Exploratory Development (R&D), Physical Sciences -- Advanced Development (R&D), Program Management/Support Services, Defense Electronics and Communication Equipment -- Basic Research (R&D) by Navy Signed by year:2000: $3,863,295; 2001: $3,287,473; 2002: $3,002,909; 2003: $1,992,340; 2004: $2,576,883; 2005: $2,563,780; 2006: $495,000.
Biggest contracts:
$915,000 with Navy for Defense Electronics and Communication Equipment -- Applied Research and Exploratory Development (R&D). Signed on 2001-01-31. Completion date: 2001-10-12.
$840,000 with Navy for Physical Sciences -- Advanced Development (R&D). Signed on 2005-02-10. Completion date: 2006-06-30.
$652,000 with Navy for Defense Electronics and Communication Equipment -- Applied Research and Exploratory Development (R&D). Signed on 2002-02-04. Completion date: 2002-03-13.
$600,000, same as above.Signed on 2002-12-19. Completion date: 2003-09-29.
PLATINUM INTERNATIONAL, INC (5350 SHAWNEE RD; small business) : $13,993,152 in 75 contractsfrom 1999 to 2004
Contracts for Other Natural Resources and Conservation Services, Environmental Studies and Assessments, Other Environmental Services, Studies, and Analytical Support, Program Management/Support Services, and moreby Army, NASA, Navy Signed by year:2000: $4,320,581; 2001: $3,281,027; 2002: $2,938,117; 2003: $3,328,122; 2004: -$50,695; 2005: $0; 2006: $0.
Biggest contracts:
$1,377,351 with Army for Other Natural Resources and Conservation Services. Signed on 2001-09-30. Completion date: 2002-09-30.
$1,218,700, same as above.Signed on 2000-09-27. Completion date: 2001-09-27.
$804,657 with NASA for Environmental Studies and Assessments. Taking place in CA. Signed on 2003-03-15. Completion date: 2006-10-15.
$795,034 with Army for Other Environmental Services, Studies, and Analytical Support. Signed on 2002-02-20. Completion date: 2003-02-20.
CORPORATE PRESENTATION SERVICE (5655 GENERAL WASHINGTON DR; small business) : $11,629,609 in 141 contractsfrom 1999 to 2006
Contracts for Other Quality Control, Testing and Inspection Services -- Miscellaneous, ADP Components, Installation of Equipment -- Photographic Equipment, Other ADP and Telecommunications Services (includes data storage on tapes, compact disks, etc.), and moreby Navy, Army, Drug Enforcement Administration, Air Force, and others Signed by year:2000: $5,019,280; 2001: $1,625,722; 2002: $960,453; 2003: $2,170,629; 2004: $1,263,998; 2005: $178,736; 2006: $237,575.
Biggest contracts:
$2,999,999 with Navy for Other Quality Control, Testing and Inspection Services -- Miscellaneous. Signed on 2000-03-23. Completion date: 2005-03-22.
$417,303 with Army for ADP Components. Taking place in DC. Signed on 2000-07-27. Completion date: 2001-07-27.
$371,717 with Navy for Installation of Equipment -- Photographic Equipment. Signed on 2003-05-30. Completion date: 2003-09-27.
$359,357 with Army for Other ADP and Telecommunications Services (includes data storage on tapes, compact disks, etc.). Signed on 2003-09-22. Completion date: 2003-10-31.
QUADELTA, INCORPORATED (85 S BRAGG ST STE 302) : $5,803,386 in 30 contractsfrom 1999 to 2005
Contracts for ADP Systems Development Services, Engineering and Technical Services, Other Professional Services, Other Management Support Services by Navy, Office of Policy, Management and Budget/Chief Financial Officer, Army Signed by year:2000: $356,477; 2001: $326,332; 2002: $1,854,856; 2003: $856,661; 2004: $1,049,512; 2005: $1,259,910; 2006: $0.
Biggest contracts:
$896,359 with Navy for ADP Systems Development Services. Signed on 2002-06-17. Completion date: 2003-02-16.
$829,198 with Office of Policy, Management and Budget/Chief Financial Officer for Engineering and Technical Services. Signed on 2005-02-04. Completion date: 2006-02-28.
$654,815 with Navy for Other Professional Services. Taking place in DC. Signed on 2005-01-31. Completion date: 2005-01-31.
$643,860 with Office of Policy, Management and Budget/Chief Financial Officer for Engineering and Technical Services. Signed on 2003-02-15. Completion date: 2004-02-15.
SOFTWARE TECHNOLOGY & INFORMAT (4633 LINMAR COURT; small business) : $4,408,547 in 4 contractsfrom 2002 to 2005
$1,323,120 with Navy for Programming Services. Taking place in DC. Signed on 2002-09-30. Completion date: 2003-08-31.
$1,075,741, same as above.Signed on 2004-08-20. Completion date: 2005-08-31.
$1,068,446, same as above.Signed on 2005-08-31. Completion date: 2006-08-31.
$941,240, same as above.Signed on 2003-09-11. Completion date: 2004-08-31.
Top industries in this zip code by the number of employees in 2005:
Administrative and Support and Waste Management and Remediation Services: All Other Support Services (over 1000 employees: 1 establishment, 10-19 employees: 1 establishment, 5-9 employees: 2 establishments)
Health Care and Social Assistance: Vocational Rehabilitation Services (500-999: 1)
2002 - 2018 National Fire Incident Reporting System (NFIRS) incidents
According to the data from the years 2002 - 2018 the average number of fires per year is 68. The highest number of reported fire incidents - 98 took place in 2010, and the least - 11 in 2002. The data has a growing trend.
When looking into fire subcategories, the most incidents belonged to: Structure Fires (51.0%), and Outside Fires (30.8%).
Fire incident types reported to NFIRS in Zip Code 22312


 Nearest zip codes: 22041, 22311, 22304, 22310, 22044, 22150.


 According to the data from the years 2002 - 2018 the average number of fires per year is 68. The highest number of reported fire incidents - 98 took place in 2010, and the least - 11 in 2002. The data has a growing trend.
 When looking into fire subcategories, the most incidents belonged to: Structure Fires (51.0%), and Outside Fires (30.8%).