Estimated zip code population in 2022: 19,664 Zip code population in 2010: 17,560 Zip code population in 2000: 16,665
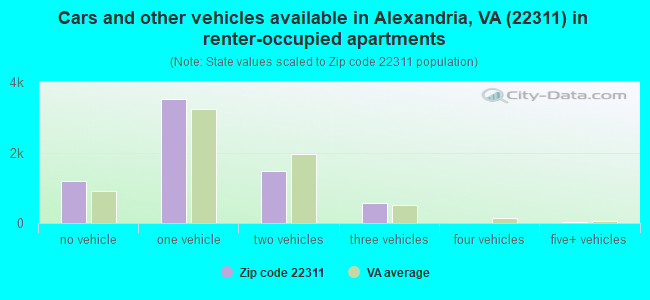
Houses and condos: 9,311 Renter-occupied apartments: 6,758
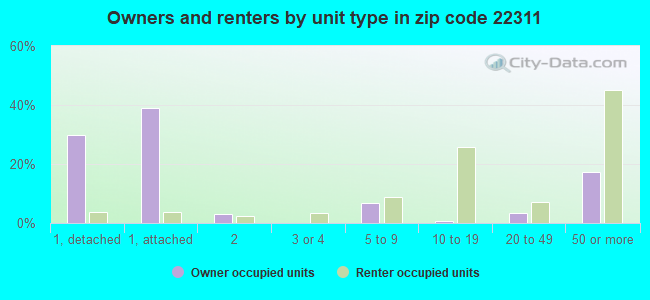
% of renters here:
80%
State:
33%
March 2022 cost of living index in zip code 22311: 169.9 (very high, U.S. average is 100)
Land area: 1.5 sq. mi. Water area: 0.0 sq. mi.
Population density: 12,794 people per square mile
(very high).
OSM Map
General Map
Google Map
MSN Map
OSM Map
General Map
Google Map
MSN Map
OSM Map
General Map
Google Map
MSN Map
OSM Map
General Map
Google Map
MSN Map
Please wait while loading the map...
Real estate property taxes paid for housing units in 2022:
This zip code:
0.9% ($5,751)
Virginia:
0.7% ($2,617)
Median real estate property taxes paid for housing units with mortgages in 2022: $5,177 (0.8%) Median real estate property taxes paid for housing units with no mortgage in 2022: $7,300 (1.0%)
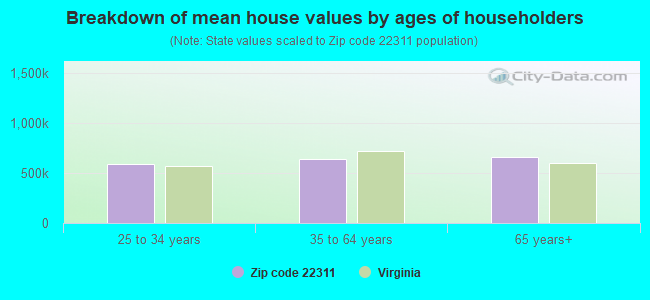
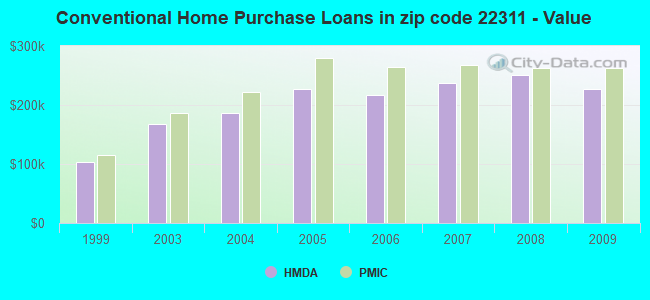
Estimated median house/condo value in 2022: $661,015
22311:
$661,015
Virginia:
$365,700
According to our research of Virginia and other state lists, there were 7 registered sex offenders living in 22311 zip code as of April 26, 2024. The ratio of all residents to sex offenders in zip code 22311 is 2,613 to 1. The ratio of registered sex offenders to all residents in this zip code is much lower than the state average.
Median resident age:
This zip code:
35.7 years
Virginia median age:
39.0 years
Average household size:
This zip code:
2.3 people
Virginia:
2.5 people
Averages for the 2020 tax year for zip code 22311, filed in 2021:
Average Adjusted Gross Income (AGI) in 2020: $72,338 (Individual Income Tax Returns)
Here:
$72,338
State:
$86,446
Salary/wage: $61,301 (reported on 77.1% of returns)
Here:
$61,301
State:
$71,185
(% of AGI for various income ranges: 1127.5% for AGIs below $25k, 3850.3% for AGIs $25k-50k, 7445.1% for AGIs $50k-75k, 10562.8% for AGIs $75k-100k, 16858.0% for AGIs $100k-200k, 64745.0% for AGIs over 200k)
Taxable interest for individuals: $1,529 (reported on 22.3% of returns)
This zip code:
$1,529
Virginia:
$1,805
(% of AGI for various income ranges: 5.2% for AGIs below $25k, 8.7% for AGIs $25k-50k, 20.5% for AGIs $50k-75k, 53.2% for AGIs $75k-100k, 152.4% for AGIs $100k-200k, 824.4% for AGIs over 200k)
Ordinary dividends: $9,108 (reported on 16.8% of returns)
Here:
$9,108
State:
$8,327
(% of AGI for various income ranges: 14.4% for AGIs below $25k, 26.9% for AGIs $25k-50k, 55.0% for AGIs $50k-75k, 223.3% for AGIs $75k-100k, 661.5% for AGIs $100k-200k, 4297.8% for AGIs over 200k)
Net capital gain/loss in AGI: +$22,857 (reported on 16.4% of returns)
Here:
+$22,857
State:
+$24,644
(% of AGI for various income ranges: 4.4% for AGIs below $25k, 16.1% for AGIs $25k-50k, 49.9% for AGIs $50k-75k, 89.3% for AGIs $75k-100k, 591.8% for AGIs $100k-200k, 17937.2% for AGIs over 200k)
Profit/loss from business: +$9,232 (reported on 29.1% of returns)
Here:
+$9,232
State:
+$12,836
(% of AGI for various income ranges: 426.7% for AGIs below $25k, 226.9% for AGIs $25k-50k, 189.3% for AGIs $50k-75k, 193.0% for AGIs $75k-100k, 392.8% for AGIs $100k-200k, 4397.2% for AGIs over 200k)
Taxable individual retirement arrangement distribution: $27,389 (reported on 5.4% of returns)
22311:
$27,389
Virginia:
$21,535
(% of AGI for various income ranges: 22.9% for AGIs below $25k, 40.8% for AGIs $25k-50k, 73.4% for AGIs $50k-75k, 258.7% for AGIs $75k-100k, 552.0% for AGIs $100k-200k, 3978.3% for AGIs over 200k)
Self-employed (Keogh) retirement plans: $35,000 (reported on 0.6% of returns)
22311:
$35,000
Virginia:
$31,172
(% of AGI for various income ranges: 1166.7% for AGIs over 200k)
Total itemized deductions: $34,428 (reported on 14.4% of returns)
Here:
$34,428
State:
$33,287
(% of AGI for various income ranges: 49.7% for AGIs below $25k, 174.4% for AGIs $25k-50k, 425.1% for AGIs $50k-75k, 960.5% for AGIs $75k-100k, 2483.2% for AGIs $100k-200k, 9237.2% for AGIs over 200k)
Charity contributions: $8,144 (reported on 11.5% of returns)
Here:
$8,144
State:
$10,381
(% of AGI for various income ranges: 4.7% for AGIs below $25k, 33.8% for AGIs $25k-50k, 76.8% for AGIs $50k-75k, 136.5% for AGIs $75k-100k, 376.8% for AGIs $100k-200k, 2395.0% for AGIs over 200k)
Taxes paid: $7,643 (reported on 14.3% of returns)
22311:
$7,643
State:
$8,284
(% of AGI for various income ranges: 6.7% for AGIs below $25k, 24.9% for AGIs $25k-50k, 75.8% for AGIs $50k-75k, 221.7% for AGIs $75k-100k, 617.5% for AGIs $100k-200k, 1987.2% for AGIs over 200k)
Earned income credit: $2,113 (reported on 18.3% of returns)
Here:
$2,113
State:
$2,214
(% of AGI for various income ranges: 116.5% for AGIs below $25k, 77.6% for AGIs $25k-50k, 1.4% for AGIs $50k-75k)
Percentage of individuals using paid preparers for their 2020 taxes: 89.8%
Here:
90%
State:
92%
(% for various income ranges: 86.0% for AGIs below $25k, 92.9% for AGIs $25k-50k, 91.1% for AGIs $50k-75k, 92.4% for AGIs $75k-100k, 90.6% for AGIs $100k-200k, 91.4% for AGIs over 200k)
Averages for the 2012 tax year for zip code 22311, filed in 2013:
Average Adjusted Gross Income (AGI) in 2012: $59,203 (Individual Income Tax Returns)
Here:
$59,203
State:
$71,192
Salary/wage: $54,763 (reported on 85.3% of returns)
Here:
$54,763
State:
$59,229
(% of AGI for various income ranges: 79.9% for AGIs below $25k, 90.6% for AGIs $25k-50k, 86.5% for AGIs $50k-75k, 83.2% for AGIs $75k-100k, 75.7% for AGIs $100k-200k, 64.0% for AGIs over 200k)
Taxable interest for individuals: $1,459 (reported on 27.1% of returns)
This zip code:
$1,459
Virginia:
$1,600
(% of AGI for various income ranges: 0.5% for AGIs below $25k, 0.4% for AGIs $25k-50k, 0.5% for AGIs $50k-75k, 0.6% for AGIs $75k-100k, 0.9% for AGIs $100k-200k, 1.0% for AGIs over 200k)
Ordinary dividends: $7,425 (reported on 16.6% of returns)
Here:
$7,425
State:
$6,959
(% of AGI for various income ranges: 0.7% for AGIs below $25k, 0.6% for AGIs $25k-50k, 1.2% for AGIs $50k-75k, 1.5% for AGIs $75k-100k, 3.3% for AGIs $100k-200k, 3.3% for AGIs over 200k)
Net capital gain/loss in AGI: +$6,490 (reported on 13.9% of returns)
Here:
+$6,490
State:
+$16,672
(% of AGI for various income ranges: 0.2% for AGIs $75k-100k, 1.5% for AGIs $100k-200k, 5.5% for AGIs over 200k)
Profit/loss from business: +$10,604 (reported on 17.9% of returns)
Here:
+$10,604
State:
+$14,116
(% of AGI for various income ranges: 15.8% for AGIs below $25k, 3.3% for AGIs $25k-50k, 1.1% for AGIs $50k-75k, 1.5% for AGIs $75k-100k, 1.5% for AGIs $100k-200k, 3.5% for AGIs over 200k)
Taxable individual retirement arrangement distribution: $14,367 (reported on 5.8% of returns)
22311:
$14,367
Virginia:
$16,667
(% of AGI for various income ranges: 0.8% for AGIs below $25k, 0.8% for AGIs $25k-50k, 1.0% for AGIs $50k-75k, 1.3% for AGIs $75k-100k, 1.7% for AGIs $100k-200k, 2.2% for AGIs over 200k)
Self-employment retirement plans: $29,667 (reported on 0.6% of returns)
22311:
$29,667
Virginia:
$25,373
Total itemized deductions: $23,651 (23% of AGI, reported on 34.7% of returns)
Here:
$23,651
State:
$26,596
Here:
23.3% of AGI
State:
20.1% of AGI
(% of AGI for various income ranges: 11.6% for AGIs below $25k, 13.6% for AGIs $25k-50k, 11.1% for AGIs $50k-75k, 13.3% for AGIs $75k-100k, 15.9% for AGIs $100k-200k, 15.0% for AGIs over 200k)
Charity contributions: $3,699 (reported on 27.5% of returns)
Here:
$3,699
State:
$4,443
(% of AGI for various income ranges: 0.8% for AGIs below $25k, 1.3% for AGIs $25k-50k, 1.4% for AGIs $50k-75k, 1.7% for AGIs $75k-100k, 2.2% for AGIs $100k-200k, 2.1% for AGIs over 200k)
Taxes paid: $7,429 (reported on 34.4% of returns)
22311:
$7,429
State:
$9,951
(% of AGI for various income ranges: 1.0% for AGIs below $25k, 1.9% for AGIs $25k-50k, 2.5% for AGIs $50k-75k, 4.0% for AGIs $75k-100k, 6.1% for AGIs $100k-200k, 7.0% for AGIs over 200k)
Earned income credit: $2,005 (reported on 15.9% of returns)
Here:
$2,005
State:
$2,211
(% of AGI for various income ranges: 5.8% for AGIs below $25k, 0.7% for AGIs $25k-50k)
Percentage of individuals using paid preparers for their 2012 taxes: 55.1%
Here:
55%
State:
46%
(% for various income ranges: 62.9% for AGIs below $25k, 55.7% for AGIs $25k-50k, 47.8% for AGIs $50k-75k, 45.9% for AGIs $75k-100k, 46.1% for AGIs $100k-200k, 62.2% for AGIs over 200k)
Averages for the 2004 tax year for zip code 22311, filed in 2005:
Average Adjusted Gross Income (AGI) in 2004: $53,518 (Individual Income Tax Returns)
Here:
$53,518
State:
$56,704
Salary/wage: $48,674 (reported on 86.6% of returns)
Here:
$48,674
State:
$48,441
(% of AGI for various income ranges: 95.0% for AGIs below $10k, 87.0% for AGIs $10k-25k, 90.9% for AGIs $25k-50k, 85.4% for AGIs $50k-75k, 79.5% for AGIs $75k-100k, 67.4% for AGIs over 100k)
Taxable interest for individuals: $1,974 (reported on 38.4% of returns)
This zip code:
$1,974
Virginia:
$1,688
(% of AGI for various income ranges: 2.0% for AGIs below $10k, 0.9% for AGIs $10k-25k, 0.7% for AGIs $25k-50k, 1.0% for AGIs $50k-75k, 1.5% for AGIs $75k-100k, 2.0% for AGIs over 100k)
Taxable dividends: $4,757 (reported on 22.1% of returns)
Here:
$4,757
State:
$4,028
(% of AGI for various income ranges: 2.9% for AGIs below $10k, 1.0% for AGIs $10k-25k, 0.7% for AGIs $25k-50k, 1.4% for AGIs $50k-75k, 2.1% for AGIs $75k-100k, 3.0% for AGIs over 100k)
Net capital gain/loss: +$10,927 (reported on 18.5% of returns)
Here:
+$10,927
State:
+$14,375
(% of AGI for various income ranges: -1.4% for AGIs below $10k, -0.1% for AGIs $10k-25k, 0.1% for AGIs $25k-50k, 0.7% for AGIs $50k-75k, 1.0% for AGIs $75k-100k, 8.7% for AGIs over 100k)
Profit/loss from business: +$10,203 (reported on 13.9% of returns)
Here:
+$10,203
State:
+$13,342
(% of AGI for various income ranges: 23.8% for AGIs below $10k, 6.6% for AGIs $10k-25k, 1.6% for AGIs $25k-50k, 0.8% for AGIs $50k-75k, 1.8% for AGIs $75k-100k, 3.0% for AGIs over 100k)
IRA payment deduction: $2,740 (reported on 1.9% of returns)
22311:
$2,740
Virginia:
$2,943
(% of AGI for various income ranges: 0.1% for AGIs $10k-25k, 0.2% for AGIs $25k-50k, 0.1% for AGIs $50k-75k, 0.1% for AGIs $75k-100k, 0.1% for AGIs over 100k)
Self-employed pension: $15,544 (reported on 0.8% of returns)
Here:
$15,544
Virginia:
$17,430
Total itemized deductions: $21,189 (23% of AGI, reported on 35.2% of returns)
Here:
$21,189
State:
$21,492
Here:
23.0% of AGI
State:
21.0% of AGI
(% of AGI for various income ranges: 11.1% for AGIs below $10k, 12.1% for AGIs $10k-25k, 11.8% for AGIs $25k-50k, 11.5% for AGIs $50k-75k, 14.7% for AGIs $75k-100k, 16.3% for AGIs over 100k)
Charity contributions deductions: $4,146 (4% of AGI, reported on 31.1% of returns)
Here:
$4,146
State:
$3,794
Here:
4.3% of AGI
State:
3.5% of AGI
(% of AGI for various income ranges: 0.6% for AGIs below $10k, 1.3% for AGIs $10k-25k, 1.7% for AGIs $25k-50k, 1.9% for AGIs $50k-75k, 2.0% for AGIs $75k-100k, 3.4% for AGIs over 100k)
Total tax: $8,658 (reported on 83.9% of returns)
22311:
$8,658
State:
$9,537
(% of AGI for various income ranges: 4.7% for AGIs below $10k, 4.7% for AGIs $10k-25k, 8.3% for AGIs $25k-50k, 12.2% for AGIs $50k-75k, 14.1% for AGIs $75k-100k, 18.6% for AGIs over 100k)
Earned income credit: $1,411 (reported on 11.0% of returns)
Here:
$1,411
State:
$1,734
Percentage of individuals using paid preparers for their 2004 taxes: 53.9%
Here:
54%
State:
52%
(% for various income ranges: 54.6% for AGIs below $10k, 63.8% for AGIs $10k-25k, 54.0% for AGIs $25k-50k, 45.4% for AGIs $50k-75k, 48.3% for AGIs $75k-100k, 49.3% for AGIs over 100k)
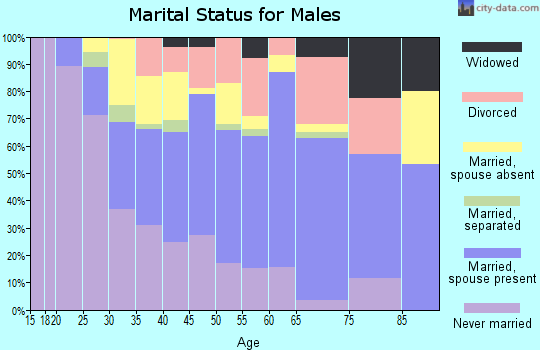
Likely homosexual households (counted as self-reported same-sex unmarried-partner households)
Lesbian couples: 0.0% of all households
Gay men: 0.4% of all households
Household received Food Stamps/SNAP in the past 12 months: 769 Household did not receive Food Stamps/SNAP in the past 12 months: 7,716
Women who had a birth in the past 12 months: 310 (319 now married, 0 unmarried) Women who did not have a birth in the past 12 months: 4,833 (1,904 now married, 2,935 unmarried)
Housing units in zip code 22311 with a mortgage: 1,272 (194 second mortgage, 172 both second mortgage and home equity loan) Houses without a mortgage: 17
Median monthly owner costs for units with a mortgage: $2,833 Median monthly owner costs for units without a mortgage: $940
Residents with income below the poverty level in 2022:
This zip code:
10.8%
Whole state:
10.6%
Residents with income below 50% of the poverty level in 2022:
This zip code:
6.1%
Whole state:
5.2%
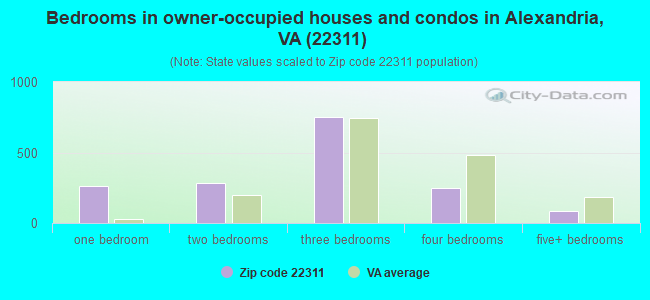
Median number of rooms in houses and condos:
Here:
6.2
State:
7.0
Median number of rooms in apartments:
Here:
3.5
State:
4.3
Notable locations in this zip code not listed on our city pages
Churches in zip code 22311 include: United Methodist Church (A), All Nations Church of God (B), Church of the Resurrection (C), Saint James United Methodist Church (D), Church of Resurrection Episcopal (E). Display/hide their locations on the map
2,969 married couples with children.
1,092 single-parent households (305 men, 787 women).
49.5% of residents of 22311 zip code speak English at home.
19.4% of residents speak Spanish at home (52% very well, 19% well, 18% not well, 11% not at all).
11.0% of residents speak other Indo-European language at home (75% very well, 20% well, 3% not well, 2% not at all).
1.3% of residents speak Asian or Pacific Island language at home (80% very well, 20% well).
20.9% of residents speak other language at home (55% very well, 30% well, 12% not well, 3% not at all).
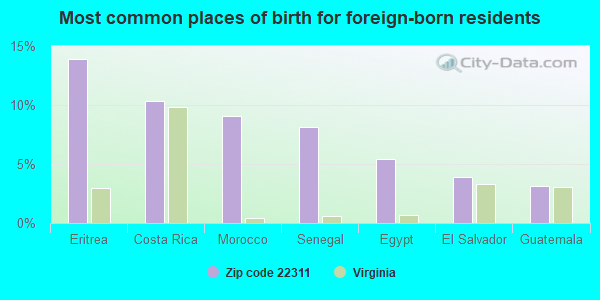
Foreign born population: 8,151 (41.5%) (37.5% of them are naturalized citizens)
Facilities with environmental interests located in this zip code:
ALEXANDRIA CITY PUBLIC SCHOOLS (2000 BEAUREGARDE STREET in ALEXANDRIA, VA)
COMPLIANCE ACTIVITY (Tracking inspections of insecticide, fungicide, and rodenticide, and toxic substances)
CALCOMP (4900 SEMINARY RD STE 450 in ALEXANDRIA, VA)
Conditionally Exempt Small Quantity Generators, less than 100 kg/month of hazardous waste (Resource Conservation and Recovery Act (tracking hazardous waste)) - notification Organizations: MARK WINKLER MGMT CO (CONTACT/OWNER)
Housing units lacking complete kitchen facilities: 1.4%
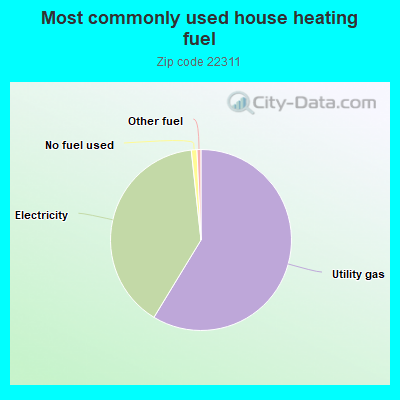
58.3%Utility gas
39.3%Electricity
1.0%No fuel used
0.7%Other fuel
Population in 1990: 11,388. Population change in the 1990s: +5,277 (+46.3%).
Place of birth for U.S.-born residents:
This state: 4,466
Northeast: 1,989
Midwest: 1,112
South: 2,354
West: 746
36% of the 22311 zip code residents lived in the same house 5 years ago. Out of people who lived in different houses, 23% lived in this county. Out of people who lived in different counties, 50% lived in Virginia.
81% of the 22311 zip code residents lived in the same house 1 year ago. Out of people who lived in different houses, 25% moved from this county. Out of people who lived in different houses, 46% moved from different county within same state. Out of people who lived in different houses, 21% moved from different state. Out of people who lived in different houses, 6% moved from abroad.
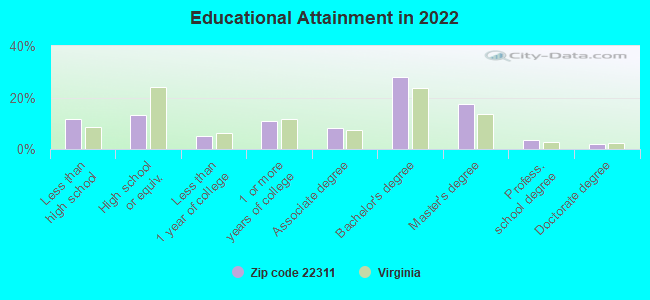
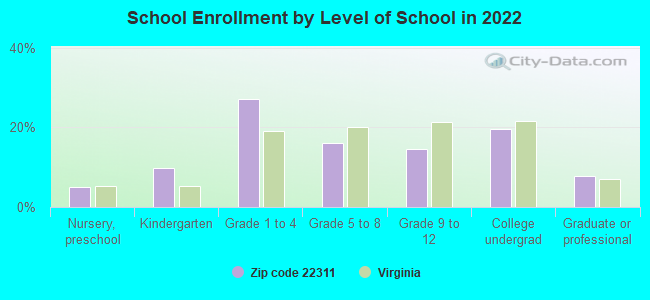
Private vs. public school enrollment:
Students in private schools in grades 1 to 8 (elementary and middle school): 144
Here:
8.6%
Virginia:
13.2%
Students in private schools in grades 9 to 12 (high school): 83
Here:
14.7%
Virginia:
10.2%
Students in private undergraduate colleges: 171
Here:
22.6%
Virginia:
18.7%
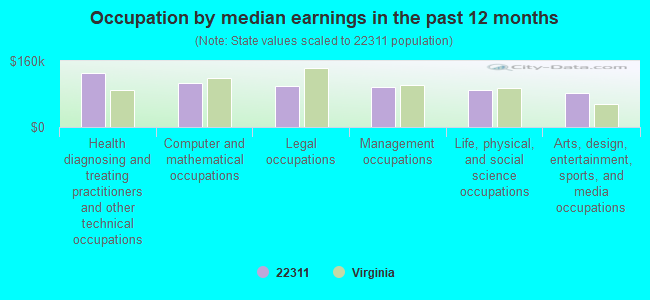
Occupation by median earnings in the past 12 months ($)
131,539Health diagnosing and treating practitioners and other technical occupations
106,617Computer and mathematical occupations
100,156Legal occupations
95,913Management occupations
89,077Life, physical, and social science occupations
82,485Arts, design, entertainment, sports, and media occupations
Companies with biggest federal contracts located in this zip code (ALEXANDRIA, VA):
INSTITUTE FOR DEFENSE ANALYSES (4850 MARK CENTER DRIVE) : $964,263,048 in 190 contractsfrom 1999 to 2006
Contracts for Services -- Basic Research (R&D), Defense Studies, Other Professional Services, R&D-SVCS-COMERCLIZ, and moreby Army, NATIONAL SCIENCE FOUNDATION, Public Buildings Service, Washington Headquarters Services, and others Signed by year:2000: $109,814,907; 2001: $56,229,919; 2002: $122,947,263; 2003: $111,430,203; 2004: $115,866,531; 2005: $329,009,751; 2006: $102,172,474.
Biggest contracts:
$229,505,315 with Army for Services -- Basic Research (R&D). Signed on 2005-08-26. Completion date: 2006-09-30.
$49,805,830, same as above.Signed on 2006-03-17. Effective on 2006-02-28. Completion date: 2007-02-27.
$37,318,810, same as above.Signed on 2002-03-05. Completion date: 2003-09-30.
$30,292,000, same as above.Signed on 2004-11-01. Completion date: 2005-09-30.
A B TECHNOLOGIES, INC (1701 NORTH BEAUREGARD STRE; small business) : $42,555,432 in 285 contractsfrom 1999 to 2006
Contracts for Automated Information System Design and Integration Services, ADP Systems Analysis Services, Personal Care Services (includes such services as barber and beauty shop, shoe repairs, tailoring, etc.), ADP Facility Operation and Maintenance Services, and moreby Department of Veterans Affairs, Federal Technology Service, Army, Navy, and others Signed by year:2000: $22,627,320; 2001: $7,747,782; 2002: $3,550,493; 2003: -$45,969; 2004: $0; 2005: $562,491; 2006: $1,919,934.
Biggest contracts:
$2,219,000 with Department of Veterans Affairs for Automated Information System Design and Integration Services. Signed on 2002-04-15. Completion date: 2002-07-15.
$1,503,000 with Federal Technology Service for ADP Systems Analysis Services. Taking place in DC. Signed on 2000-01-15. Completion date: 2001-01-15.
$1,289,378 with Army for Personal Care Services (includes such services as barber and beauty shop, shoe repairs, tailoring, etc.). Taking place in DC. Signed on 2006-02-14. Effective on 2006-02-09. Completion date: 2006-05-15.
$1,279,000 with Department of Veterans Affairs for Automated Information System Design and Integration Services. Signed on 2001-05-15. Completion date: 2002-04-15.
AVINEON, INC (4825 MARK CENTER DRIVE; small business) : $39,141,260 in 205 contractsfrom 1999 to 2006
Contracts for ADP Software, ADP Systems Analysis Services, Programming Services, ADP System Acquisition Support Services. Includes preparation of statement of work, benchmarks, specifications, etc., and moreby Financial Management Service, Federal Technology Service, Navy, United States Mint, and others Signed by year:2000: $2,771,012; 2001: $4,444,906; 2002: $6,551,425; 2003: $4,431,031; 2004: $9,674,504; 2005: $6,484,930; 2006: $3,469,784.
Biggest contracts:
$3,000,000 with Financial Management Service for ADP Software. Taking place in MD. Signed on 2002-09-15. Completion date: 2003-09-15.
$1,371,000, same as above.Signed on 2002-09-15. Completion date: 2003-09-15.
$1,330,480 with Federal Technology Service for ADP Systems Analysis Services. Signed on 2005-05-17. Completion date: 2008-05-09.
$1,324,000 with Financial Management Service for Programming Services. Taking place in MD. Signed on 2001-09-15. Completion date: 2002-09-15.
EMCUBEINC (4900 SEMINARY ROAD, SUITE; small business) : $14,457,225 in 39 contractsfrom 1999 to 2006
Contracts for Technical Representation Services -- Guided Missiles, Engineering and Technical Services, Technical Representation Services -- Miscellaneous, Program Management/Support Services by Navy Signed by year:2000: $1,140,048; 2001: $459,367; 2002: $1,865,717; 2003: $2,725,025; 2004: $2,486,597; 2005: $3,896,551; 2006: $1,045,882.
Biggest contracts:
$1,608,343 with Navy for Technical Representation Services -- Guided Missiles. Signed on 2005-11-17. Completion date: 2006-09-30.
$1,368,000 with Navy for Engineering and Technical Services. Signed on 2004-12-07. Completion date: 2005-09-30.
$1,000,394, same as above.Signed on 2003-11-24. Completion date: 2004-09-30.
$943,136, same as above.Signed on 2003-01-06. Completion date: 2003-09-30.
MILITARY OPERATIONS RESEARCH S (1703 N BEAUREGARD STREET) : $3,368,225 in 24 contractsfrom 1999 to 2006
Contracts for Other Professional Services by Navy Signed by year:2000: $357,420; 2001: $977,280; 2002: $206,350; 2003: $494,775; 2004: $516,000; 2005: $513,500; 2006: $190,000.
Biggest contracts:
$657,000 with Navy for Other Professional Services. Signed on 2001-09-27. Completion date: 2001-12-31.
$215,000, same as above.Signed on 2005-12-22. Completion date: 2006-12-31.
$212,100, same as above.Signed on 2003-04-08. Completion date: 2003-12-31.
$208,800, same as above.Signed on 2003-01-10. Completion date: 2003-12-31.
INFINITE COMPUTER TECHNOLOGIES (1800 N BEAUREGARD ST # 15; small business) : $1,354,861 in 6 contractsfrom 2002 to 2005
Contracts for ADP Facility Operation and Maintenance Services, ADP Backup and Security Services, Maintenance, Repair and Rebuilding of Equipment -- Miscellaneous by Navy Signed by year:2000: $0; 2001: $0; 2002: $842,425; 2003: $0; 2004: $252,900; 2005: $259,536; 2006: $0.
Biggest contracts:
$414,648 with Navy for ADP Facility Operation and Maintenance Services. Signed on 2002-12-02. Completion date: 2003-09-30.
$330,966, same as above.Signed on 2002-03-27. Completion date: 2002-07-06.
$259,536 with Navy for ADP Backup and Security Services. Taking place in PA. Signed on 2005-10-21. Completion date: 2007-09-30.
$252,900 with Navy for Maintenance, Repair and Rebuilding of Equipment -- Miscellaneous. Signed on 2004-10-27. Completion date: 2005-09-30.
ALION SCIENCE AND TECHNOLOGY C (1701 N BEAUREGARD ST #600) : $1,019,117 in 18 contractsfrom 2003 to 2006
Contracts for Other Defense -- Engineering Development (R&D), Program Management/Support Services, Other ADP and Telecommunications Services (includes data storage on tapes, compact disks, etc.), Invalid code: AD97, and moreby Air Force, Army, Federal Technology Service, NASA, and others Signed by year:2000: $0; 2001: $0; 2002: $0; 2003: $113,820; 2004: $65,541; 2005: $553,176; 2006: $286,580.
Biggest contracts:
$233,176 with Air Force for Other Defense -- Engineering Development (R&D). Signed on 2005-07-01. Completion date: 2006-12-29.
$202,000, same as above.Signed on 2006-01-13. Completion date: 2006-12-29.
$87,080, same as above.Signed on 2006-01-25. Completion date: 2006-12-29.
$80,000 with Army for Program Management/Support Services. Signed on 2005-07-08. Completion date: 2006-01-16.
IIT RESEARCH INSTITUTE (1701 N. BEAUREGARD STREET; small business) : $958,096 in 9 contractsin 2000
Contracts for Defense Studies by Army Signed by year:2000: $958,096; 2001: $0; 2002: $0; 2003: $0; 2004: $0; 2005: $0; 2006: $0.
Biggest contracts:
$172,999 with Army for Defense Studies. Taking place in KY. Signed on 2000-09-29. Completion date: 2000-12-31.
$149,937, same as above.Signed on 2000-09-26. Completion date: 2001-01-12.
$149,453, same as above.Signed on 2000-09-16. Completion date: 2001-01-12.
$129,999, same as above.Signed on 2000-09-30. Completion date: 2001-09-24.
RADISSON HOTEL CORPORATION (5000 SEMINARY RD) : $771,969 in 16 contractsfrom 2000 to 2004
Contracts for Lodging - Hotel/Motel, Lease or Rental of Facilities -- Conference Space and Facilities, ADP Central Processing Unit (CPU, Computer), Digital, Miscellaneous Items by Army, Office of Policy, Management and Budget/Chief Financial Officer, Bureau of the Census, Internal Revenue Service, and others Signed by year:2000: $460,819; 2001: $227,000; 2002: $56,000; 2003: $0; 2004: $28,150; 2005: $0; 2006: $0.
Biggest contracts:
$135,382 with Army for Lodging - Hotel/Motel. Signed on 2000-03-14. Completion date: 2000-04-08.
$125,437, same as above.Signed on 2000-03-22. Completion date: 2000-04-08.
$82,000 with Office of Policy, Management and Budget/Chief Financial Officer for Lease or Rental of Facilities -- Conference Space and Facilities. Signed on 2001-05-15. Completion date: 2001-06-15.
$80,000 with Bureau of the Census for ADP Central Processing Unit (CPU, Computer), Digital. Signed on 2001-09-15. Completion date: 2001-11-15.
IIT RESEARCH INSTITUTE (1701 N BEAUREGARD STREET) : $612,482 in 9 contractsfrom 2001 to 2002
Contracts for Other Professional Services, Other ADP and Telecommunications Services (includes data storage on tapes, compact disks, etc.), Contract, Procurement, and Acquisition Support Services, ADP Support Equipment, and moreby Army, Air Force, Navy Signed by year:2000: $0; 2001: $133,030; 2002: $479,452; 2003: $0; 2004: $0; 2005: $0; 2006: $0.
Biggest contracts:
$156,809 with Army for Other Professional Services. Signed on 2002-01-30. Completion date: 2002-10-30.
$123,750 with Air Force for Other ADP and Telecommunications Services (includes data storage on tapes, compact disks, etc.). Signed on 2002-09-29. Completion date: 2002-10-21.
$99,927 with Navy for Contract, Procurement, and Acquisition Support Services. Taking place in MD. Signed on 2001-04-11. Completion date: 2002-01-03.
$68,000 with Air Force for ADP Support Equipment. Signed on 2002-08-26. Completion date: 2002-09-06.
Top industries in this zip code by the number of employees in 2005:
Professional, Scientific, and Technical Services: Research and Development in the Physical, Engineering, and Life Sciences (500-999 employees: 2 establishments, 250-499 employees: 1 establishment, 50-99 employees: 1 establishment, 20-49 employees: 1 establishment, 10-19 employees: 3 establishments, 1-4 employees: 1 establishment)
Administrative and Support and Waste Management and Remediation Services: Office Administrative Services (500-999: 1)
Health Care and Social Assistance: Nursing Care Facilities (250-499: 1, 100-249: 1)
Real Estate and Rental and Leasing: Residential Property Managers (250-499: 1, 10-19: 2)
2002 - 2018 National Fire Incident Reporting System (NFIRS) incidents
Based on the data from the years 2002 - 2018 the average number of fire incidents per year is 60. The highest number of reported fires - 85 took place in 2013, and the least - 20 in 2017. The data has a decreasing trend.
When looking into fire subcategories, the most incidents belonged to: Structure Fires (69.2%), and Outside Fires (18.5%).
Fire incident types reported to NFIRS in Zip Code 22311

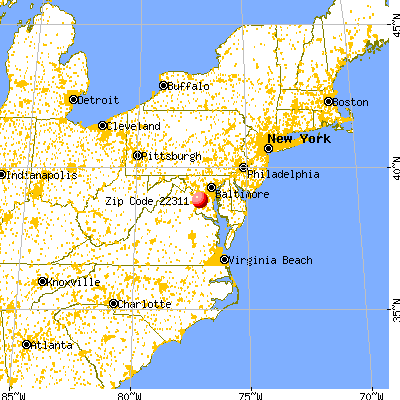


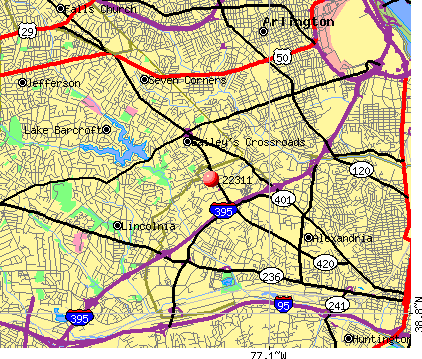 Nearest zip codes: 22041, 22304, 22312, 22206, 22204, 22044.


 Based on the data from the years 2002 - 2018 the average number of fire incidents per year is 60. The highest number of reported fires - 85 took place in 2013, and the least - 20 in 2017. The data has a decreasing trend.
 When looking into fire subcategories, the most incidents belonged to: Structure Fires (69.2%), and Outside Fires (18.5%).