Estimated zip code population in 2022: 18,649 Zip code population in 2010: 17,087 Zip code population in 2000: 15,864
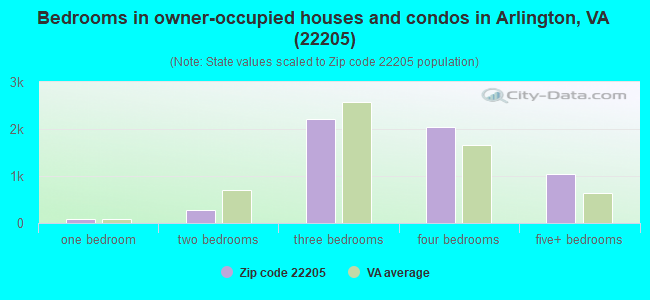
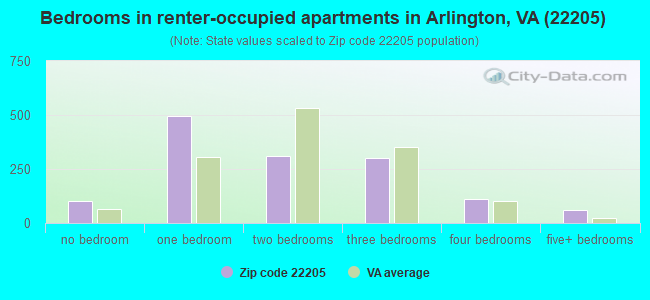
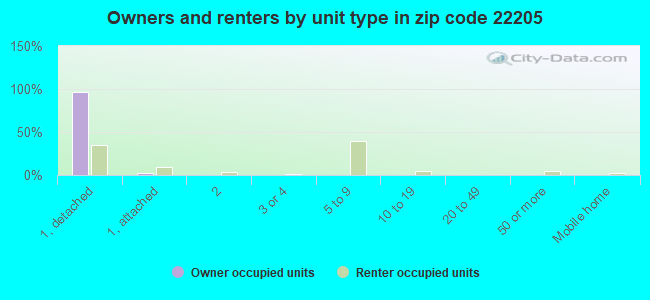
Houses and condos: 6,987 Renter-occupied apartments: 1,361
% of renters here:
19%
State:
33%
March 2022 cost of living index in zip code 22205: 164.3 (very high, U.S. average is 100)
Land area: 2.7 sq. mi. Water area: 0.0 sq. mi.
Population density: 6,897 people per square mile
(high).
OSM Map
General Map
Google Map
MSN Map
OSM Map
General Map
Google Map
MSN Map
OSM Map
General Map
Google Map
MSN Map
OSM Map
General Map
Google Map
MSN Map
Please wait while loading the map...
Real estate property taxes paid for housing units in 2022:
This zip code:
0.9% ($9,180)
Virginia:
0.7% ($2,617)
Median real estate property taxes paid for housing units with mortgages in 2022: $9,335 (0.8%) Median real estate property taxes paid for housing units with no mortgage in 2022: $9,100 (0.9%)
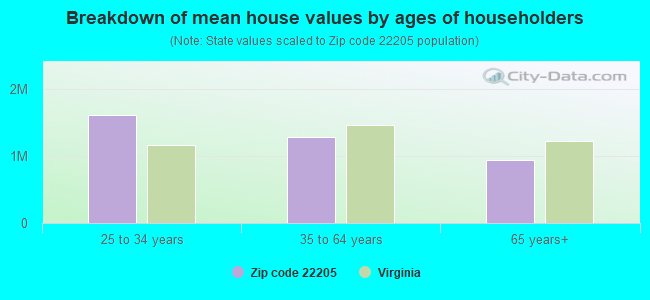
Estimated median house/condo value in 2022: $1,064,813
22205:
$1,064,813
Virginia:
$365,700
According to our research of Virginia and other state lists, there were 5 registered sex offenders living in 22205 zip code as of April 27, 2024. The ratio of all residents to sex offenders in zip code 22205 is 3,894 to 1. The ratio of registered sex offenders to all residents in this zip code is much lower than the state average.
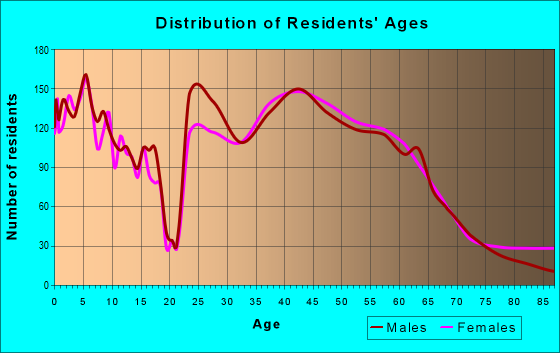
Median resident age:
This zip code:
41.9 years
Virginia median age:
39.0 years
Average household size:
This zip code:
2.6 people
Virginia:
2.5 people
Averages for the 2020 tax year for zip code 22205, filed in 2021:
Average Adjusted Gross Income (AGI) in 2020: $193,894 (Individual Income Tax Returns)
Here:
$193,894
State:
$86,446
Salary/wage: $165,889 (reported on 80.0% of returns)
Here:
$165,889
State:
$71,185
(% of AGI for various income ranges: 1173.3% for AGIs below $25k, 3755.5% for AGIs $25k-50k, 6258.8% for AGIs $50k-75k, 9212.5% for AGIs $75k-100k, 17423.4% for AGIs $100k-200k, 89687.6% for AGIs over 200k)
Taxable interest for individuals: $2,280 (reported on 60.1% of returns)
This zip code:
$2,280
Virginia:
$1,805
(% of AGI for various income ranges: 28.6% for AGIs below $25k, 60.2% for AGIs $25k-50k, 68.5% for AGIs $50k-75k, 174.7% for AGIs $75k-100k, 266.2% for AGIs $100k-200k, 778.3% for AGIs over 200k)
Ordinary dividends: $9,369 (reported on 53.8% of returns)
Here:
$9,369
State:
$8,327
(% of AGI for various income ranges: 87.7% for AGIs below $25k, 146.5% for AGIs $25k-50k, 229.0% for AGIs $50k-75k, 475.8% for AGIs $75k-100k, 971.8% for AGIs $100k-200k, 3013.1% for AGIs over 200k)
Net capital gain/loss in AGI: +$24,976 (reported on 48.2% of returns)
Here:
+$24,976
State:
+$24,644
(% of AGI for various income ranges: 52.2% for AGIs below $25k, 79.5% for AGIs $25k-50k, 171.5% for AGIs $50k-75k, 291.4% for AGIs $75k-100k, 1173.3% for AGIs $100k-200k, 9206.9% for AGIs over 200k)
Profit/loss from business: +$30,473 (reported on 20.5% of returns)
Here:
+$30,473
State:
+$12,836
(% of AGI for various income ranges: 262.4% for AGIs below $25k, 264.2% for AGIs $25k-50k, 301.3% for AGIs $50k-75k, 545.0% for AGIs $75k-100k, 974.1% for AGIs $100k-200k, 3773.8% for AGIs over 200k)
Taxable individual retirement arrangement distribution: $25,670 (reported on 11.3% of returns)
22205:
$25,670
Virginia:
$21,535
(% of AGI for various income ranges: 59.3% for AGIs below $25k, 117.6% for AGIs $25k-50k, 246.0% for AGIs $50k-75k, 491.9% for AGIs $75k-100k, 848.0% for AGIs $100k-200k, 1259.8% for AGIs over 200k)
Self-employed (Keogh) retirement plans: $33,981 (reported on 4.4% of returns)
22205:
$33,981
Virginia:
$31,172
(% of AGI for various income ranges: 96.9% for AGIs $100k-200k, 1218.5% for AGIs over 200k)
Total itemized deductions: $38,147 (reported on 38.9% of returns)
Here:
$38,147
State:
$33,287
(% of AGI for various income ranges: 197.8% for AGIs below $25k, 422.6% for AGIs $25k-50k, 837.3% for AGIs $50k-75k, 1353.9% for AGIs $75k-100k, 2830.1% for AGIs $100k-200k, 8886.3% for AGIs over 200k)
Charity contributions: $7,952 (reported on 33.9% of returns)
Here:
$7,952
State:
$10,381
(% of AGI for various income ranges: 3.7% for AGIs below $25k, 23.1% for AGIs $25k-50k, 72.1% for AGIs $50k-75k, 132.2% for AGIs $75k-100k, 428.9% for AGIs $100k-200k, 1854.9% for AGIs over 200k)
Taxes paid: $9,518 (reported on 38.9% of returns)
22205:
$9,518
State:
$8,284
(% of AGI for various income ranges: 32.9% for AGIs below $25k, 70.6% for AGIs $25k-50k, 201.5% for AGIs $50k-75k, 371.9% for AGIs $75k-100k, 811.4% for AGIs $100k-200k, 2140.9% for AGIs over 200k)
Earned income credit: $1,788 (reported on 3.9% of returns)
Here:
$1,788
State:
$2,214
(% of AGI for various income ranges: 45.9% for AGIs below $25k, 30.8% for AGIs $25k-50k)
Percentage of individuals using paid preparers for their 2020 taxes: 89.8%
Here:
90%
State:
92%
(% for various income ranges: 85.4% for AGIs below $25k, 89.5% for AGIs $25k-50k, 90.5% for AGIs $50k-75k, 88.3% for AGIs $75k-100k, 88.4% for AGIs $100k-200k, 93.1% for AGIs over 200k)
Averages for the 2012 tax year for zip code 22205, filed in 2013:
Average Adjusted Gross Income (AGI) in 2012: $129,256 (Individual Income Tax Returns)
Here:
$129,256
State:
$71,192
Salary/wage: $114,767 (reported on 83.8% of returns)
Here:
$114,767
State:
$59,229
(% of AGI for various income ranges: 75.0% for AGIs below $25k, 80.5% for AGIs $25k-50k, 74.4% for AGIs $50k-75k, 68.6% for AGIs $75k-100k, 76.9% for AGIs $100k-200k, 73.3% for AGIs over 200k)
Taxable interest for individuals: $1,769 (reported on 59.8% of returns)
This zip code:
$1,769
Virginia:
$1,600
(% of AGI for various income ranges: 1.8% for AGIs below $25k, 1.0% for AGIs $25k-50k, 1.0% for AGIs $50k-75k, 1.3% for AGIs $75k-100k, 0.8% for AGIs $100k-200k, 0.7% for AGIs over 200k)
Ordinary dividends: $6,127 (reported on 47.6% of returns)
Here:
$6,127
State:
$6,959
(% of AGI for various income ranges: 3.9% for AGIs below $25k, 1.6% for AGIs $25k-50k, 2.1% for AGIs $50k-75k, 2.9% for AGIs $75k-100k, 2.4% for AGIs $100k-200k, 2.2% for AGIs over 200k)
Net capital gain/loss in AGI: +$8,003 (reported on 38.1% of returns)
Here:
+$8,003
State:
+$16,672
(% of AGI for various income ranges: 0.8% for AGIs below $25k, 0.5% for AGIs $25k-50k, 0.6% for AGIs $50k-75k, 0.8% for AGIs $75k-100k, 1.1% for AGIs $100k-200k, 3.5% for AGIs over 200k)
Profit/loss from business: +$24,793 (reported on 17.7% of returns)
Here:
+$24,793
State:
+$14,116
(% of AGI for various income ranges: 11.9% for AGIs below $25k, 4.8% for AGIs $25k-50k, 3.7% for AGIs $50k-75k, 3.9% for AGIs $75k-100k, 3.2% for AGIs $100k-200k, 3.1% for AGIs over 200k)
Taxable individual retirement arrangement distribution: $17,076 (reported on 11.2% of returns)
22205:
$17,076
Virginia:
$16,667
(% of AGI for various income ranges: 2.0% for AGIs below $25k, 1.7% for AGIs $25k-50k, 1.7% for AGIs $50k-75k, 2.1% for AGIs $75k-100k, 1.9% for AGIs $100k-200k, 1.2% for AGIs over 200k)
Self-employment retirement plans: $24,607 (reported on 3.5% of returns)
22205:
$24,607
Virginia:
$25,373
(% of AGI for various income ranges: 1.0% for AGIs below $25k, 0.4% for AGIs $75k-100k, 0.3% for AGIs $100k-200k, 1.0% for AGIs over 200k)
Total itemized deductions: $36,106 (19% of AGI, reported on 58.4% of returns)
Here:
$36,106
State:
$26,596
Here:
18.6% of AGI
State:
20.1% of AGI
(% of AGI for various income ranges: 15.8% for AGIs below $25k, 12.9% for AGIs $25k-50k, 15.4% for AGIs $50k-75k, 19.6% for AGIs $75k-100k, 19.6% for AGIs $100k-200k, 14.8% for AGIs over 200k)
Charity contributions: $4,239 (reported on 51.3% of returns)
Here:
$4,239
State:
$4,443
(% of AGI for various income ranges: 0.5% for AGIs below $25k, 0.9% for AGIs $25k-50k, 1.4% for AGIs $50k-75k, 1.8% for AGIs $75k-100k, 2.0% for AGIs $100k-200k, 1.6% for AGIs over 200k)
Taxes paid: $16,127 (reported on 58.2% of returns)
22205:
$16,127
State:
$9,951
(% of AGI for various income ranges: 3.2% for AGIs below $25k, 3.0% for AGIs $25k-50k, 4.5% for AGIs $50k-75k, 7.2% for AGIs $75k-100k, 8.3% for AGIs $100k-200k, 7.5% for AGIs over 200k)
Earned income credit: $1,722 (reported on 4.6% of returns)
Here:
$1,722
State:
$2,211
(% of AGI for various income ranges: 2.8% for AGIs below $25k, 0.3% for AGIs $25k-50k)
Percentage of individuals using paid preparers for their 2012 taxes: 42.3%
Here:
42%
State:
46%
(% for various income ranges: 38.3% for AGIs below $25k, 39.4% for AGIs $25k-50k, 39.0% for AGIs $50k-75k, 42.5% for AGIs $75k-100k, 42.0% for AGIs $100k-200k, 50.3% for AGIs over 200k)
Averages for the 2004 tax year for zip code 22205, filed in 2005:
Average Adjusted Gross Income (AGI) in 2004: $94,585 (Individual Income Tax Returns)
Here:
$94,585
State:
$56,704
Salary/wage: $82,179 (reported on 83.6% of returns)
Here:
$82,179
State:
$48,441
(% of AGI for various income ranges: 94.2% for AGIs below $10k, 73.1% for AGIs $10k-25k, 77.4% for AGIs $25k-50k, 72.5% for AGIs $50k-75k, 77.7% for AGIs $75k-100k, 71.3% for AGIs over 100k)
Taxable interest for individuals: $2,010 (reported on 66.6% of returns)
This zip code:
$2,010
Virginia:
$1,688
(% of AGI for various income ranges: 5.8% for AGIs below $10k, 2.6% for AGIs $10k-25k, 1.6% for AGIs $25k-50k, 2.2% for AGIs $50k-75k, 1.6% for AGIs $75k-100k, 1.2% for AGIs over 100k)
Taxable dividends: $3,509 (reported on 50.2% of returns)
Here:
$3,509
State:
$4,028
(% of AGI for various income ranges: 8.3% for AGIs below $10k, 3.3% for AGIs $10k-25k, 1.8% for AGIs $25k-50k, 2.4% for AGIs $50k-75k, 1.8% for AGIs $75k-100k, 1.7% for AGIs over 100k)
Net capital gain/loss: +$12,788 (reported on 40.8% of returns)
Here:
+$12,788
State:
+$14,375
(% of AGI for various income ranges: -2.8% for AGIs below $10k, 1.3% for AGIs $10k-25k, 0.5% for AGIs $25k-50k, 0.6% for AGIs $50k-75k, 1.1% for AGIs $75k-100k, 7.4% for AGIs over 100k)
Profit/loss from business: +$22,573 (reported on 16.9% of returns)
Here:
+$22,573
State:
+$13,342
(% of AGI for various income ranges: 5.0% for AGIs below $10k, 8.3% for AGIs $10k-25k, 3.8% for AGIs $25k-50k, 3.3% for AGIs $50k-75k, 3.7% for AGIs $75k-100k, 4.1% for AGIs over 100k)
Profit/loss from farming: +$824 (reported on 0.2% of returns)
Here:
+$824
State:
-$5,267
IRA payment deduction: $3,049 (reported on 3.6% of returns)
22205:
$3,049
Virginia:
$2,943
(% of AGI for various income ranges: 1.1% for AGIs below $10k, 0.3% for AGIs $10k-25k, 0.3% for AGIs $25k-50k, 0.2% for AGIs $50k-75k, 0.1% for AGIs $75k-100k, 0.1% for AGIs over 100k)
Self-employed pension: $16,615 (reported on 3.8% of returns)
Here:
$16,615
Virginia:
$17,430
(% of AGI for various income ranges: 0.2% for AGIs $25k-50k, 0.2% for AGIs $50k-75k, 0.4% for AGIs $75k-100k, 0.8% for AGIs over 100k)
Total itemized deductions: $26,438 (18% of AGI, reported on 56.0% of returns)
Here:
$26,438
State:
$21,492
Here:
18.4% of AGI
State:
21.0% of AGI
(% of AGI for various income ranges: 19.3% for AGIs below $10k, 16.2% for AGIs $10k-25k, 12.7% for AGIs $25k-50k, 16.4% for AGIs $50k-75k, 20.4% for AGIs $75k-100k, 15.2% for AGIs over 100k)
Charity contributions deductions: $3,425 (2% of AGI, reported on 51.5% of returns)
Here:
$3,425
State:
$3,794
Here:
2.3% of AGI
State:
3.5% of AGI
(% of AGI for various income ranges: 0.6% for AGIs below $10k, 1.0% for AGIs $10k-25k, 1.3% for AGIs $25k-50k, 2.0% for AGIs $50k-75k, 2.3% for AGIs $75k-100k, 1.9% for AGIs over 100k)
Total tax: $17,783 (reported on 89.2% of returns)
22205:
$17,783
State:
$9,537
(% of AGI for various income ranges: 4.2% for AGIs below $10k, 5.5% for AGIs $10k-25k, 9.5% for AGIs $25k-50k, 11.7% for AGIs $50k-75k, 12.1% for AGIs $75k-100k, 19.2% for AGIs over 100k)
Earned income credit: $1,326 (reported on 3.7% of returns)
Here:
$1,326
State:
$1,734
Percentage of individuals using paid preparers for their 2004 taxes: 40.8%
Here:
41%
State:
52%
(% for various income ranges: 37.4% for AGIs below $10k, 42.9% for AGIs $10k-25k, 39.8% for AGIs $25k-50k, 40.6% for AGIs $50k-75k, 40.1% for AGIs $75k-100k, 42.2% for AGIs over 100k)
Likely homosexual households (counted as self-reported same-sex unmarried-partner households)
Lesbian couples: 0.1% of all households
Gay men: 0.4% of all households
Household received Food Stamps/SNAP in the past 12 months: 177 Household did not receive Food Stamps/SNAP in the past 12 months: 6,724
Women who had a birth in the past 12 months: 327 (332 now married, 3 unmarried) Women who did not have a birth in the past 12 months: 3,682 (2,104 now married, 1,557 unmarried)
Housing units in zip code 22205 with a mortgage: 3,918 (563 second mortgage, 27 home equity loan, 502 both second mortgage and home equity loan) Houses without a mortgage: 54
Median monthly owner costs for units with a mortgage: $3,731 Median monthly owner costs for units without a mortgage: $1,105
Residents with income below the poverty level in 2022:
This zip code:
3.2%
Whole state:
10.6%
Residents with income below 50% of the poverty level in 2022:
This zip code:
1.3%
Whole state:
5.2%
Median number of rooms in houses and condos:
Here:
8.1
State:
7.0
Median number of rooms in apartments:
Here:
3.9
State:
4.3
Notable locations in this zip code not listed on our city pages
Notable locations in zip code 22205: East Falls Church Metro Station (A), Westover Library (B), County Health Center (C). Display/hide their locations on the map
Churches in zip code 22205 include: Bahai World of Faith Church (A), Arlington Metaphys Chapel (B), Bon Air Baptist Church (C), Christian Science Church (D), Christ United Methodist Church (E), The Church of Jesus Christ of Latter Day Saints (F), Resurrection Lutheran Church (G), Saint Anns Catholic Church (H), Saint Michaels Church (I). Display/hide their locations on the map
Parks in zip code 22205 include: Highland Park (1), Madison Manor Park (2), Falls Church Park (3), Upton Hill Regional Park (4), Lacey Woods Park (5), Bon Air Park (6). Display/hide their locations on the map
4,320 married couples with children.
331 single-parent households (57 men, 274 women).
78.3% of residents of 22205 zip code speak English at home.
11.2% of residents speak Spanish at home (77% very well, 7% well, 15% not well, 1% not at all).
6.7% of residents speak other Indo-European language at home (70% very well, 24% well, 6% not well).
3.1% of residents speak Asian or Pacific Island language at home (83% very well, 11% well, 6% not well).
0.9% of residents speak other language at home (87% very well, 7% well, 6% not well).
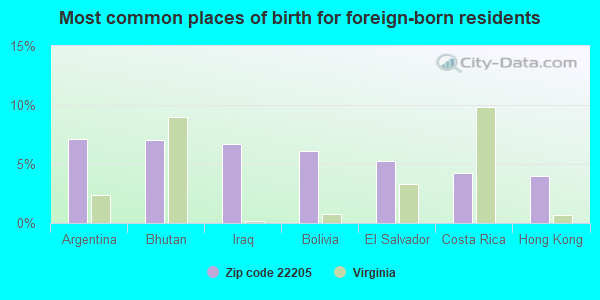
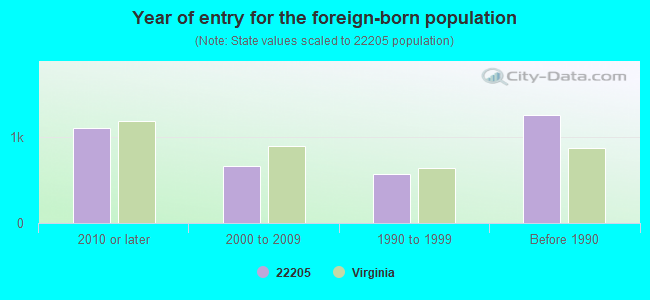
Foreign born population: 3,059 (16.4%) (62.6% of them are naturalized citizens)
Facilities with environmental interests located in this zip code:
ARL PARISH CHILD CARE CTR (6201 N WASHINGTON BLVD in ARLINGTON, VA)
(Integrated Compliance Information System) - ICIS-03-1989-0210, FORMAL ENFORCEMENT ACTION COMPLIANCE ACTIVITY (Tracking inspections of insecticide, fungicide, and rodenticide, and toxic substances)
CHESAPEAKE & POTOMAC TELEPHONE CO (6700 LEE HIGHWAY in ARLINGTON, VA)
(Resource Conservation and Recovery Act (tracking hazardous waste)) Organizations: OPERNAME (CONTACT/OPERATOR)
, CHESAPEAKE & POTOMAC TELEPHONE COMPANY (CONTACT/OWNER)
CLEAN ALL (5150 WILSON BLVD in ARLINGTON, VA)
(Resource Conservation and Recovery Act (tracking hazardous waste)) Organizations: RAJ PAUL WAHI & NEENA WAHI (CONTACT/OWNER)
Housing units lacking complete plumbing facilities: 0.3% Housing units lacking complete kitchen facilities: 0.5%
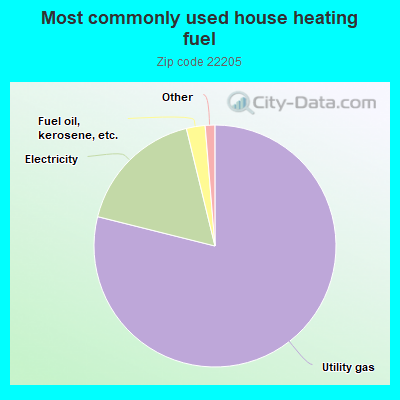
78.9%Utility gas
17.3%Electricity
2.5%Fuel oil, kerosene, etc.
Population in 1990: 15,285. Population change in the 1990s: +579 (+3.8%).
Place of birth for U.S.-born residents:
This state: 4,943
Northeast: 3,090
Midwest: 1,690
South: 3,960
West: 1,469
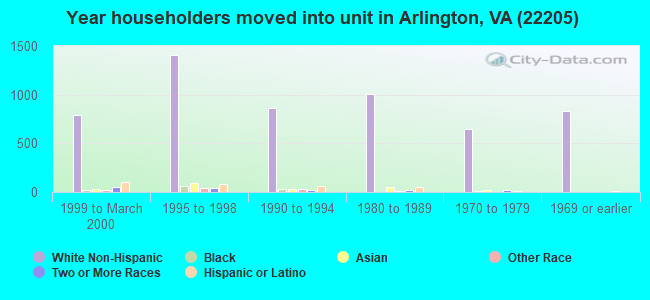
58% of the 22205 zip code residents lived in the same house 5 years ago. Out of people who lived in different houses, 40% lived in this county. Out of people who lived in different counties, 50% lived in Virginia.
92% of the 22205 zip code residents lived in the same house 1 year ago. Out of people who lived in different houses, 31% moved from this county. Out of people who lived in different houses, 19% moved from different county within same state. Out of people who lived in different houses, 40% moved from different state. Out of people who lived in different houses, 14% moved from abroad.
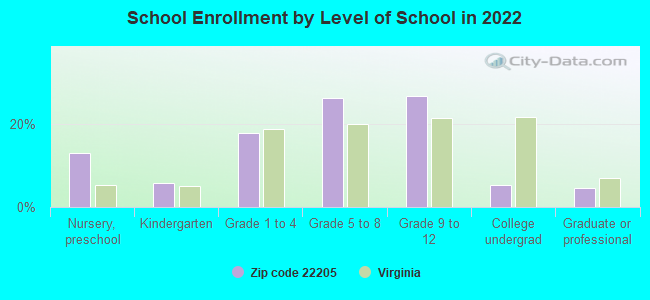
Private vs. public school enrollment:
Students in private schools in grades 1 to 8 (elementary and middle school): 170
Here:
8.5%
Virginia:
13.2%
Students in private schools in grades 9 to 12 (high school): 72
Here:
5.9%
Virginia:
10.2%
Students in private undergraduate colleges: 72
Here:
30.6%
Virginia:
18.7%
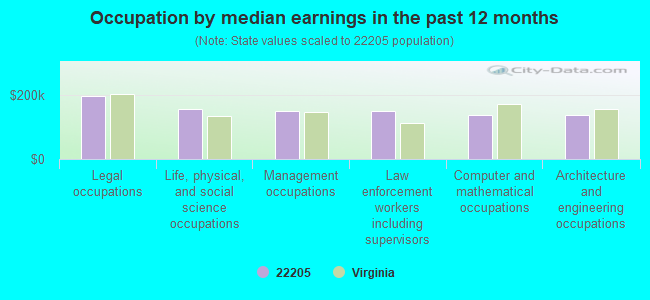
Occupation by median earnings in the past 12 months ($)
195,944Legal occupations
157,117Life, physical, and social science occupations
148,306Management occupations
148,249Law enforcement workers including supervisors
137,212Computer and mathematical occupations
137,151Architecture and engineering occupations
Companies with biggest federal contracts located in this zip code:
BETIS GROUP, INC (6711 LEE HWY UPPR M2 in ARLINGTON, VA; small business) : $14,366,414 in 224 contractsfrom 2000 to 2006
Contracts for ADP Support Equipment, ADP Systems Analysis Services, ADP Components, Miscellaneous Items, and moreby Federal Technology Service, Office of the Secretary, Department of Homeland Security, Air Force, Army, and others Signed by year:2000: $148,027; 2001: $31,293; 2002: $603,973; 2003: $3,974,608; 2004: $3,707,776; 2005: $4,657,899; 2006: $1,242,838.
Biggest contracts:
$2,199,987 with Federal Technology Service for ADP Support Equipment. Taking place in TX. Signed on 2003-02-15. Completion date: 2003-03-15.
$1,925,000 with Office of the Secretary, Department of Homeland Security for ADP Systems Analysis Services. Taking place in DC. Signed on 2004-08-02. Completion date: 2004-08-02.
$1,121,589 with Air Force for ADP Components. Signed on 2005-09-23. Completion date: 2005-12-30.
$842,796 with Air Force for Miscellaneous Items. Signed on 2005-05-26. Completion date: 2005-06-27.
WRIGHT jAMES (2204 N TUCKAHOE STREET in ARLINGTON, VA) : $594,583 in 17 contractsfrom 2000 to 2006
Contracts for Personal Services Contracts by Departmental Offices Signed by year:2000: $37,000; 2001: $21,000; 2002: $113,000; 2003: $154,387; 2004: $170,788; 2005: $32,174; 2006: $66,234.
Biggest contracts:
$170,788 with Departmental Offices for Personal Services Contracts. Taking place in DC. Signed on 2004-03-15. Effective on 2004-03-20. Completion date: 2005-03-19.
$154,387, same as above.Signed on 2003-03-15. Completion date: 2004-03-15.
$60,000, same as above.Signed on 2002-03-15. Completion date: 2003-03-15.
$45,000, same as above.Signed on 2002-09-15. Completion date: 2003-03-15.
SANTILLAN IRIBE MARCO ANTONIO (0000) (ACANTILADO NO. 2268 in TIJUANA, In; small business) 3 employees, $86000 revenue: $252,000 in 2 contractsin 2005
$226,800 with Animal and Plant Health Inspection Service for Other Professional Services. Taking place in CA. Signed on 2005-05-02. Completion date: 2006-03-31.
$25,200, same as above.Signed on 2005-05-02. Completion date: 2006-03-31.
CTC ASSOCIATES, INC. (2014 N. ROOSEVELT ST. in ARLINGTON, VA; small business) : $188,960 in 7 contractsfrom 1999 to 2000
Contracts for Programming Services by Department of Defense Signed by year:2000: -$3,852; 2001: $0; 2002: $0; 2003: $0; 2004: $0; 2005: $0; 2006: $0.
Biggest contracts:
$128,020 with Department of Defense for Programming Services. Signed on 1999-12-09. Completion date: 1999-12-31.
$64,792, same as above.Signed on 1999-12-20. Completion date: 2000-01-31.
$43,148, same as above.Signed on 2000-06-15. Completion date: 2001-05-31.
$40,000, same as above.Signed on 2000-09-07. Completion date: 2000-09-30.
BOWEN STEVEN R ( in Arlington, VA; small business) : $141,377 in 4 contractsfrom 2005 to 2006
$105,213 with Departmental Offices for Personal Services Contracts. Taking place in DC. Signed on 2006-05-26. Completion date: 2010-11-30.
$30,402, same as above.Signed on 2005-12-01. Completion date: 2010-11-30.
$5,762, same as above.Signed on 2006-06-20. Completion date: 2010-11-30.
$0, same as above.Signed on 2006-03-21. Completion date: 2010-11-30.
GLOBAL COM INC (6711 LEE HWY STE M3 in ARLINGTON, VA; small business)
$39,516 with Navy for Maintenance, Repair and Rebuilding of Equipment -- Communication, Detection, and Coherent Radiation Equipment. Signed on 2004-12-27. Completion date: 2005-01-31.
IVAN OELRICH (5900 19TH ST N in ARLINGTON, VA; small business) : $22,488 in 2 contractsin 2003
$38,350 with Army for Policy Review/Development Services. Taking place in PA. Signed on 2003-03-25. Completion date: 2003-05-05.
-$15,862, same as above.Signed on 2003-09-25. Completion date: 2003-05-05.
W. D. DOOR SERVICE, INC. (820 N. FLORIDA STREET in ARLINGTON, VA; small business)
$19,587 with Department of Defense for Maintenance, Repair or Alteration of Real Property -- Office Buildings. Signed on 2000-04-04. Completion date: 2000-06-30.
KEISWETTER,ALLEN L (1011 N ROOSEVELT ST in ARLINGTON, VA; small business)
$9,999 with Army for Educational Services. Signed on 2004-11-12. Completion date: 2005-06-30.
ROSENTHAL-LARREA, GILKA, OWNER (5015 WASHINGTON BLVD in ARLINGTON, VA; small business) : $7,700 in 2 contractsfrom 2004 to 2005
$5,000 with Army for Translation and Interpreting Services(Including Sign Language). Signed on 2005-11-23. Completion date: 2005-12-02.
$2,700, same as above.Signed on 2004-11-08. Completion date: 2004-11-12.
Top industries in this zip code by the number of employees in 2005:
Health Care and Social Assistance: General Medical and Surgical Hospitals (over 1000 employees: 1 establishment)
Health Care and Social Assistance: Offices of Physicians (except Mental Health Specialists) (20-49: 5, 10-19: 12, 5-9: 17, 1-4: 31)
Professional, Scientific, and Technical Services: Computer Systems Design Services (100-249: 1, 10-19: 2, 5-9: 3, 1-4: 3)
Management of Companies and Enterprises: Corporate, Subsidiary, and Regional Managing Offices (100-249: 1)
Health Care and Social Assistance: Homes for the Elderly (100-249: 1)
2005 - 2018 National Fire Incident Reporting System (NFIRS) incidents
Based on the data from the years 2005 - 2018 the average number of fires per year is 22. The highest number of fires - 35 took place in 2007, and the least - 12 in 2017. The data has a decreasing trend.
When looking into fire subcategories, the most reports belonged to: Structure Fires (56.9%), and Outside Fires (31.6%).
Fire incident types reported to NFIRS in Zip Code 22205


+$824
-$5,267
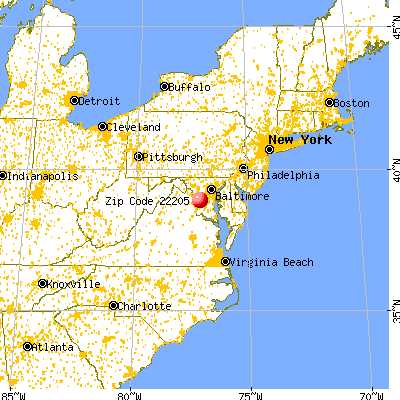
 Nearest zip codes: 22203, 22213, 22044, 22207, 22041, 22046.


 Based on the data from the years 2005 - 2018 the average number of fires per year is 22. The highest number of fires - 35 took place in 2007, and the least - 12 in 2017. The data has a decreasing trend.
 When looking into fire subcategories, the most reports belonged to: Structure Fires (56.9%), and Outside Fires (31.6%).