Estimated zip code population in 2022: 20,416 Zip code population in 2010: 20,711 Zip code population in 2000: 21,704
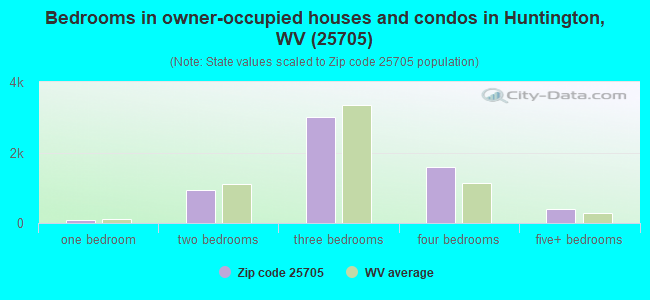
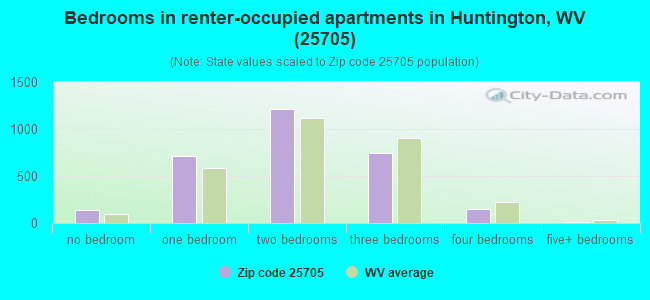
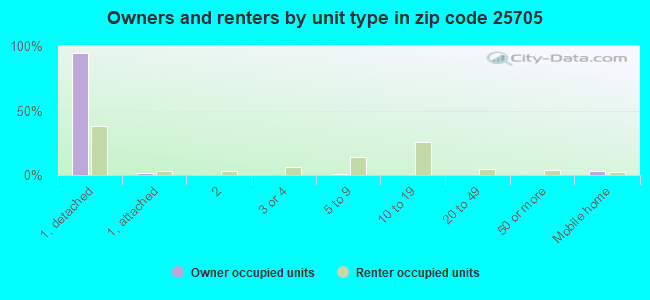
Houses and condos: 9,798 Renter-occupied apartments: 2,997
% of renters here:
33%
State:
26%
March 2022 cost of living index in zip code 25705: 83.5 (less than average, U.S. average is 100)
Land area: 12.0 sq. mi. Water area: 0.2 sq. mi.
Population density: 1,706 people per square mile
(low).
OSM Map
General Map
Google Map
MSN Map
OSM Map
General Map
Google Map
MSN Map
OSM Map
General Map
Google Map
MSN Map
OSM Map
General Map
Google Map
MSN Map
Please wait while loading the map...
Real estate property taxes paid for housing units in 2022:
This zip code:
0.7% ($1,072)
West Virginia:
0.5% ($821)
Median real estate property taxes paid for housing units with mortgages in 2022: $1,228 (0.7%) Median real estate property taxes paid for housing units with no mortgage in 2022: $815 (0.6%)
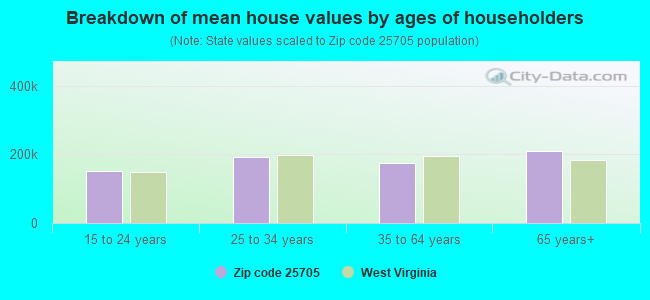
Estimated median house/condo value in 2022: $162,440
25705:
$162,440
West Virginia:
$155,100
According to our research of West Virginia and other state lists, there were 46 registered sex offenders living in 25705 zip code as of April 27, 2024. The ratio of all residents to sex offenders in zip code 25705 is 474 to 1. The ratio of registered sex offenders to all residents in this zip code is lower than the state average.
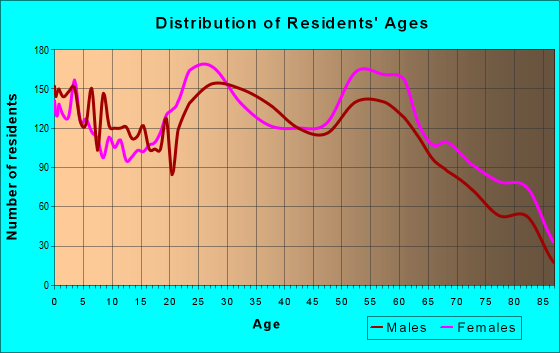
Median resident age:
This zip code:
38.2 years
West Virginia median age:
42.9 years
Average household size:
This zip code:
2.3 people
West Virginia:
2.3 people
Averages for the 2020 tax year for zip code 25705, filed in 2021:
Average Adjusted Gross Income (AGI) in 2020: $61,413 (Individual Income Tax Returns)
Here:
$61,413
State:
$56,292
Salary/wage: $53,799 (reported on 80.5% of returns)
Here:
$53,799
State:
$49,093
(% of AGI for various income ranges: 1065.0% for AGIs below $25k, 3409.5% for AGIs $25k-50k, 6290.4% for AGIs $50k-75k, 8701.8% for AGIs $75k-100k, 16022.1% for AGIs $100k-200k, 78765.8% for AGIs over 200k)
Taxable interest for individuals: $1,650 (reported on 26.7% of returns)
This zip code:
$1,650
West Virginia:
$1,141
(% of AGI for various income ranges: 15.2% for AGIs below $25k, 29.5% for AGIs $25k-50k, 28.8% for AGIs $50k-75k, 85.5% for AGIs $75k-100k, 133.9% for AGIs $100k-200k, 1240.8% for AGIs over 200k)
Ordinary dividends: $6,489 (reported on 16.4% of returns)
Here:
$6,489
State:
$5,456
(% of AGI for various income ranges: 19.2% for AGIs below $25k, 34.0% for AGIs $25k-50k, 70.0% for AGIs $50k-75k, 139.1% for AGIs $75k-100k, 353.9% for AGIs $100k-200k, 4100.0% for AGIs over 200k)
Net capital gain/loss in AGI: +$12,734 (reported on 14.4% of returns)
Here:
+$12,734
State:
+$11,656
(% of AGI for various income ranges: 3.9% for AGIs below $25k, 22.2% for AGIs $25k-50k, 82.0% for AGIs $50k-75k, 146.6% for AGIs $75k-100k, 393.1% for AGIs $100k-200k, 10269.2% for AGIs over 200k)
Profit/loss from business: +$15,949 (reported on 11.3% of returns)
Here:
+$15,949
State:
+$12,084
(% of AGI for various income ranges: 83.0% for AGIs below $25k, 82.4% for AGIs $25k-50k, 120.8% for AGIs $50k-75k, 229.8% for AGIs $75k-100k, 440.7% for AGIs $100k-200k, 6391.7% for AGIs over 200k)
Taxable individual retirement arrangement distribution: $15,134 (reported on 8.9% of returns)
25705:
$15,134
West Virginia:
$15,311
(% of AGI for various income ranges: 49.3% for AGIs below $25k, 79.0% for AGIs $25k-50k, 149.9% for AGIs $50k-75k, 267.9% for AGIs $75k-100k, 695.7% for AGIs $100k-200k, 1856.7% for AGIs over 200k)
Self-employed (Keogh) retirement plans: $37,375 (reported on 0.4% of returns)
25705:
$37,375
West Virginia:
$27,405
(% of AGI for various income ranges: 1245.8% for AGIs over 200k)
Total itemized deductions: $33,843 (reported on 4.5% of returns)
Here:
$33,843
State:
$31,950
(% of AGI for various income ranges: 76.8% for AGIs $25k-50k, 92.4% for AGIs $50k-75k, 246.6% for AGIs $75k-100k, 496.3% for AGIs $100k-200k, 5974.2% for AGIs over 200k)
Charity contributions: $13,515 (reported on 3.6% of returns)
Here:
$13,515
State:
$12,364
(% of AGI for various income ranges: 12.3% for AGIs $25k-50k, 19.5% for AGIs $50k-75k, 60.2% for AGIs $75k-100k, 164.0% for AGIs $100k-200k, 2171.7% for AGIs over 200k)
Taxes paid: $7,571 (reported on 4.5% of returns)
25705:
$7,571
State:
$7,665
(% of AGI for various income ranges: 9.7% for AGIs $25k-50k, 23.0% for AGIs $50k-75k, 65.9% for AGIs $75k-100k, 157.9% for AGIs $100k-200k, 1127.5% for AGIs over 200k)
Earned income credit: $2,248 (reported on 18.0% of returns)
Here:
$2,248
State:
$2,258
(% of AGI for various income ranges: 99.4% for AGIs below $25k, 62.4% for AGIs $25k-50k)
Percentage of individuals using paid preparers for their 2020 taxes: 93.5%
Here:
94%
State:
93%
(% for various income ranges: 93.8% for AGIs below $25k, 94.2% for AGIs $25k-50k, 93.7% for AGIs $50k-75k, 92.4% for AGIs $75k-100k, 92.8% for AGIs $100k-200k, 91.2% for AGIs over 200k)
Averages for the 2012 tax year for zip code 25705, filed in 2013:
Average Adjusted Gross Income (AGI) in 2012: $57,039 (Individual Income Tax Returns)
Here:
$57,039
State:
$48,628
Salary/wage: $47,963 (reported on 82.2% of returns)
Here:
$47,963
State:
$42,328
(% of AGI for various income ranges: 73.4% for AGIs below $25k, 76.8% for AGIs $25k-50k, 76.6% for AGIs $50k-75k, 73.8% for AGIs $75k-100k, 73.4% for AGIs $100k-200k, 54.0% for AGIs over 200k)
Taxable interest for individuals: $1,986 (reported on 32.0% of returns)
This zip code:
$1,986
West Virginia:
$1,211
(% of AGI for various income ranges: 1.4% for AGIs below $25k, 0.9% for AGIs $25k-50k, 0.8% for AGIs $50k-75k, 1.1% for AGIs $75k-100k, 1.0% for AGIs $100k-200k, 1.4% for AGIs over 200k)
Ordinary dividends: $5,298 (reported on 19.4% of returns)
Here:
$5,298
State:
$4,262
(% of AGI for various income ranges: 1.7% for AGIs below $25k, 1.2% for AGIs $25k-50k, 1.2% for AGIs $50k-75k, 1.2% for AGIs $75k-100k, 1.9% for AGIs $100k-200k, 2.7% for AGIs over 200k)
Net capital gain/loss in AGI: +$19,741 (reported on 13.5% of returns)
Here:
+$19,741
State:
+$8,875
(% of AGI for various income ranges: 0.3% for AGIs $25k-50k, 0.1% for AGIs $50k-75k, 0.8% for AGIs $75k-100k, 0.7% for AGIs $100k-200k, 15.8% for AGIs over 200k)
Profit/loss from business: +$17,777 (reported on 11.8% of returns)
Here:
+$17,777
State:
+$13,636
(% of AGI for various income ranges: 5.2% for AGIs below $25k, 2.3% for AGIs $25k-50k, 2.1% for AGIs $50k-75k, 1.9% for AGIs $75k-100k, 3.6% for AGIs $100k-200k, 5.6% for AGIs over 200k)
Taxable individual retirement arrangement distribution: $11,822 (reported on 11.0% of returns)
25705:
$11,822
West Virginia:
$11,787
(% of AGI for various income ranges: 3.1% for AGIs below $25k, 2.6% for AGIs $25k-50k, 2.0% for AGIs $50k-75k, 2.4% for AGIs $75k-100k, 3.3% for AGIs $100k-200k, 1.2% for AGIs over 200k)
Self-employment retirement plans: $21,700 (reported on 0.7% of returns)
25705:
$21,700
West Virginia:
$24,483
(% of AGI for various income ranges: 0.4% for AGIs $100k-200k, 0.6% for AGIs over 200k)
Total itemized deductions: $22,622 (16% of AGI, reported on 22.9% of returns)
Here:
$22,622
State:
$21,148
Here:
16.1% of AGI
State:
18.1% of AGI
(% of AGI for various income ranges: 4.1% for AGIs below $25k, 5.6% for AGIs $25k-50k, 7.0% for AGIs $50k-75k, 9.2% for AGIs $75k-100k, 11.8% for AGIs $100k-200k, 11.4% for AGIs over 200k)
Charity contributions: $6,073 (reported on 18.0% of returns)
Here:
$6,073
State:
$4,508
(% of AGI for various income ranges: 0.5% for AGIs below $25k, 0.9% for AGIs $25k-50k, 1.3% for AGIs $50k-75k, 1.8% for AGIs $75k-100k, 2.5% for AGIs $100k-200k, 2.8% for AGIs over 200k)
Taxes paid: $9,721 (reported on 22.7% of returns)
25705:
$9,721
State:
$8,103
(% of AGI for various income ranges: 0.7% for AGIs below $25k, 1.3% for AGIs $25k-50k, 2.1% for AGIs $50k-75k, 3.1% for AGIs $75k-100k, 5.3% for AGIs $100k-200k, 6.4% for AGIs over 200k)
Earned income credit: $2,062 (reported on 19.0% of returns)
Here:
$2,062
State:
$2,140
(% of AGI for various income ranges: 6.5% for AGIs below $25k, 0.8% for AGIs $25k-50k)
Percentage of individuals using paid preparers for their 2012 taxes: 49.8%
Here:
50%
State:
49%
(% for various income ranges: 46.4% for AGIs below $25k, 47.2% for AGIs $25k-50k, 50.8% for AGIs $50k-75k, 56.0% for AGIs $75k-100k, 54.7% for AGIs $100k-200k, 80.0% for AGIs over 200k)
Averages for the 2004 tax year for zip code 25705, filed in 2005:
Average Adjusted Gross Income (AGI) in 2004: $45,175 (Individual Income Tax Returns)
Here:
$45,175
State:
$37,498
Salary/wage: $40,081 (reported on 82.0% of returns)
Here:
$40,081
State:
$33,645
(% of AGI for various income ranges: 104.6% for AGIs below $10k, 70.4% for AGIs $10k-25k, 76.3% for AGIs $25k-50k, 77.4% for AGIs $50k-75k, 78.2% for AGIs $75k-100k, 65.9% for AGIs over 100k)
Taxable interest for individuals: $1,977 (reported on 46.7% of returns)
This zip code:
$1,977
West Virginia:
$1,465
(% of AGI for various income ranges: 5.1% for AGIs below $10k, 3.4% for AGIs $10k-25k, 2.2% for AGIs $25k-50k, 1.7% for AGIs $50k-75k, 1.9% for AGIs $75k-100k, 1.7% for AGIs over 100k)
Taxable dividends: $3,073 (reported on 23.7% of returns)
Here:
$3,073
State:
$2,913
(% of AGI for various income ranges: 4.0% for AGIs below $10k, 1.7% for AGIs $10k-25k, 1.1% for AGIs $25k-50k, 1.0% for AGIs $50k-75k, 1.0% for AGIs $75k-100k, 2.2% for AGIs over 100k)
Net capital gain/loss: +$6,107 (reported on 18.0% of returns)
Here:
+$6,107
State:
+$6,331
(% of AGI for various income ranges: -1.2% for AGIs below $10k, 0.1% for AGIs $10k-25k, 0.3% for AGIs $25k-50k, 0.8% for AGIs $50k-75k, 0.7% for AGIs $75k-100k, 5.6% for AGIs over 100k)
Profit/loss from business: +$14,730 (reported on 12.4% of returns)
Here:
+$14,730
State:
+$11,074
(% of AGI for various income ranges: 3.1% for AGIs below $10k, 3.5% for AGIs $10k-25k, 1.9% for AGIs $25k-50k, 2.0% for AGIs $50k-75k, 3.8% for AGIs $75k-100k, 6.3% for AGIs over 100k)
IRA payment deduction: $2,978 (reported on 2.5% of returns)
25705:
$2,978
West Virginia:
$2,796
(% of AGI for various income ranges: 0.2% for AGIs $10k-25k, 0.2% for AGIs $25k-50k, 0.2% for AGIs $50k-75k, 0.2% for AGIs $75k-100k, 0.1% for AGIs over 100k)
Self-employed pension: $15,417 (reported on 1.1% of returns)
Here:
$15,417
West Virginia:
$18,181
Total itemized deductions: $18,043 (17% of AGI, reported on 23.9% of returns)
Here:
$18,043
State:
$16,976
Here:
17.0% of AGI
State:
19.0% of AGI
(% of AGI for various income ranges: 4.2% for AGIs below $10k, 4.7% for AGIs $10k-25k, 7.1% for AGIs $25k-50k, 8.7% for AGIs $50k-75k, 11.8% for AGIs $75k-100k, 11.8% for AGIs over 100k)
Charity contributions deductions: $4,429 (4% of AGI, reported on 20.4% of returns)
Here:
$4,429
State:
$3,529
Here:
3.9% of AGI
State:
3.7% of AGI
(% of AGI for various income ranges: 0.3% for AGIs below $10k, 0.7% for AGIs $10k-25k, 1.2% for AGIs $25k-50k, 1.8% for AGIs $50k-75k, 2.3% for AGIs $75k-100k, 2.8% for AGIs over 100k)
Total tax: $7,932 (reported on 73.5% of returns)
25705:
$7,932
State:
$5,372
(% of AGI for various income ranges: 1.8% for AGIs below $10k, 3.7% for AGIs $10k-25k, 7.2% for AGIs $25k-50k, 9.7% for AGIs $50k-75k, 11.4% for AGIs $75k-100k, 20.6% for AGIs over 100k)
Earned income credit: $1,607 (reported on 16.5% of returns)
Here:
$1,607
State:
$1,662
Percentage of individuals using paid preparers for their 2004 taxes: 52.8%
Here:
53%
State:
55%
(% for various income ranges: 47.2% for AGIs below $10k, 54.2% for AGIs $10k-25k, 51.8% for AGIs $25k-50k, 53.1% for AGIs $50k-75k, 51.0% for AGIs $75k-100k, 68.2% for AGIs over 100k)
Likely homosexual households (counted as self-reported same-sex unmarried-partner households)
Lesbian couples: 0.1% of all households
Gay men: 0.6% of all households
Household received Food Stamps/SNAP in the past 12 months: 1,109 Household did not receive Food Stamps/SNAP in the past 12 months: 7,870
Women who had a birth in the past 12 months: 245 (145 now married, 99 unmarried) Women who did not have a birth in the past 12 months: 4,492 (2,041 now married, 2,449 unmarried)
Housing units in zip code 25705 with a mortgage: 3,341 (229 second mortgage, 6 home equity loan, 199 both second mortgage and home equity loan) Houses without a mortgage: 54
Median monthly owner costs for units with a mortgage: $1,257 Median monthly owner costs for units without a mortgage: $392
Residents with income below the poverty level in 2022:
This zip code:
17.3%
Whole state:
17.9%
Residents with income below 50% of the poverty level in 2022:
This zip code:
7.1%
Whole state:
9.7%
Median number of rooms in houses and condos:
Here:
7.1
State:
6.5
Median number of rooms in apartments:
Here:
4.6
State:
4.7
Notable locations in this zip code not listed on our city pages
Notable locations in zip code 25705: Guyan Country Club (A), Guyan Golf and Country Club (B), HealthSouth Rehabilitation Hospital (C), Cabell County Emergency Medical Services 2 (D), Huntington Fire Department Station 10 Gallagher (E), Fire Station Number 6 (F), Gallaher Village Branch Cabell County Public Library (G), Green Valley Volunteer Fire Department (H), Special Metals Corporation (I). Display/hide their locations on the map
Shopping Centers: East Hills Mall Shopping Center (1), Eastern Heights Shopping Center (2), Pea Ridge Plaza Shopping Center (3), Harts Family Shopping Center (4). Display/hide their locations on the map
Churches in zip code 25705 include: Norwood Free Methodist Church (A), Church of Christ (B), Lewis Memorial Church (C), Guiding Light Church (D), Walnut Hills Church of the Nazarene (E), Walnut Hills Baptist Church (F), Twentyeight Street Gospel Chapel (G), Saint Johns Episcopal Church (H), Riverview United Methodist Church (I). Display/hide their locations on the map
Cemeteries: Boulevard Memorial Park (1), Highland Cemetery (2), Woodmere Memorial Park (3), Ridgelawn Memorial Park (4), Oaklawn Memorial Park (5), Spring Hill Cemetery (6), Bethel Memorial Park (7). Display/hide their locations on the map
2,507 married couples with children.
1,930 single-parent households (402 men, 1,528 women).
97.6% of residents of 25705 zip code speak English at home.
1.1% of residents speak Spanish at home (95% very well, 5% not well).
0.6% of residents speak other Indo-European language at home (68% very well, 11% well, 8% not well, 13% not at all).
0.4% of residents speak Asian or Pacific Island language at home (48% very well, 52% well).
0.2% of residents speak other language at home (83% very well, 17% well).
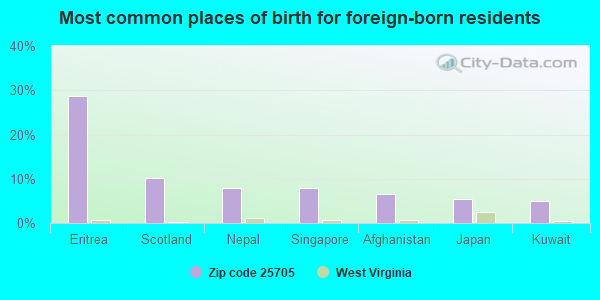
Foreign born population: 352 (1.7%) (67.6% of them are naturalized citizens)
This zip code:
1.7%
Whole state:
1.8%
29%Eritrea
10%Scotland
8%Nepal
8%Singapore
7%Afghanistan
5%Japan
5%Kuwait
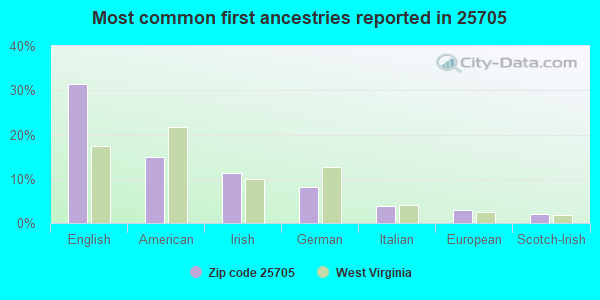
31%English
15%American
11%Irish
8%German
4%Italian
3%European
2%Scotch-Irish
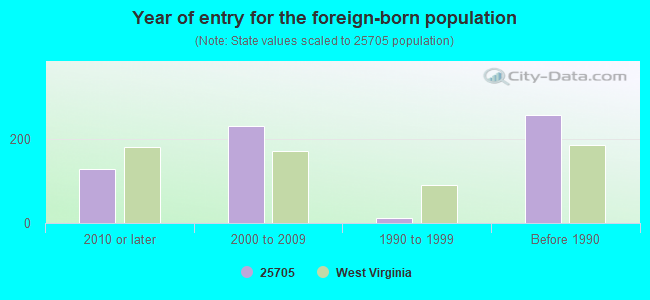
Year of entry for the foreign-born population
1292010 or later
2312000 to 2009
131990 to 1999
258Before 1990
Major facilities with environmental interests located in this zip code:
ALTIZER ELEMENTARY SCHOOL (250 3RD ST in HUNTINGTON, WV)
(Geographic Names Information System) ENFORCEMENT/COMPLIANCE ACTIVITY (Integrated Compliance Information System) COMPLIANCE ACTIVITY (Tracking inspections of insecticide, fungicide, and rodenticide, and toxic substances) (National Center for Education Statistics) - STATE ID-12203 Organizations: CABELL COUNTY SCHOOL DISTRICT (SCHOOL DISTRICT)
BEVERLY HILLS MIDDLE SCHOOL (2901 SALTWELL ROAD in HUNTINGTON, WV)
(National Center for Education Statistics) - STATE ID-12302 Organizations: CABELL COUNTY SCHOOL DISTRICT (SCHOOL DISTRICT)
GENEVA KENT ELEMENTARY SCHOOL (68 HOLLEY AVENUE in HUNTINGTON, WV)
(National Center for Education Statistics) - STATE ID-12233 Organizations: CABELL COUNTY SCHOOL DISTRICT (SCHOOL DISTRICT)
ENVIRONMENTAL PROTECTION ABATEMENT (5343 COUNTY CLUB DR in HUNTINGTON, WV)
(Integrated Compliance Information System) - ICIS-03-1994-0025, FORMAL ENFORCEMENT ACTION
ALL AMERICAN MFG (1006 BONNIE BLVD in HUNTINGTON, WV)
(Resource Conservation and Recovery Act (tracking hazardous waste)) Organizations: OPERNAME (CONTACT/OPERATOR)
, THOMAS JR,CLAY (CONTACT/OWNER)
BLACK DIAMOND SITE (PARK AVENUE in HUNTINGTON, WV)
HAZARDOUS WASTE BIENNIAL REPORTER (Resource Conservation and Recovery Act (tracking hazardous waste)) (Resource Conservation and Recovery Act (tracking hazardous waste)) Organizations: SOCIETY HILLS CLUB LLC (CONTACT/OWNER)
BORON OIL (RT 60 & PEA RIDGE in HUNTINGTON, WV)
(Resource Conservation and Recovery Act (tracking hazardous waste)) Organizations: OPERNAME (CONTACT/OPERATOR)
, SOHIO OIL CO (CONTACT/OWNER)
COLES TRUCK & TRAILER REPAIR (1379 EAST CAMBELL in HUNTINGTON, WV)
(Resource Conservation and Recovery Act (tracking hazardous waste)) Organizations: OPERNAME (CONTACT/OPERATOR)
, COLE ALBERT (CONTACT/OWNER)
FLETCHER J H CO (1029 9TH ST W in HUNTINGTON, WV)
(Resource Conservation and Recovery Act (tracking hazardous waste)) Organizations: OPERNAME (CONTACT/OPERATOR)
, FLETCHER JH & CO (CONTACT/OWNER)
B&M SMALL ENGINE RPR (5290 IRVIN RD in HUNTINGTON, WV)
(Resource Conservation and Recovery Act (tracking hazardous waste)) Organizations: BRIAN LYCANS (CONTACT/OWNER)
CSX TRANSPORTATION INC (23RD ST & 8TH AVE in HUNTINGTON, WV)
Conditionally Exempt Small Quantity Generators, less than 100 kg/month of hazardous waste (Resource Conservation and Recovery Act (tracking hazardous waste)) Business NAICS classification: LINE-HAUL RAILROADS.
DAVIS CHRYSLER PLYMOUTH (5210 RT 60 E in HUNTINGTON, WV)
EASTERN HEIGHTS AUTO SALES (4200 RT 60 E. in HUNTINGTON, WV)
(Resource Conservation and Recovery Act (tracking hazardous waste)) Organizations: TIM WHITLEY (CONTACT/OWNER)
Housing units lacking complete plumbing facilities: 1.9% Housing units lacking complete kitchen facilities: 1.8%
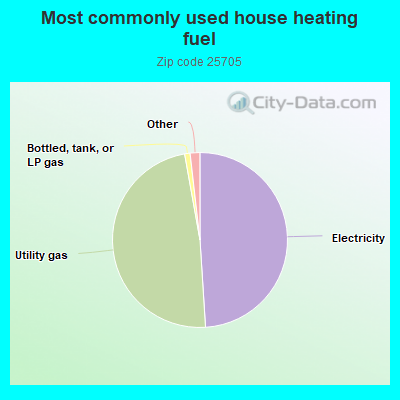
49.0%Electricity
48.2%Utility gas
1.0%Bottled, tank, or LP gas
0.7%Other fuel
0.6%No fuel used
Population in 1990: 22,276.
Place of birth for U.S.-born residents:
This state: 15,078
Northeast: 474
Midwest: 1,445
South: 2,476
West: 277
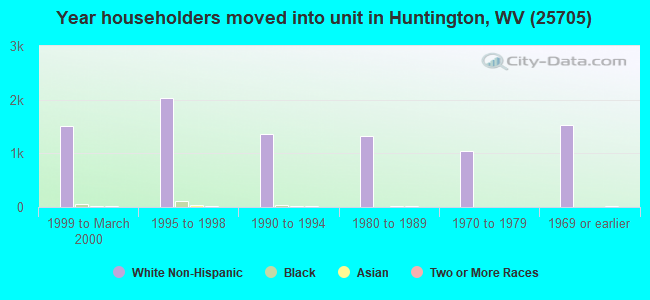
60% of the 25705 zip code residents lived in the same house 5 years ago. Out of people who lived in different houses, 62% lived in this county. Out of people who lived in different counties, 50% lived in West Virginia.
90% of the 25705 zip code residents lived in the same house 1 year ago. Out of people who lived in different houses, 53% moved from this county. Out of people who lived in different houses, 21% moved from different county within same state. Out of people who lived in different houses, 25% moved from different state.
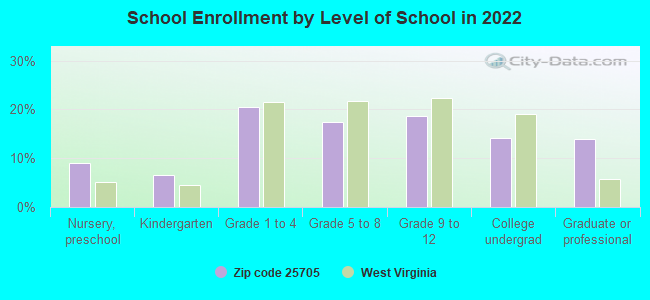
Private vs. public school enrollment:
Students in private schools in grades 1 to 8 (elementary and middle school): 194
Here:
10.0%
West Virginia:
12.2%
Students in private schools in grades 9 to 12 (high school): 63
Here:
6.7%
West Virginia:
8.8%
Students in private undergraduate colleges: 71
Here:
10.0%
West Virginia:
17.3%
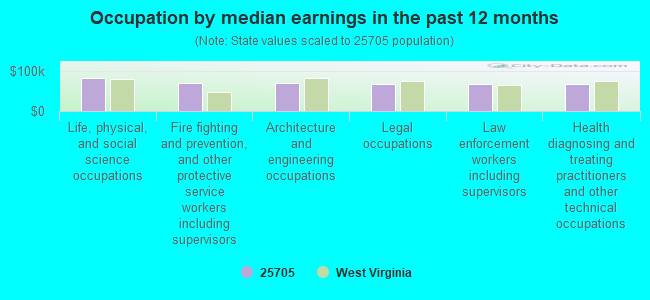
Occupation by median earnings in the past 12 months ($)
83,702Life, physical, and social science occupations
69,779Fire fighting and prevention, and other protective service workers including supervisors
69,547Architecture and engineering occupations
68,914Legal occupations
68,824Law enforcement workers including supervisors
68,721Health diagnosing and treating practitioners and other technical occupations
Companies with biggest federal contracts located in this zip code (HUNTINGTON, WV):
OK MAINTENANCE SERVICE (210 OAKLAND AVE; small business) : $1,476,261 in 432 contractsfrom 2001 to 2005
Contracts for Custodial Janitorial Services, Landscaping/Groundskeeping Services by Army, U.S. Army Corps of Engineers - civil program financing only Signed by year:2000: $0; 2001: $18,938; 2002: $301,873; 2003: $309,456; 2004: $407,652; 2005: $438,342; 2006: $0.
Biggest contracts:
$138,568 with Army for Custodial Janitorial Services. Signed on 2005-09-20. Completion date: 2005-12-31.
$138,568 with U.S. Army Corps of Engineers - civil program financing only for Custodial Janitorial Services. Signed on 2005-09-20. Completion date: 2005-12-31.
$15,900, same as above.Signed on 2003-09-10. Completion date: 2003-09-30.
$15,398, same as above.Signed on 2003-06-17. Completion date: 2003-06-30.
INNOTECH INC (5443 LEA HILL DRIVE; small business) : $521,204 in 31 contractsfrom 2000 to 2006
Contracts for Clothing, Special Purpose, Milling Machines, Video Recording and Reproducing Equipment, Power and Hand Pumps, and moreby Army, U.S. Coast Guard, Navy, U.S. Army Corps of Engineers - civil program financing only, and others Signed by year:2000: $48,931; 2001: $0; 2002: $3,919; 2003: $92,923; 2004: $334,310; 2005: $38,316; 2006: $2,805.
Biggest contracts:
$281,918 with Army for Clothing, Special Purpose. Signed on 2004-09-30. Completion date: 2004-11-26.
$48,931 with Army for Milling Machines. Signed on 2000-01-21. Completion date: 2000-03-19.
$21,600 with Army for Video Recording and Reproducing Equipment. Signed on 2003-07-30. Completion date: 2003-08-25.
$13,771 with U.S. Coast Guard for Power and Hand Pumps. Signed on 2005-05-12. Completion date: 2005-06-07.
INCO ALLOYS INTERNATIONAL, INC (3200 RIVERSIDE DRIVE) : $130,256 in 3 contractsfrom 2002 to 2005
$63,193 with Navy for Bars and Rods, Nonferrous Base Metal. Signed on 2002-04-15. Completion date: 2002-06-17.
$52,344 with Navy for Plate, Sheet, Strip, and Foil; Nonferrous Base Metal. Signed on 2005-03-07. Completion date: 2005-06-27.
$14,719 with NASA for . Signed on 2004-05-07. Completion date: 2004-09-22.
VALLURI ENVIRONMENTAL TECHNICA (6242 HIGHLAND DRIVE; small business) : $90,715 in 7 contractsfrom 2002 to 2006
Contracts for Environmental Studies and Assessments by Army, U.S. Army Corps of Engineers - civil program financing only Signed by year:2000: $0; 2001: $0; 2002: $24,990; 2003: $24,900; 2004: $40,830; 2005: $0; 2006: -$5.
Biggest contracts:
$30,600 with Army for Environmental Studies and Assessments. Taking place in KY. Signed on 2004-08-20. Completion date: 2005-08-22.
$30,600 with U.S. Army Corps of Engineers - civil program financing only for Environmental Studies and Assessments. Taking place in KY. Signed on 2004-08-20. Completion date: 2005-08-22.
$24,990 with U.S. Army Corps of Engineers - civil program financing only for Environmental Studies and Assessments. Signed on 2002-04-09. Completion date: 2002-09-30.
$24,900, same as above.Signed on 2003-05-16. Completion date: 2006-09-30.
ROSS INDUSTRIES, INC. (4400 TERRACE AVE. BUILDING; small business)
$53,838 with Army for Vessel Towing Service. Taking place in GA. Signed on 2000-06-29. Completion date: 2000-10-31.
INCO ALLOYS INTERNATIONAL INC (3200 RIVERSIDE DRIVE)
$53,328 with Navy for Pipe, Tube and Rigid Tubing. Signed on 2003-01-28. Completion date: 2003-06-30.
DIXON ELECTRICAL SYSTEMS & CON (3352 NORWOOD RD; small business) : $51,135 in 2 contractsin 2002
$44,700 with U.S. Army Corps of Engineers - civil program financing only for Fiber Optic Cables. Signed on 2002-01-31. Completion date: 2002-08-30.
$6,435, same as above.Signed on 2002-04-18. Completion date: 2002-08-30.
WIANT CONSULTING (135 ROLAND PARK DR; small business)
$14,064 with Air Force for Educational Services. Taking place in OH. Signed on 2004-06-16. Completion date: 2004-09-10.
CYCLE CENTER INC (4431 US ROUTE 60 E; small business)
$11,350 with U.S. Army Corps of Engineers - civil program financing only for Transport Vessels-Passenger And Troop. Signed on 2003-06-25. Completion date: 2003-09-30.
MAVERICK COMMUNICATIONS INC (315 APPLE ST; small business) : $10,976 in 2 contractsin 2002
$6,101 with U.S. Army Corps of Engineers - civil program financing only for Film/Video Tape Production Services. Signed on 2002-09-25. Completion date: 2002-09-01.
$4,875, same as above.Signed on 2002-07-22. Completion date: 2002-09-01.
Top industries in this zip code by the number of employees in 2005:
Administrative and Support and Waste Management and Remediation Services: Collection Agencies (over 1000 employees: 1 establishment)
2002 - 2018 National Fire Incident Reporting System (NFIRS) incidents
According to the data from the years 2002 - 2018 the average number of fire incidents per year is 94. The highest number of reported fire incidents - 131 took place in 2007, and the least - 53 in 2013. The data has an increasing trend.
When looking into fire subcategories, the most reports belonged to: Structure Fires (41.0%), and Outside Fires (34.1%).
Fire incident types reported to NFIRS in Zip Code 25705
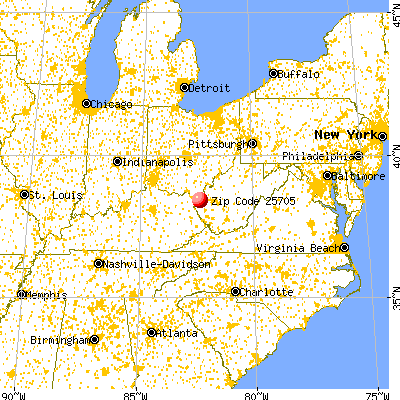


 Nearest zip codes: 25702, 25701, 25703, 45669, 25504, 45619.
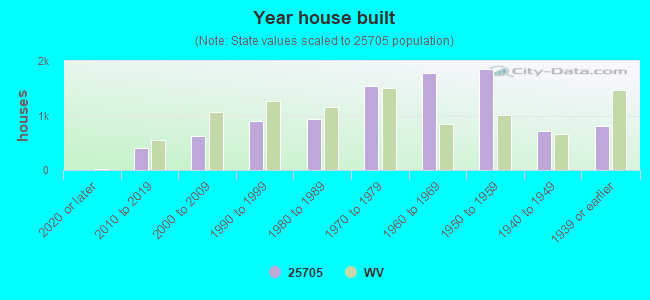


 According to the data from the years 2002 - 2018 the average number of fire incidents per year is 94. The highest number of reported fire incidents - 131 took place in 2007, and the least - 53 in 2013. The data has an increasing trend.
 When looking into fire subcategories, the most reports belonged to: Structure Fires (41.0%), and Outside Fires (34.1%).